Sample Category Title
Will Yen Continue To Outperform In 2019?
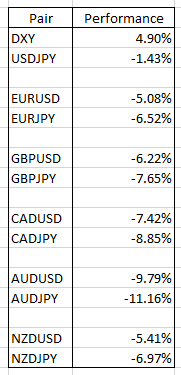
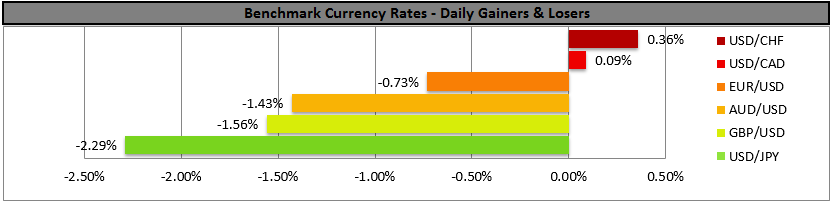
Care to guess what is the best performing major currency in 2018? Chances are you will say that it’s the US Dollar. Although US Dollar is doing pretty well this year, the best performing currency is in fact the Japanese Yen. You can see in the table below that despite the Dollar Index rallying 4.9% as of Dec 27th, the Yen has outperformed the U.S Dollar by 1.43%. We can also see the U.S. Dollar has rallied against all the other major currencies, but the Japanese Yen has rallied even at a greater percentage against the same currency. For example, EURUSD has dropped 5.08%, meaning that U.S Dollar has rallied 5.08% against European Dollar this year. However, EURJPY dropped 6.5%, which means that Japanese Yen has rallied at a greater percentage against the European dollar.
The market as always is a discount mechanism and it discounts events several months and years in advance. The BOJ (Bank of Japan) has embarked in a massive quantitative easing since 2013 and it’s the only major central banks that still maintains the program. The Fed has started to unwind the quantitative easing and normalize the balance sheet while the ECB has stopped the program.
BOJ is caught in a conundrum. The 2% inflation target remains as elusive as ever, and the recent selloff in Oil should further damp the outlook. BOJ Governor Haruhiko Kuroda admitted that BOJ must weigh in the negative cost of prolonged monetary easing. For example, it can hurt financial institutions’ profits and discourage them from boosting lending. The change in attitude underscores the rising hurdle for meeting BOJ’s price goal. Minutes of the October rate review shows a rift within the BOJ as board members disagree on the prolonged easing.
Last month, Kuroda also said that Japan no longer needs to “decisively implement a large-scale policy to overcome deflation.” This is perhaps the most specific hint that BOJ is preparing to exit from the most aggressive quantitative easing experiment. Couple this with the Fed’s rate hike path running out of steam, the Yen likely can continue to get stronger in 2019. This is the scenario where BOJ reduces stimulus as the Fed pauses. An anticipated end to BOJ’s negative interest rate policy in 2019 should make the yen more attractive.
Below we will take a look at Elliott Wave outlook for two Yen crosses: GBPJPY and EURJPY. We will check to see what the technical tells us about the outlook for Yen pairs in 2019.
GBPJPY Daily Elliott Wave Outlook 12.27.2018
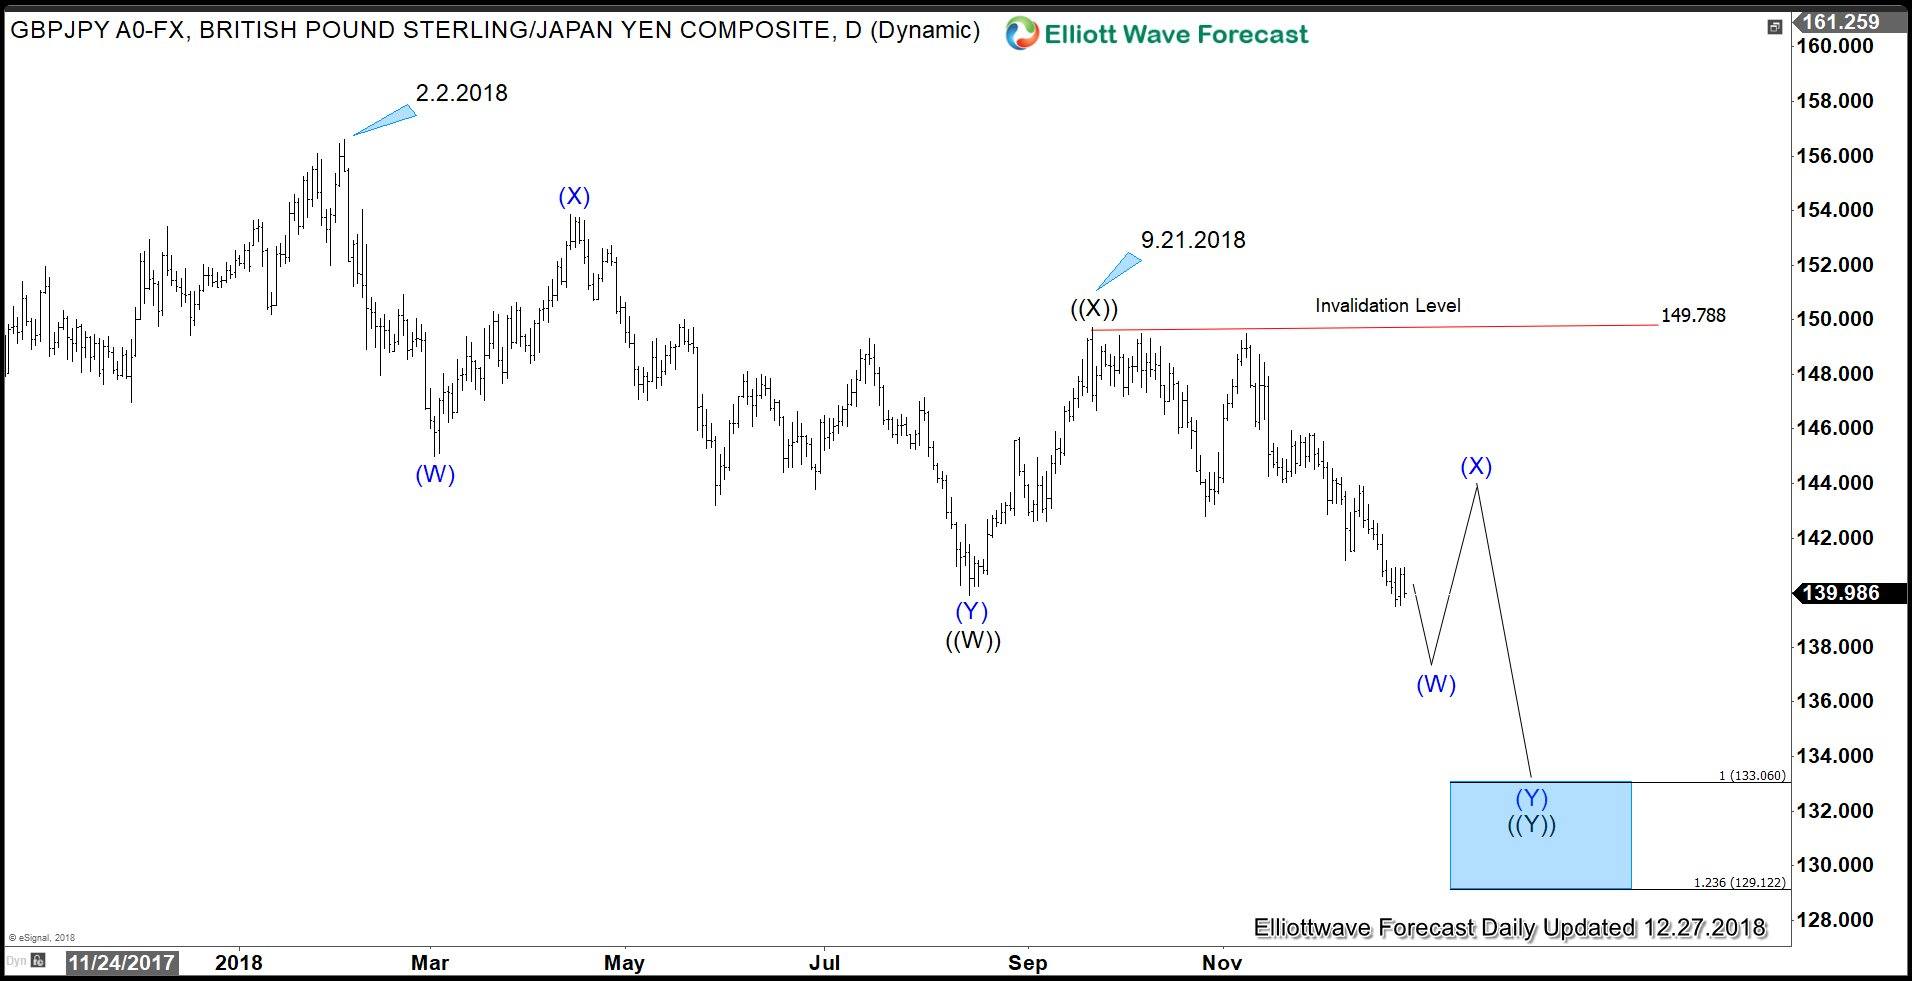
GBPJPY Daily Elliott Wave chart above suggests that cycle from 2.2.2018 high shows an incomplete bearish sequence towards the target of 129.1 – 133.06. This view is valid as far as pair remains below 9.21.2018 high (149.78) which is the invalidation level. The decline from 2.2.2018 high is a textbook 7 swing double three Elliott Wave structure (WXY) This chart confirms that Japanese Yen will continue to outperform against Pound Sterling in 2019.
CADJPY Daily Elliott Wave Outlook 12.27.2018
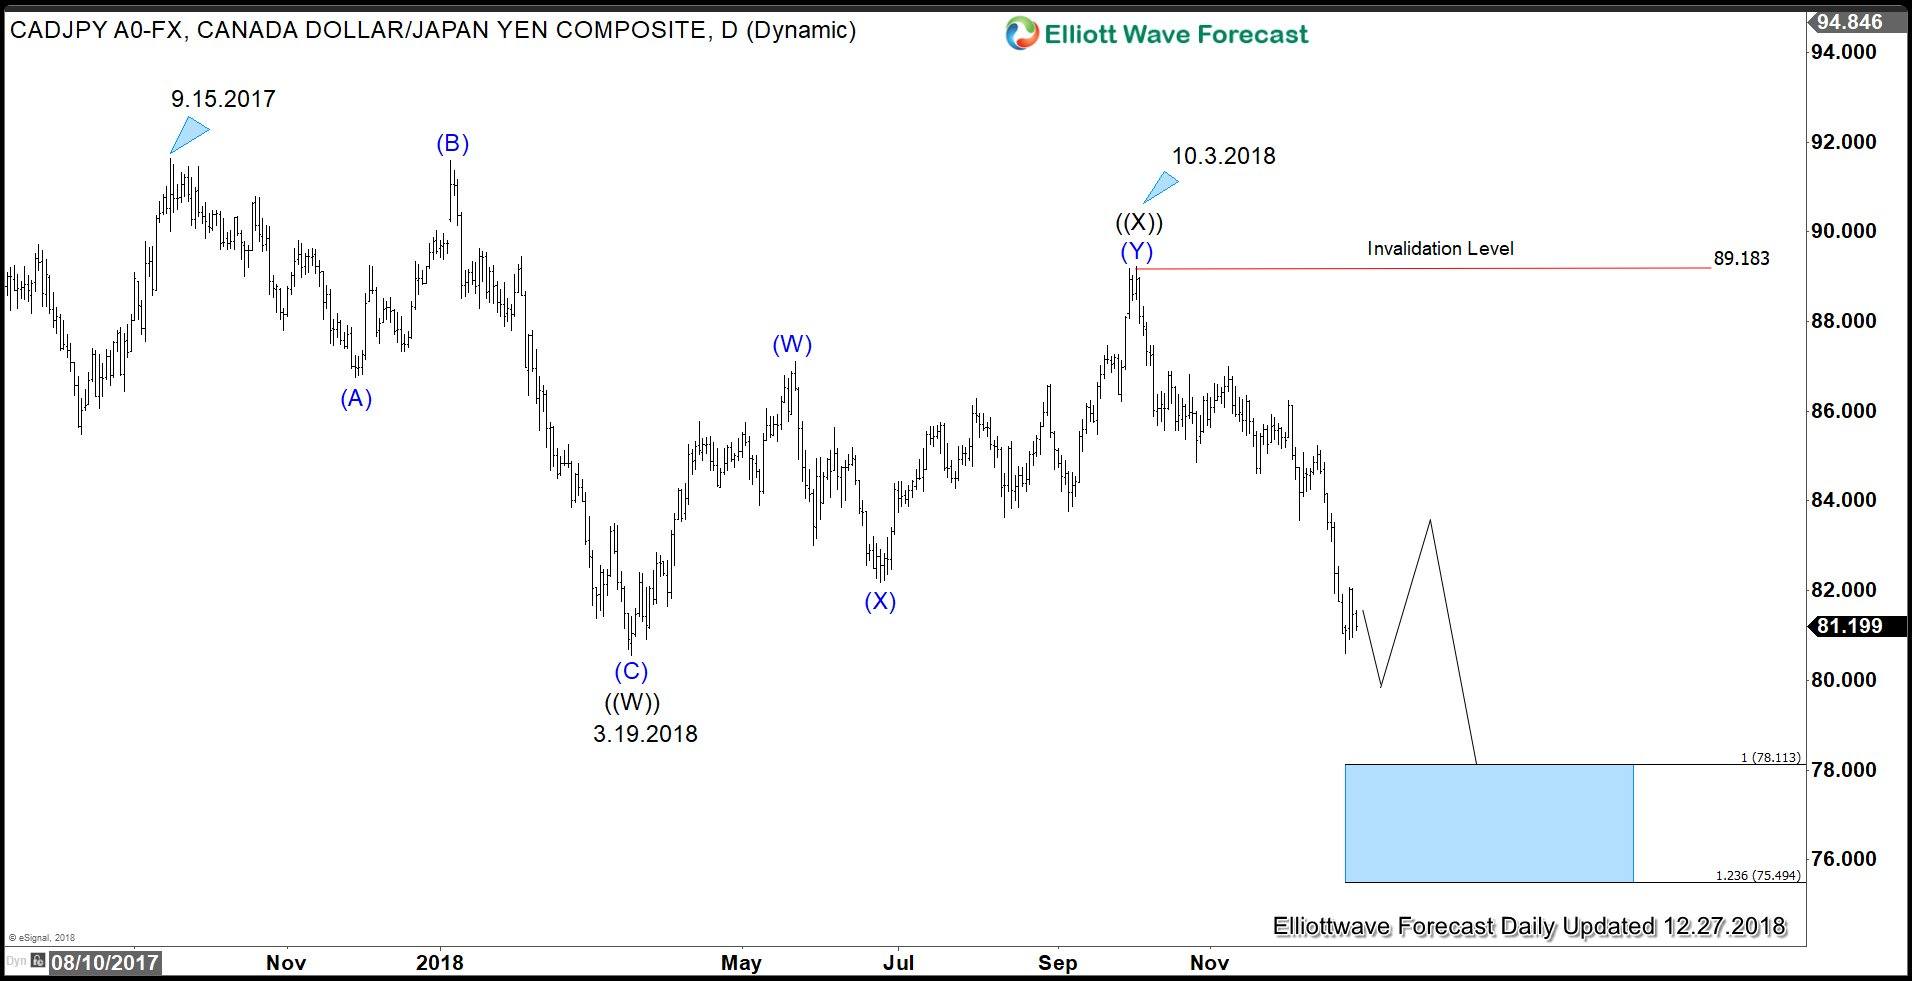
CADJPY Daily Elliott Wave chart above also shows that cycle from 9.15.2017 high shows an incomplete bearish sequence towards the target of 75.49 – 78.11. This view is valid as far as pair remains below 10.3.2018 high (89.18) which is the invalidation level. The decline from 9.15.2017 high is also 7 swing double three Elliott Wave structure (WXY). The first leg Primary wave ((W)) unfolded as a Flat Elliott Wave structure (A)-(B)-(C) with 3-3-5 structure. This chart confirms that Japanese Yen will continue to outperform against Canadian Dollar in 2019.
In conclusion, both GBPJPY and CADJPY Elliott Wave outlook confirms the thesis that Japanese Yen can continue to outperform. The market price action has spoken and the current strength in Japanese Yen discounts the future in which BOJ reduces stimulus and the Fed pauses the rate hike.
USD/CAD Bullish Range Play With A Potential For 1.3690
The USD/CAD has been unscathed by the huge FX flash crash during low liquidity in early Asian trade. Seems like accumulation phase now before the mark up
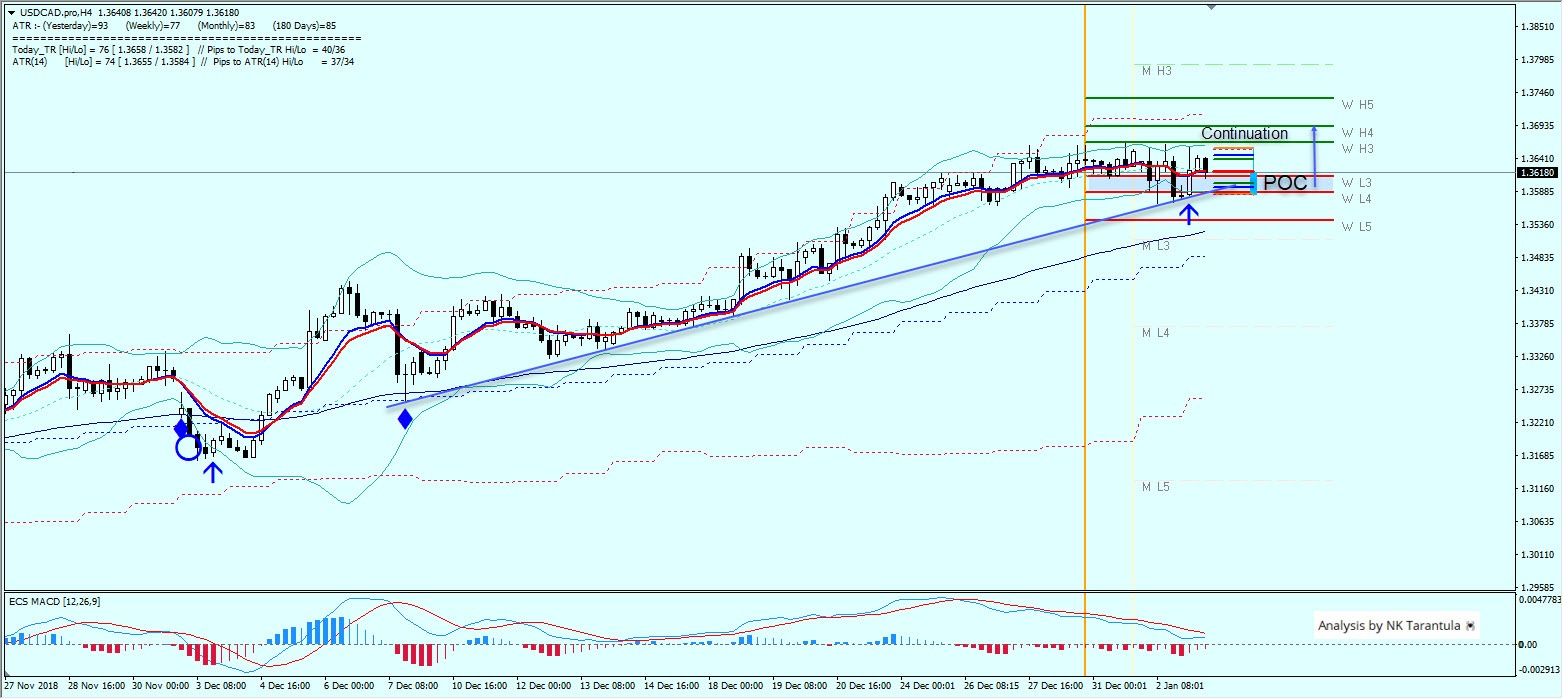
Amidst huge YEN buying and massive AUD selling during early Asia market, the USD/CAD has been virtually unchanged. There was no stop triggering here. Ascending trend line, price above W L3, a rejection from the ATR low suggest a possible trend resumption from the 1.3605-15 zone. Targets are 1.3655 and 1.3690. However, the price should ideally stay above 1.3580 for uptrend to persist. If it drops below, we might see a bigger correction.
Position trading: EUR/JPY short met target, and some reflections
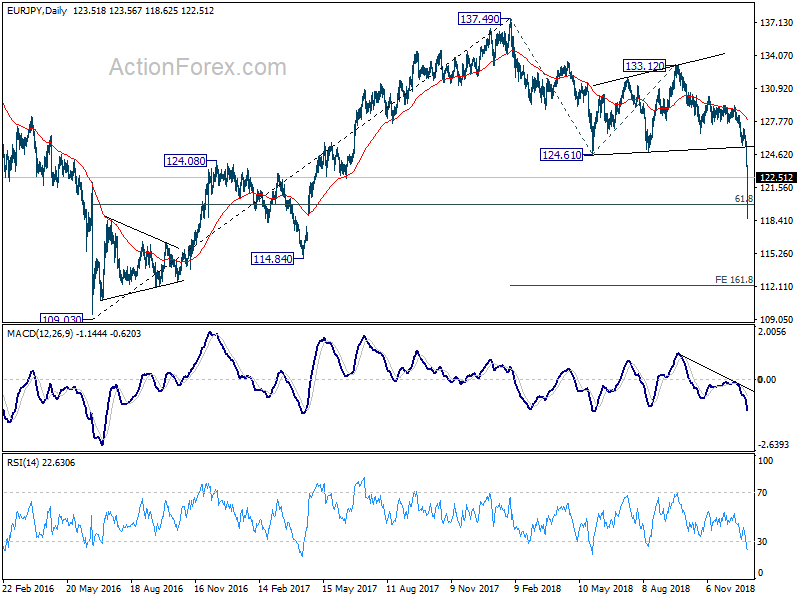
Here is a quick update to our EUR/JPY short trade (sold at 127.80, stop at 127.10, target at 120.00) as last updated here. The target of 120.00 was met as EUR/JPY spiked to 118.62 during the "Currency Flash Crash" in Asian session. We've exited with 780 pips profit.
Admittedly, there's luck, quite a lot of, as the downward move today is rather exaggerated. But technically, the ideal case did happen as there was downside acceleration through 124.08 key support level. The bearish case played out well and it's just a matter of time when the mentioned 61.8% retracement of 109.03 to 137.49 at 119.90 is met. For now, we'll hold our hands off first as there will be heavy weight non-farm payrolls to be released tomorrow. We'll post new strategy, if there would be any good one(s), in the upcoming weekly report.
Meanwhile, there are some reflections on the trade and related ideas we've posted in 2018:
- The strategy was first posted back on November 24 here. Back then, AUD/JPY was a better candidate for selling. But due to the uncertainty of Trump-Xi summit, we chose EUR/JPY over AUD/JPY. Looking back, AUD/JPY is still a much better choice, if not for that uncertainty.
- It took more than five weeks for the trade to play out and it's rather boring in between. But patience usually pays.
- We're using the relatively "longer" time frame as a way to demonstrate the strategy and analysis in "slow motion". Thus, we've got time to explain our thinking process throughout. Yet the trade was live. And we hope our readers could get something out of the updates.
- With 780 pips profit pocked at the start of 2019, we now have some bullets to probe other opportunities.
- But finally, we'd emphasize that the strategies won't suit everybody. Traders are advised to choose strategies that suit their temperament.
The US Dollar Index Is In Plus
The US dollar strengthened significantly against the euro, the pound and a number of commodity currencies amid low trading volumes during the holidays. The dollar index (#DX) closed yesterday in the positive zone (+0.72%). The demand for safe-haven currency has grown significantly. Financial markets participants are concerned about the slowdown in global economic growth, as well as uncertainty in financial markets.
China published weak data on economic activity in the manufacturing sector of the country. Also, investors expect information on how soon the US government will work again. It should be recalled that the work of the US government was suspended at the insistence of the US President Donald Trump, who demanded to start building a wall on the border with Mexico.
The British pound weakened against the US dollar due to concerns about Brexit. In the British Parliament, there are still disagreements regarding the terms of the Brexit deal on the Irish border. By the end of January, a vote on the bill offered by Theresa May should take place.
The 'black gold' prices slightly decreased after a sharp rally the day before. At the moment, futures for the WTI crude oil are testing the mark of $45.75 per barrel.
Market Indicators
- Yesterday, major US stock indices closed in the positive zone: #SPY (+0.10%), #DIA (+0.07%), #QQQ (+0.40%).
- Currently, the 10-year US government bonds yield is at the level of 2.62-2.63%.
The news feed on 03.01.2018:
- The index of economic activity in the UK construction sector at 11:30 (GMT+2:00);
- ADP nonfarm employment change in the US at 15:15 (GMT+2:00);
- Initial jobless claims in the US at 15:30 (GMT+2:00);
- ISM manufacturing PMI in the US at 17:00 (GMT+2:00).
Yen Strengthens On Risk Aversion
JPY strengthened against the USD and a number of other currencies yesterday as the risk averse mood was highly charged during the Asian session today. The 'flash crash', as described by a number of analysts, was instigated by a rare revenue warning from Apple Inc. which cited among other reasons for a possible drop in revenue, an economic slowdown of China. The warning caused an immediate reaction by market participants, prompting a strengthening of the JPY and a weakening of the AUD. The effect was magnified as it was a rather quiet time, with Japan having a Bank holiday and the American Session being over. Analysts also point out that the yen could be considered as undervalued currently and should there be further US Dollar weakness, or further downward revisions about the global economy, it could strengthen even further. USD/JPY dropped heavily during the Asian session today, breaking consecutively all support levels and correcting later on below the 107.40 (R1) resistance line. We maintain a bearish outlook for the pair, as uncertainty may continue to prevail over the market. Should the bears continue to reign over the pair's direction, we could see the USD/JPY breaking the 106.65 (S1) support line and aim for the 106.00 (S2) support barrier. Should on the other hand the bulls take over we could see the pair breaking the 107.40 (R1) resistance line and aim for the 108.25 (R2) resistance level.
USD strengthens against EUR and GBP
USD climbed against the common currency and the sterling during the American session yesterday as lukewarm financial data kept the EUR down. Analysts point out that data from the euro area was generally on the softer side and that the US-Sino trade war may have hit factory activity in the EUR area as well, in December. The greenback strengthened also against the sterling as strong financial data, failed to dispel ongoing Brexit worries. We expect volatility to continue to reign over the two pairs as uncertainty could continue throughout the day. EUR/USD dropped yesterday breaking all support levels, however correcting above the 1.1345 (S1) support line during the Asian session today. We could see the pair continuing to correct, however it may prove sensitive to any financial releases especially regarding the USD side. Should the market favor the pair's long positions, we could see the pair breaking the 1.1385 (R1) resistance line and aim for the 1.1425 (R2) resistance hurdle. Also should the pair come under the market's selling interest, we could see it breaking the 1.1345 (S1) support line and aim for the 1.1305 (S2) support barrier.
In today's other economic highlights:
In today's European session, we get Turkey's CPI and UK's Construction PMI, both for December. In the American session, from the US we get the ADP National Employment figure for December, the initial jobless claims figure, the number of new home sales for November and the ISM manufacturing PMI for December.
What to expect for Tomorrow:
Tomorrow during the European session we get the Eurozone's preliminary CPI rates for December and UK's Services PMI also for December. The star of the day though could be the US Employment report with its NFP figure for December.
USD/JPY H4
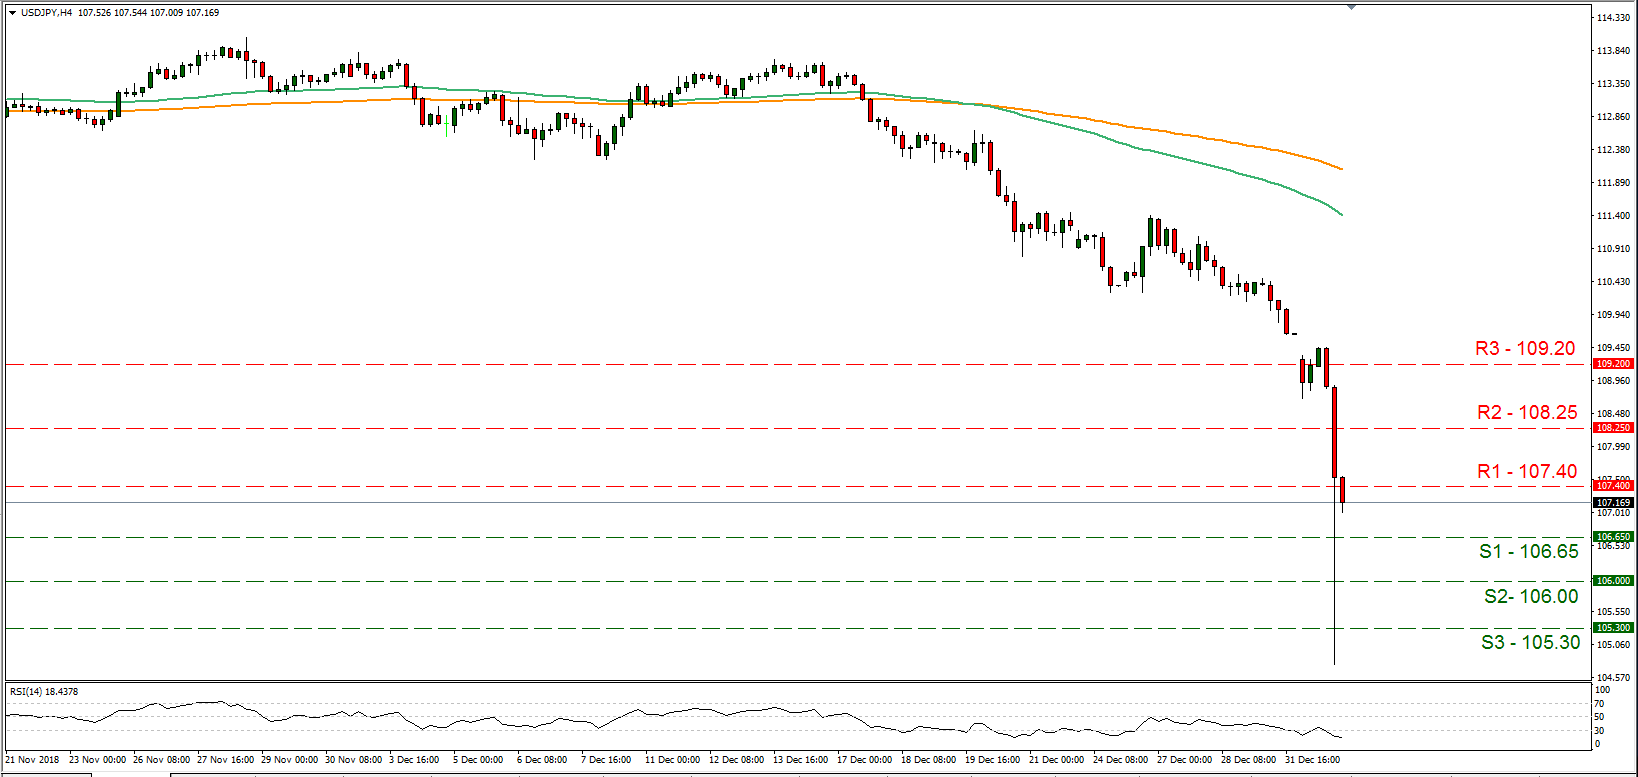
Support: 106.65 (S1), 106.00 (S2), 105.30 (S3)
Resistance: 107.40 (R1), 108.25 (R2), 109.20 (R3)
EUR/USD H4
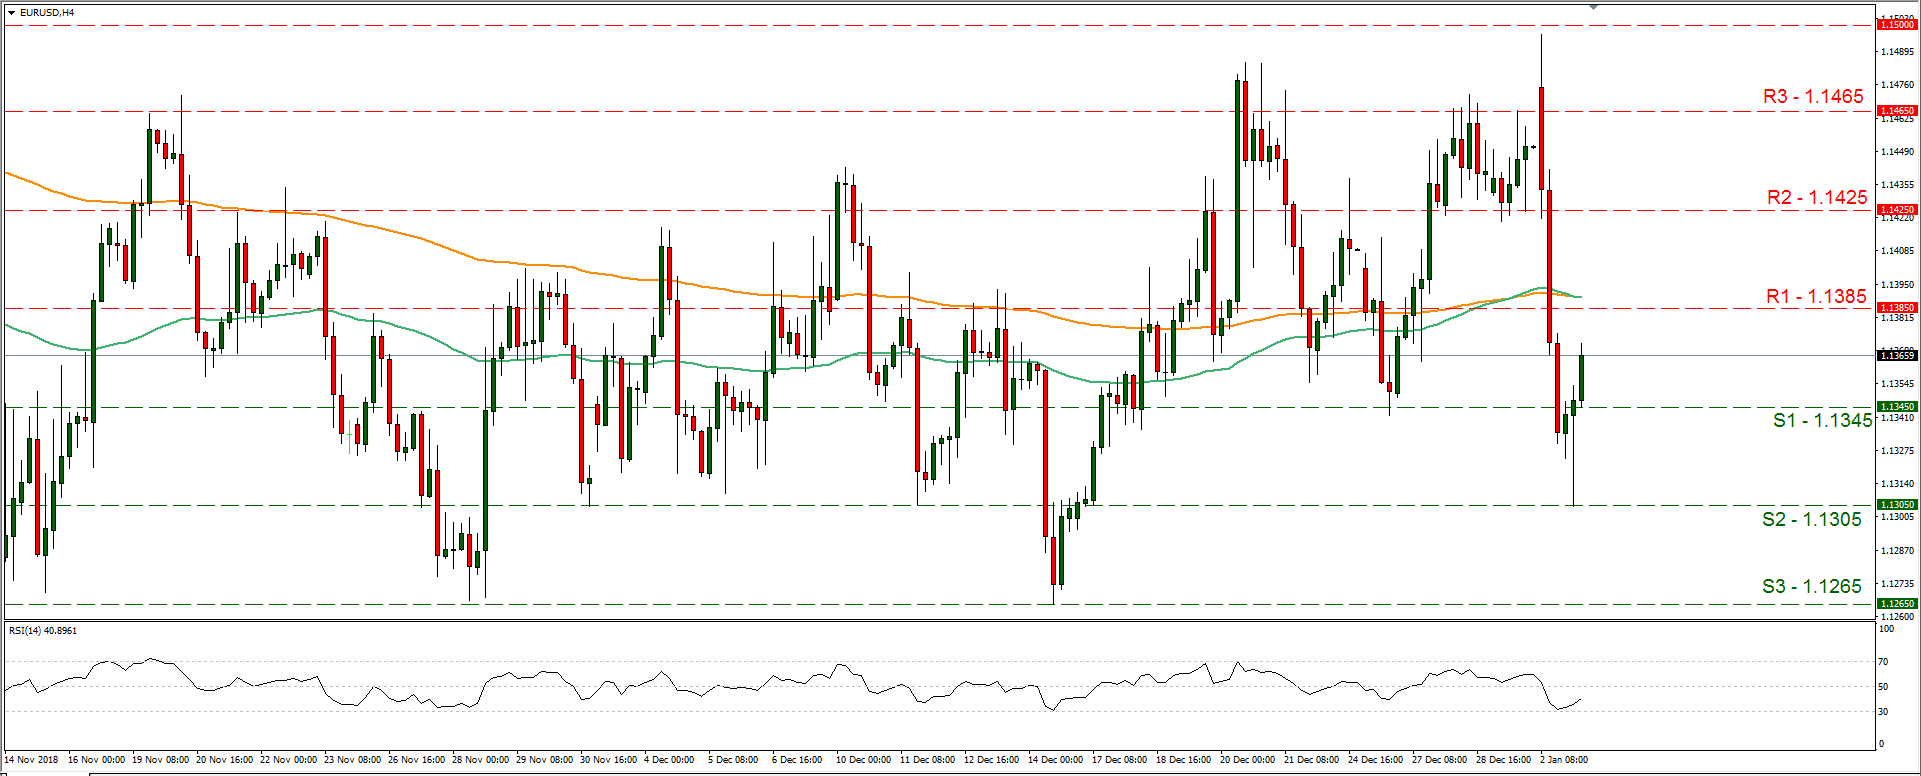
Support: 1.1345 (S1), 1.1305 (S2), 1.1265 (S3)
Resistance: 1.1385 (R1), 1.1425 (R2), 1.1465 (R3)
China’s Prospects Collapsed Apple Forecasts
Apple Inc on Wednesday took the rare step of cutting its quarterly sales forecast, with Chief Executive Tim Cook blaming slowing iPhone sales in China, whose economy has been dragged down by uncertainty around U.S.-China trade relations. The news, which comes as a spotlight grows on Beijing’s attempts to revive stalling growth, sent Apple shares tumbling in after-hours trade, hammered Asian suppliers and triggered a broader selloff in global markets.
The revenue drop for the just-ended quarter underscores how an economic slowdown in China has been sharper than many expected, catching companies and leaders in Beijing off balance and forcing some to readjust their plans in the market. Apple finds itself in a tricky position in China, a key market for sales and where it manufactures the bulk of the iconic products it sells worldwide, after the high-profile arrest in Canada of the CFO of domestic rival Huawei Technologies Co Ltd [HWT.UL].
Apple on Wednesday lowered its forecast to $84 billion in revenue for its fiscal first quarter ended Dec. 29, below analysts’ estimate of $91.5 billion, according to IBES data from Refinitiv. Apple originally forecast revenue of between $89 billion and $93 billion. Apple shares skidded 7.7 percent in after-hours trade, dragging the company’s market value below $700 billion. In the broader market, the S&P 500 futures fell 1.5 percent. In the U.S. government bond market, a typical safe-haven, the yield on the benchmark 10-year, which moves inversely to the bond’s price, sank to an 11-month low.
UK PMI construction dropped to 52.8, slowdown in housing and commercial activity growth
UK construction PMI dropped to 52.8 in December, down from 53.4 and missed expectation of 52.9 slightly. Markit noted that "business activity expands at weakest pace for three months", "softest rise in commercial work since May 2018", but "rebound in business optimism amid hopes of infrastructure boost in 2019".

Tim Moore, Economics Associate Director at IHS Markit, which compiles the survey:
"UK construction firms signalled a slowdown in housing and commercial activity growth during December, which more than offset a strong performance for civil engineering at the end of 2018.
"Subdued domestic economic conditions and an intense headwind from political uncertainty resulted in the weakest upturn in commercial work for seven months.
"Strong demand among first-time buyers meant that house building was the fastest growing category of construction output during 2018. However, construction companies indicated a renewed loss of momentum in December. Residential growth remains much softer than the two-and-a-half year peak achieved last summer.
"Civil engineering was the stand-out area of construction growth in December, with activity rising at the fastest pace since May 2017. Survey respondents also noted that the strengthening infrastructure pipeline is set to become a key engine of growth in 2019, despite concerns about possible delays to the delivery of major projects.
"An expected boost from transport and energy projects underpinned a rise in business optimism to an eight-month high in December. Construction sector confidence was also helped by softer input cost inflation and signs of a turnaround in supply chain difficulties from the low point seen last August. However, levels of optimism remained subdued in relation to those recorded by the survey over much of the past six years, largely reflecting concerns that Brexit uncertainty will continue to encourage delays with decision-making, especially on commercial projects."
The Analytical Overview Of The Main Currency Pairs
The EUR/USD currency pair
Technical indicators of the currency pair:
Prev Open: 1.14572
Open: 1.13461
% chg. over the last day: -1.30
Day's range: 1.13042 – 1.13765
52 wk range: 1.1214 – 1.2557
The EUR/USD currency pair saw a massive sell-off yesterday. The quotes fell by 100 points. The investors are worried about the slowdown in the world economic growth, as well as the ambiguousness at the financial markets. The EUR is consolidating at 1.13450 and 1.13750 and can descend further.
The Economic News Feed for 03.01.2019:
ADP's Preliminary Labour Market Report (US) – 15:15 (GMT+2:00);
ISM's Industrial PMI (US) – 17:00 (GMT+2:00);
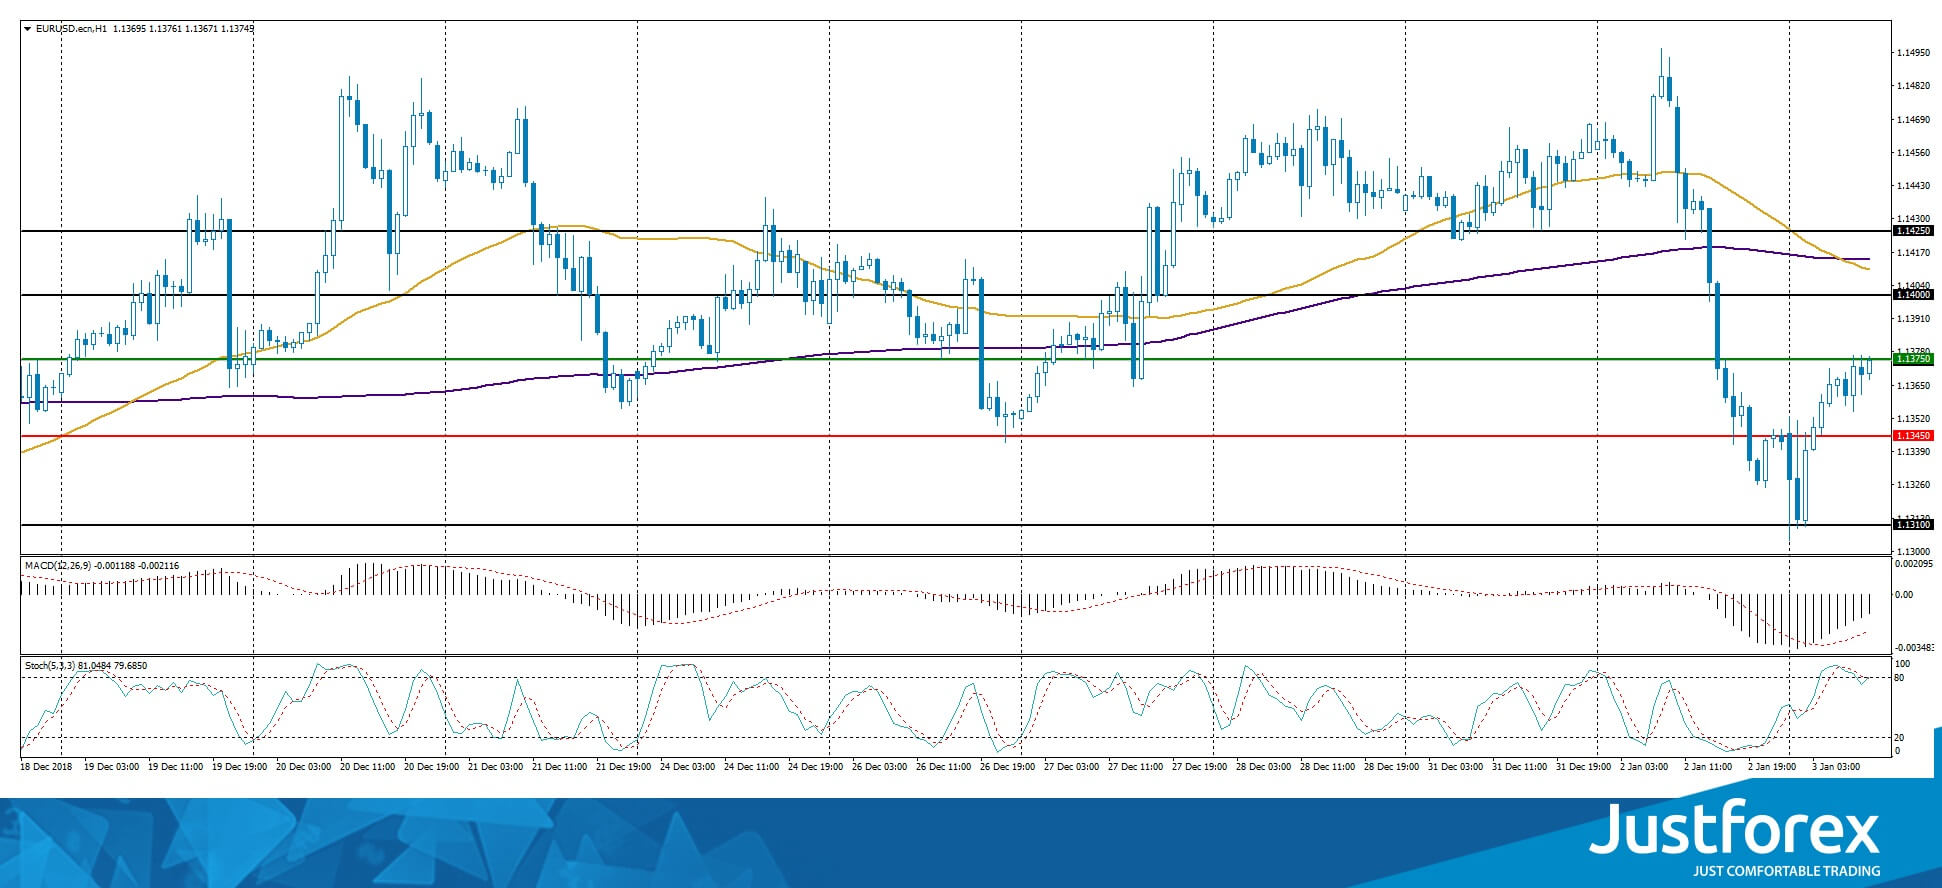
The indicators do not provide precise signals: 50 MA is crossing 200 MA.
The MACD histogram is in the negative zone but above the signal line, which gives a weak signal towards the EUR/USD sale.
The Stochastic Oscillator is around the overbought zone, the %K line is crossing the %D line. There are no signals at the moment.
Trading recommendations
Support levels: 1.13450, 1.13100
Resistance levels: 1.13750, 1.14000, 1.14250
If the price fixes above 1.13750 expect further correction toward 1.14000-1.14250.
Alternatively, the price can descend further toward 1.13250-1.13000
The GBP/USD currency pair
Technical indicators of the currency pair:
Prev Open: 1.27172
Open: 1.25984
% chg. over the last day: -1.85
Day's range: 1.24291 – 1.26014
52 wk range: 1.2438 – 1.4378
GBP/USD is in the middle of an aggressive sell-off. The pound updated the key minimums. The market participants are worried about the Brexit ambiguousness. The GBP/USD quotes are consolidating at 1.25300 and 1.25800. Positions should be opened from the key levels.
At 11:30 (GMT +2:00) the UK will publish the Construction PMI.
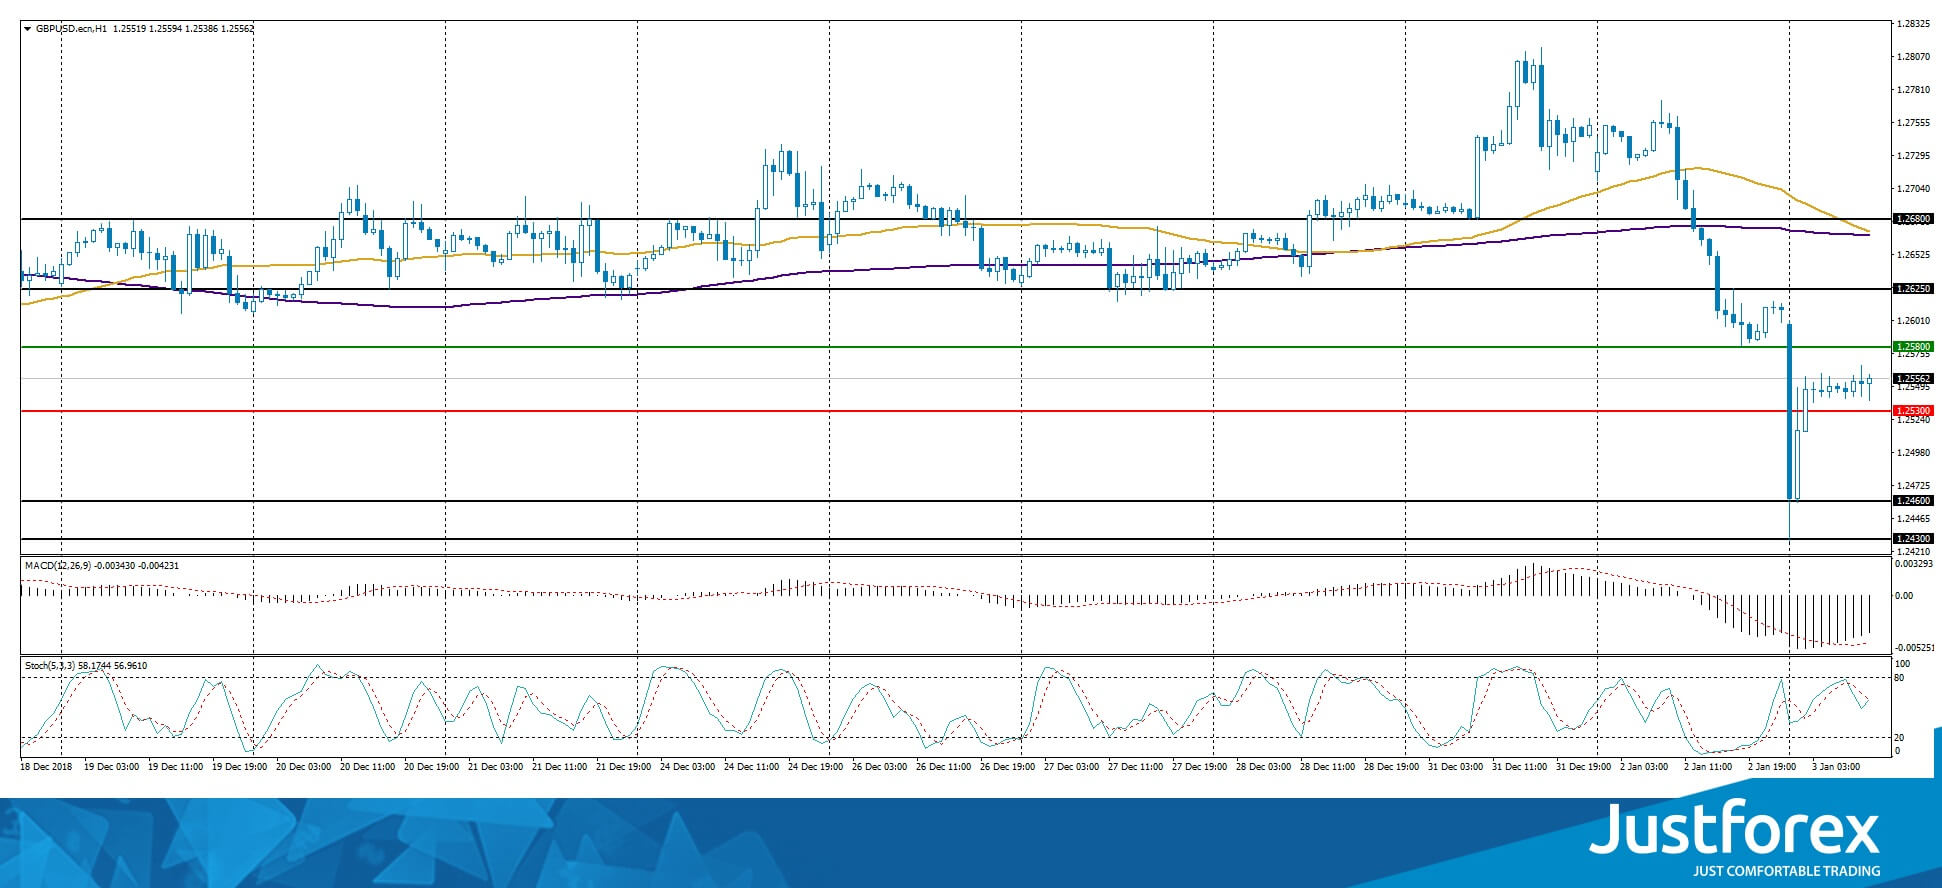
The price fixed below 50 MA and 200 MA which points toward the power of the buyers.
The MACD histogram is in the negative zone, but above the signal line which gives a weak signal to sell GBP/USD.
The Stochastic Oscillator is in the neutral zone, the %K line is crossing the %D line. There are no signals at the moment.
Trading recommendations
Support levels: 1.25300, 1.24600
Resistance levels: 1.25800, 1.26250, 1.26800
If the price fixes above 1.25800, expect the currency pair to recover toward 1.26250-1.26500.
Alternatively the quotes can fall toward 1.24300-1.24600.
The USD/CAD currency pair
Technical indicators of the currency pair:
Prev Open: 1.36157
Open: 1.35840
% chg. over the last day: -0.15
Day's range: 1.35764 – 1.36544
52 wk range: 1.2248 – 1.3664
USD/CAD remains in a long flat without a single defined tendency. You should open positions from the key levels of 1.36000 and 1.36400. A technical correction is possible soon. You should keep an eye on the US economic reports.
The Economic News Feed for 03.01.2019 is calm.
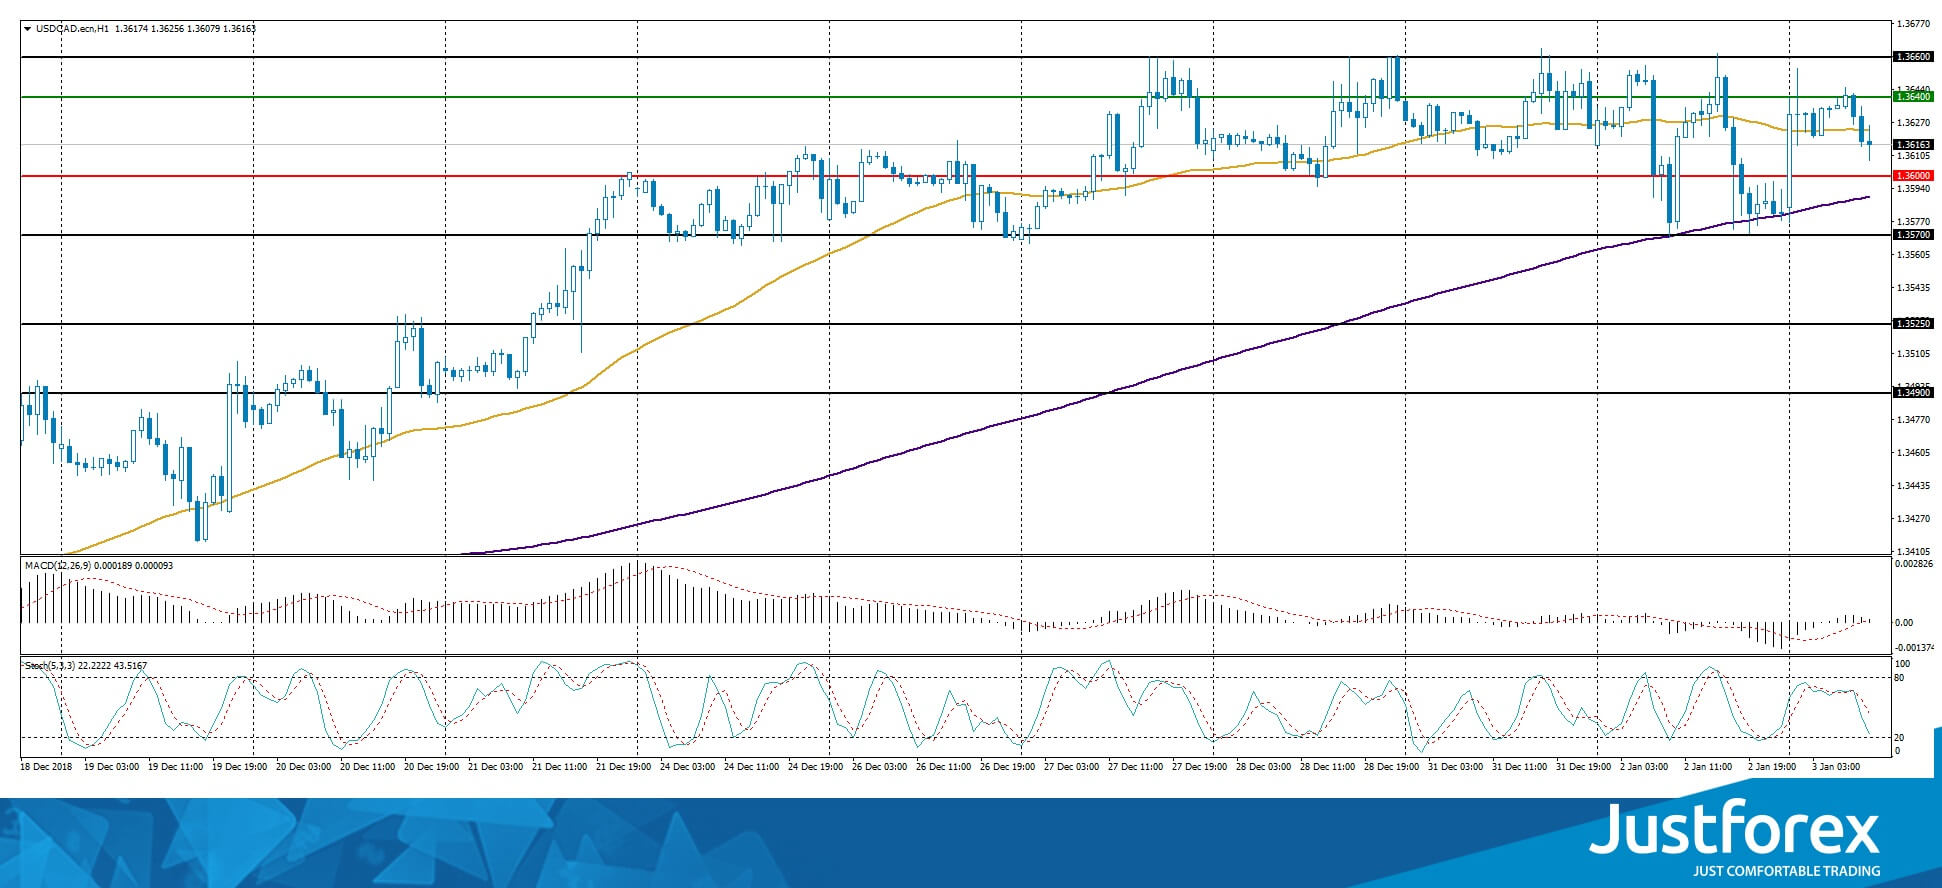
There are no precise signals, the price has crossed 50 MA.
The MACD histogram is close to 0.
The Stochastic Oscillator is in the neutral zone, the %K line is below the %D line, which points toward a bearish sentiment.
Trading recommendations
Support levels: 1.36000, 1.35700, 1.35250
Resistance levels: 1.36400, 1.36600, 1.37000
If the price fixes below 1.36000 the currency pair will correct toward 1.35700-1.35500.
Alternatively the quotes can grow toward 1.36500-1.36750.
The USD/JPY currency pair
Technical indicators of the currency pair:
Prev Open: 109.645
Open: 108.863
% chg. over the last day: -2.08
Day's range: 104.905 – 108.899
52 wk range: 104.56 – 114.56
The demand for the safe-haven currencies keeps growing. The financial market participants are worried about the world economy. During the Asian trading sessions USD/JPY updated the key minimums and is consolidating at 107.000-107.850. Positions should be opened from these levels. A technical correction is possible soon.
The Japanese financial markets are closed due to the holiday season.
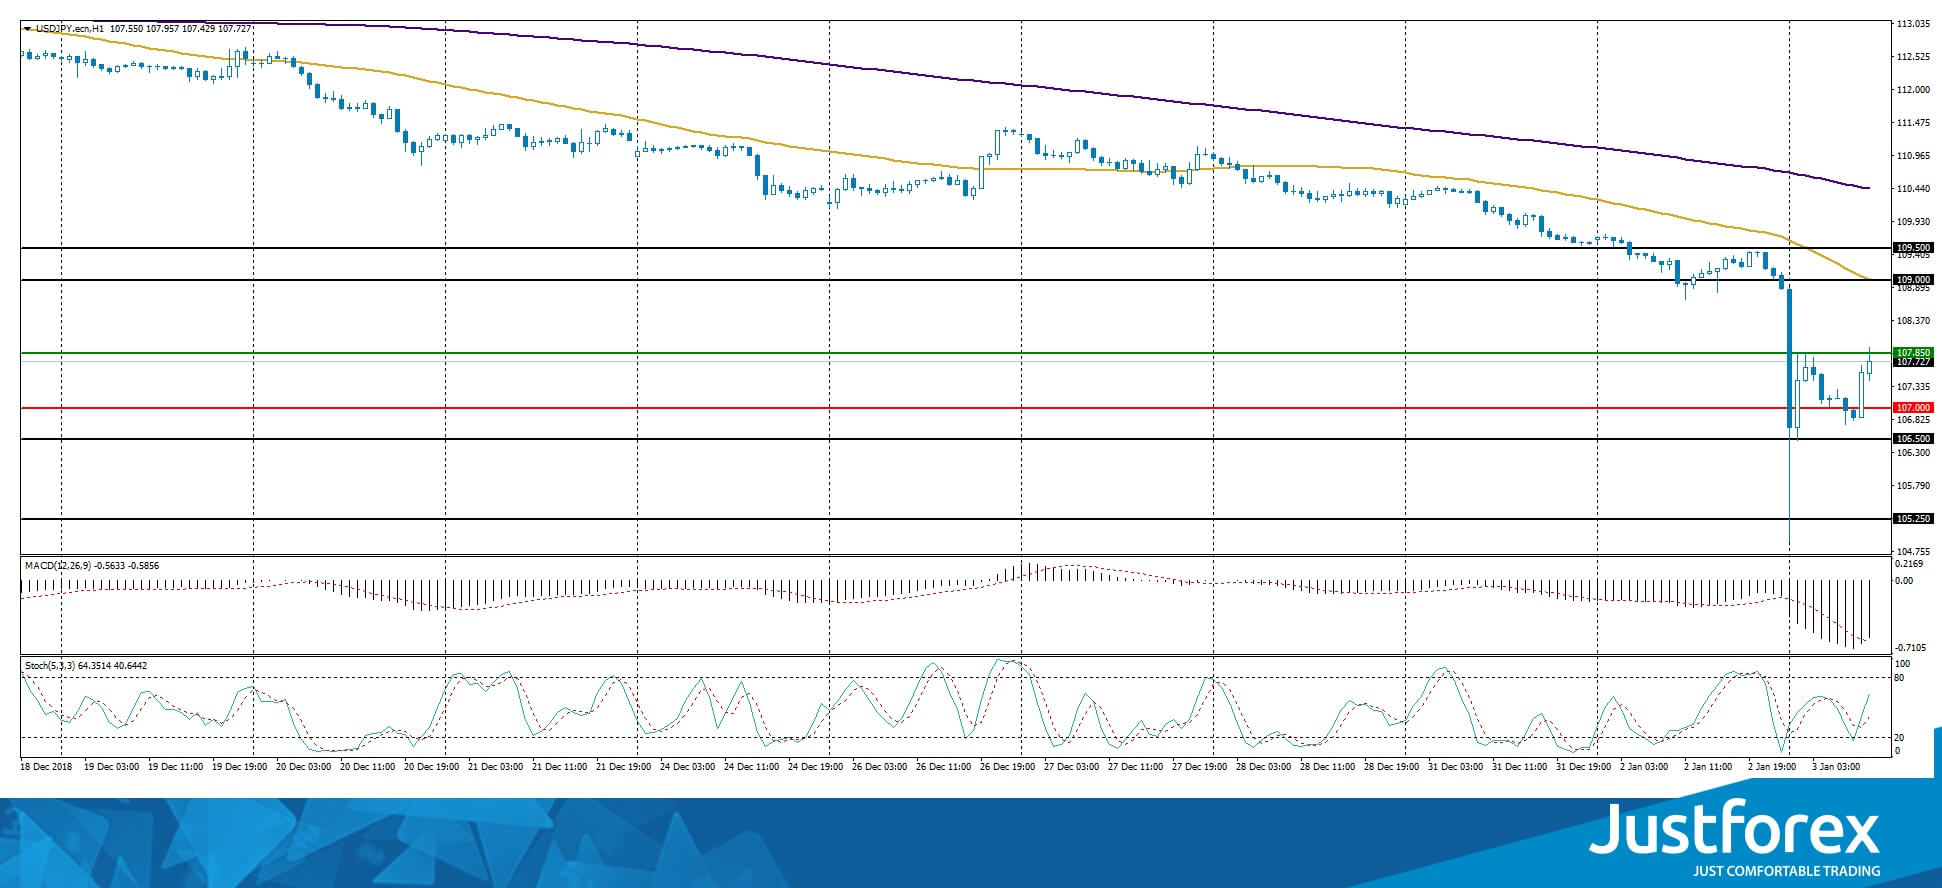
The price fixed below 50 MA and 200 MA which points toward the power of the buyers.
The MACD histogram is in the negative zone but above the signal line, which gives a weak signal toward the sale of USD/JPY.
The Stochastic Oscillator is in the neutral zone, the %K line is above the %D line, which points toward the USD/JPY recovery.
Trading recommendations
Support levels: 107.000, 106.500, 105.250
Resistance levels: 107.850, 109.000, 109.500
If the price fixes above the local resistance of 107.850 expect further correction of USD/JPY toward 108.500-108.750.
Alternative ly the quotes can descend further toward 106.500-106.000.
EURJPY Holds Above Multi-Month Low Of 118.57, Strongly Negative In Medium Term
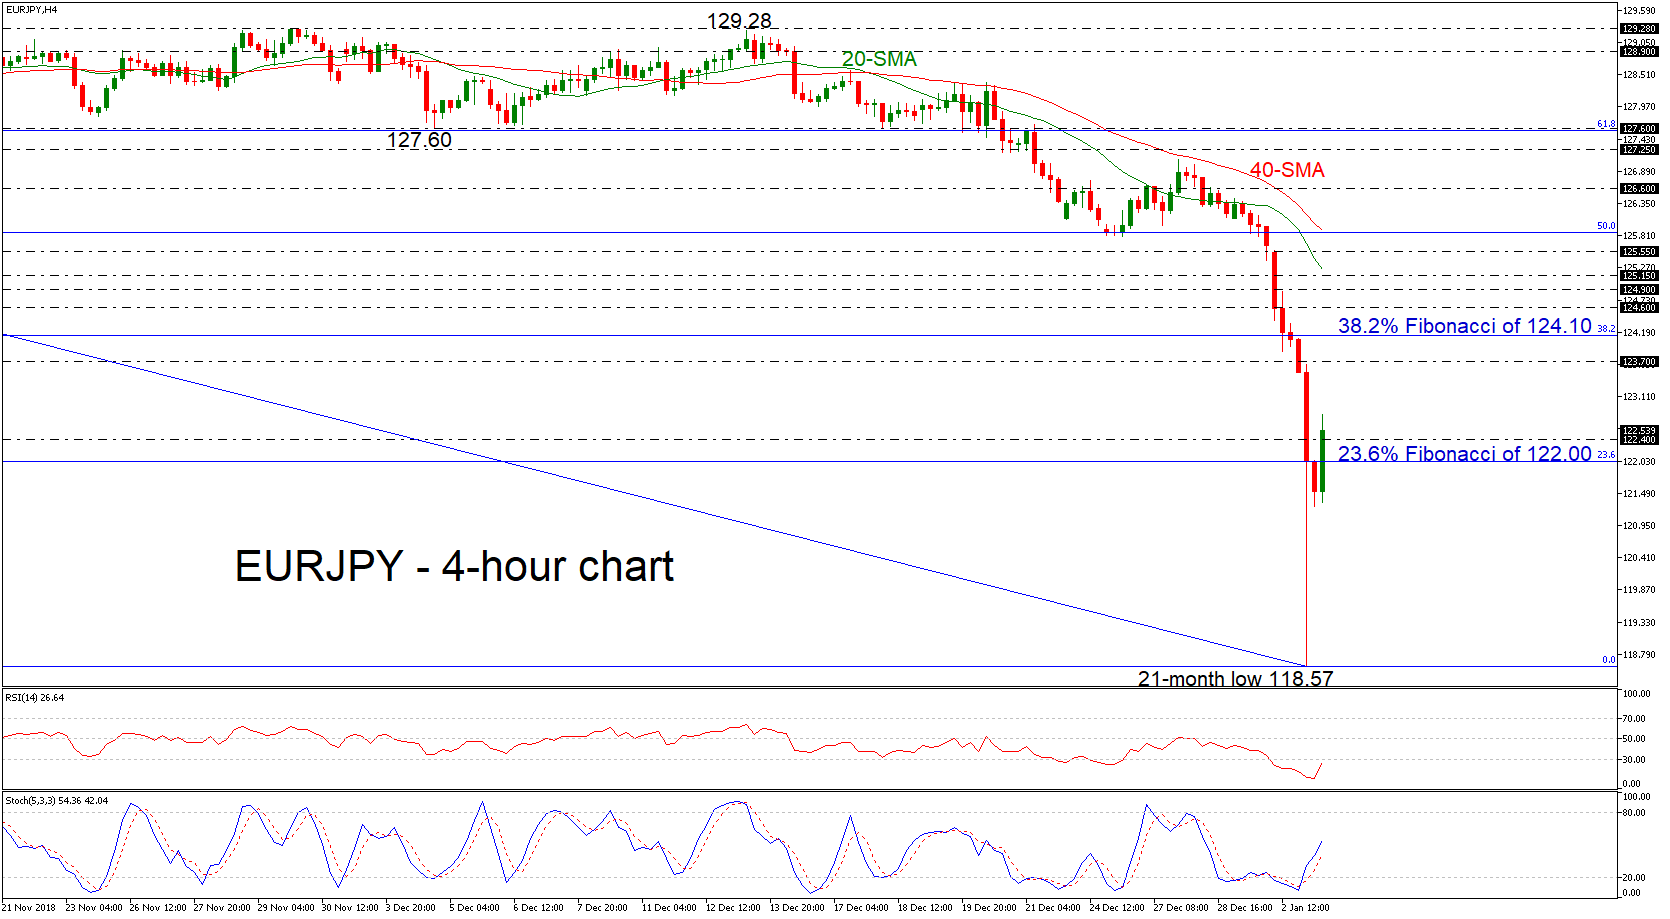
EURJPY tumbled to a new 21-month trough today, hitting the 118.57 support level. The price is moving higher at the moment, jumping above the 23.6% Fibonacci retracement level of the downleg from 133.10 to 118.57, around 122.00. According to the RSI the short-term bias seems to be turning slightly higher as it approaches the 30 level, while the %K line of the stochastic oscillator posted a bullish crossover with the %D line in the negative territory.
If the market continues to push the pair even higher, prices could challenge the 123.70 resistance level, taken from the lows on June 2017. More advances could likely open the way for the 38.2% Fibonacci of 124.10, while traders’ attention could turn on the 124.60 hurdle, identified by the peak on May 29.
On the flipside, if the market manages to turn to the downside again and slips back below the 23.6% Fibonacci, this could send prices until the previous multi-month low of 118.57.
Having a look at the bigger picture, EURJPY seems to be strongly bearish after the sharp downward movement below the 124.60 barrier.
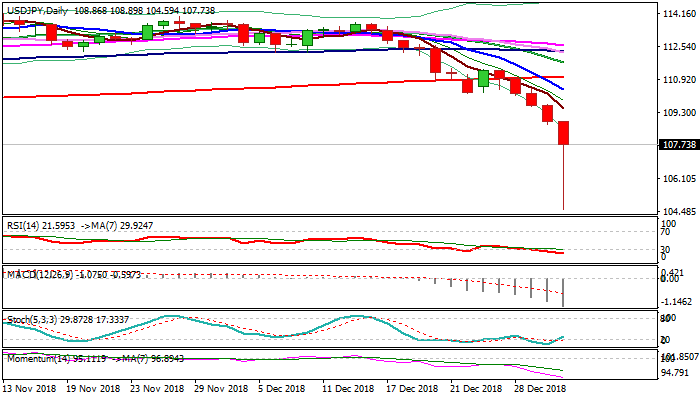
USD/JPY Outlook: Consolidation After ‘Flash Crash’ Likely To Precede Fresh Weakness
The pair spiked to new multi-month low in early Asian trading on Thursday, in 'flash crash' triggered by Apple's unexpected quarterly sales forecast for China, which added to concerns about global growth.
Further strength of safe-haven Japanese yen, in strong risk aversion environment was helped by thin holiday volumes, as Japan is still on New Year holiday.
Overnight's spike accelerated after triggering a number of stops and cracked 2018 low at 104.63, but losses were short-lived and subsequent bounce returned to the levels near 108 mark in early European trading.
Near-term outlook remains negative, as the pair holds in red for the fifth straight day, with bearish daily techs supporting scenario.
Strong rejection at key 104.63 support and daily slow stochastic reversing from oversold territory, suggest that bears may consolidate before fresh attack at 104.63 pivot.
Daily Tenkan-sen in steep fall, which caps for now today's action, marks initial resistance at 108.89 and guards other pivotal barriers at 110.00 (psychological) and 110.42 (falling 10SMA), with selling upticks scenario remaining favored while these barriers cap.
Res: 109.58, 110.00, 110.26, 110.76
Sup: 108.90, 108.41, 108.11, 106.97