Sample Category Title
EUR/JPY Mid-Day Outlook
Daily Pivots: (S1) 125.24; (P) 126.15; (R1) 126.74; More....
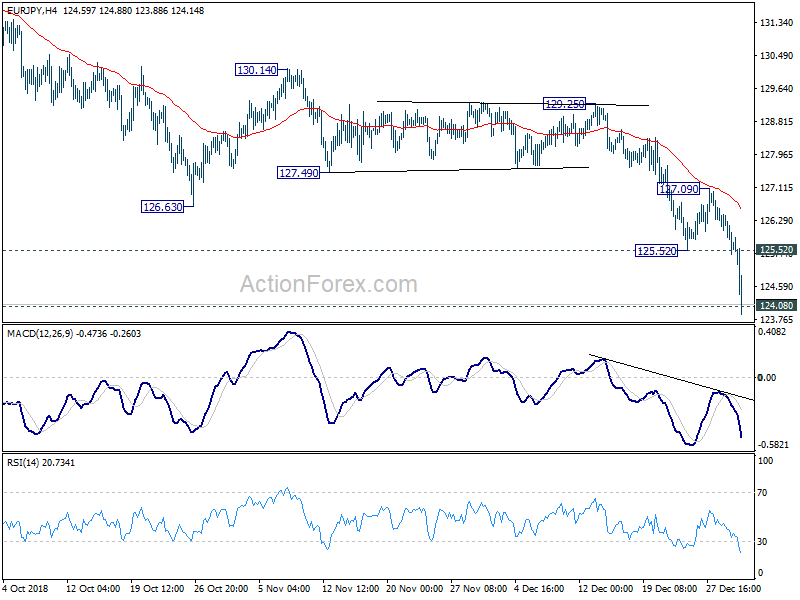
EUR/JPY dives to as low as 123.88 so far today and is now pressing 124.08 key support. Intraday bias remains on the downside. Decisive break of 124.08 will carry larger bearish implication and target 119.90 fibonacci level next. On the upside, break of 125.52 support turned resistance is needed to signal short term bottoming. Otherwise, outlook will remain bearish in case of recovery.
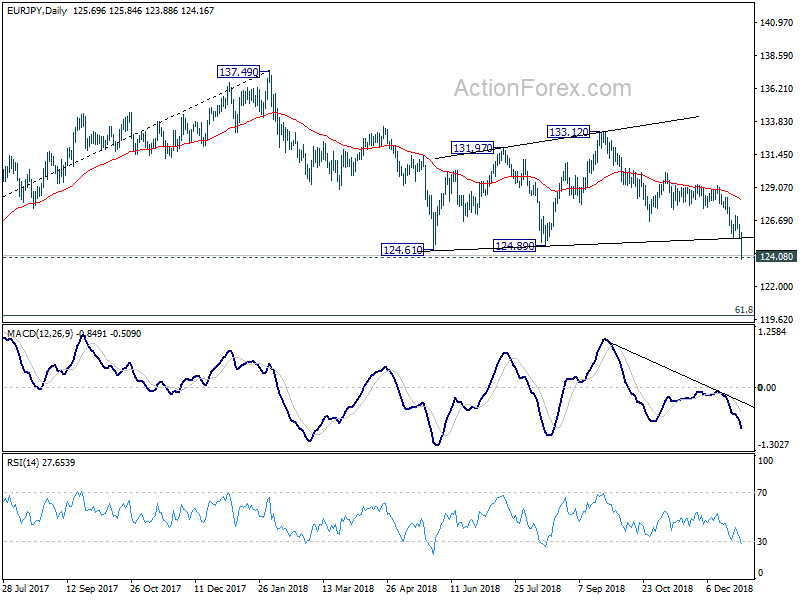
In the bigger picture, with the current decline, focus would be back on 124.08 key resistance turn support. Decisive break of 124.08 will argue that rise from 109.03 (2016 low) has completed and turn outlook bearish. In that case, deeper fall would be seen to 61.8% retracement of 109.03 to 137.49 at 119.90. Meanwhile, strong rebound from 124.08, followed by break of 129.25 resistance will retain medium term bullishness. Rise could 109.03 could still extend through 137.49 resistance in that case.
AUD/USD Mid-Day Outlook
Daily Pivots: (S1) 0.7019; (P) 0.7046; (R1) 0.7079; More...
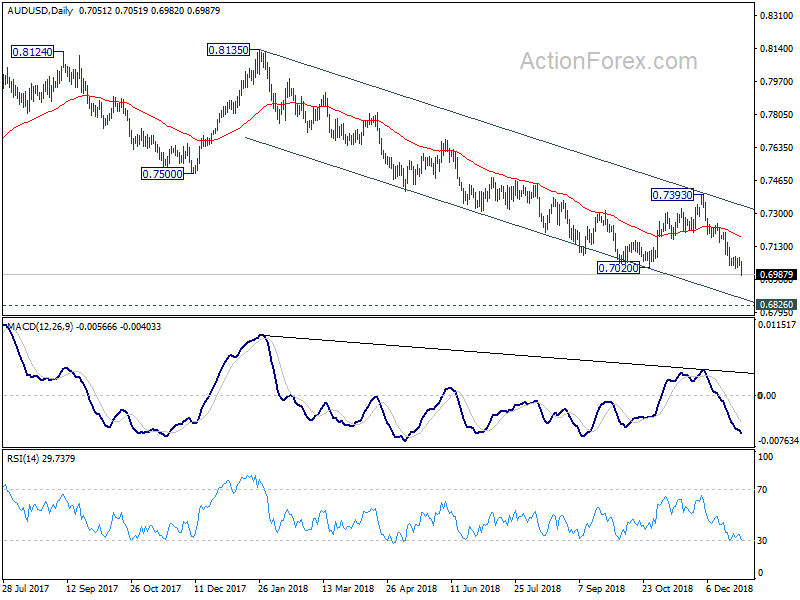
AUD/USD's decline accelerates to as low as 0.6982 so far today. The development should confirm resumption of whole down trend from 0.8135. Intraday bias stays on the downside for 0.6826 key support next. On the upside, break of 0.7071 resistance is needed to indicate short term bottoming. Otherwise, outlook will remain bearish even in case of recovery.
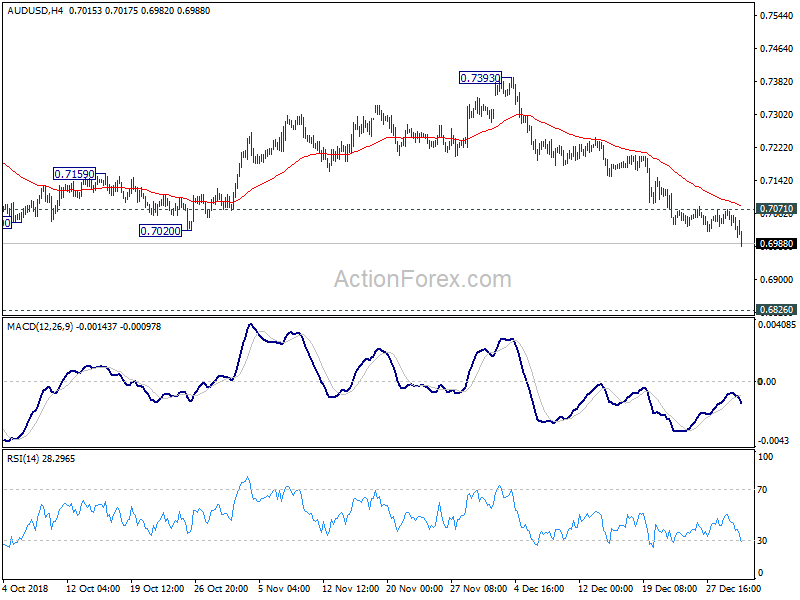
In the bigger picture, price actions from 0.7020 are corrective in nature. In case such corrective pattern extends, upside should be limited by 38.2% retracement of 0.8135 to 0.7020 at 0.7446 to bring down trend resumption. Firm break of 0.7020 will extend medium term decline from 0.8135 to retest 0.6826 (2016 low).
USD/CHF Mid-Day Outlook
Daily Pivots: (S1) 0.9807; (P) 0.9825; (R1) 0.9841; More...
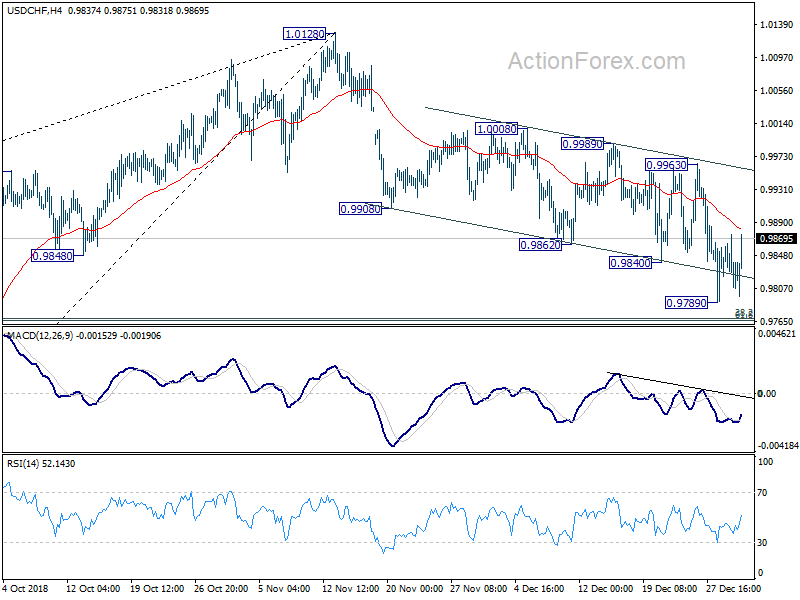
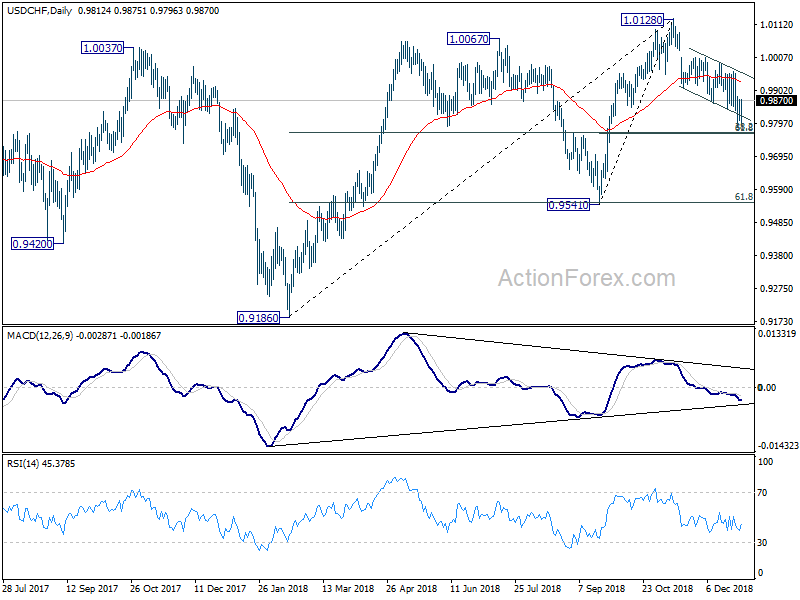
USD/CHF recovery notably today but stays well below 0.9963 resistance. Intraday bias is turned neutral first with another decline in favor. Below 0.9789 will target 0.9765/8 (61.8% retracement of 0.9541 to 1.0128 at 0.9765, 38.2% retracement of 0.9186 to 1.0128 at 0.9768). We'll look for bottoming signal again there. On the upside, break of 0.9963 will suggests that the pull back from 1.0128 has completed and will turn bias back to the upside for this resistance.
In the bigger picture, the deeper than expected fall form 1.0128 argues that medium term rally from 0.9186 might have completed at 1.0128 already, on bearish divergence condition in daily and weekly MACD. Break of 0.9541 key support will confirm this bearish case. More importantly, the corrective three wave structure will in turn argue that long term corrective pattern from 1.0342 (2016 high) is extending. In that case, 0.9186 will be the next target.
USD/JPY Mid-Day Outlook
Daily Pivots: (S1) 109.53; (P) 109.73; (R1) 109.93; More..
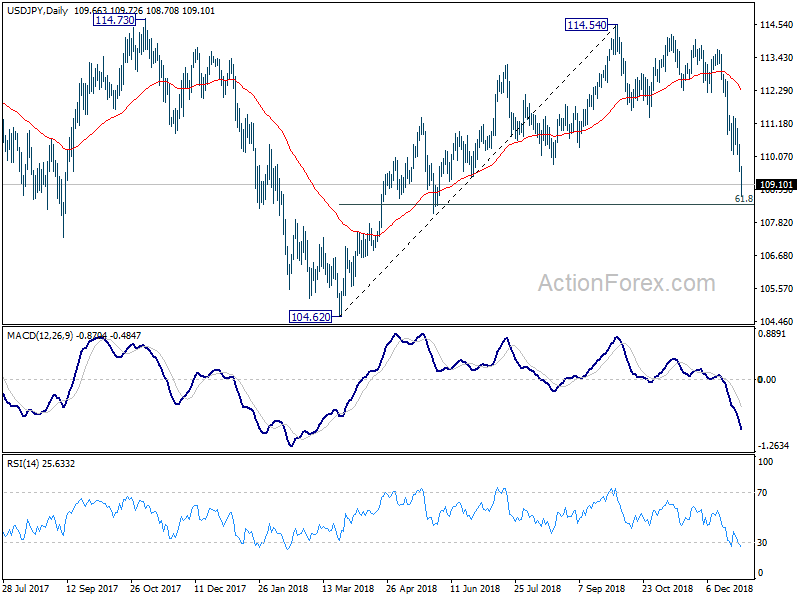
USD/JPY drops to as low as 108.70 so far today and intraday bias remains on the downside. Current fall from 114.54 should target 61.8% retracement of 104.62 to 114.54 at 118.40 first. Sustained break there will pave the way to retest 104.62 low next. On the upside, above 109.20 minor resistance will turn intraday bias neutral to bring consolidation. But upside of recovery should be limited by 111.37 support turned resistance to bring fall resumption.
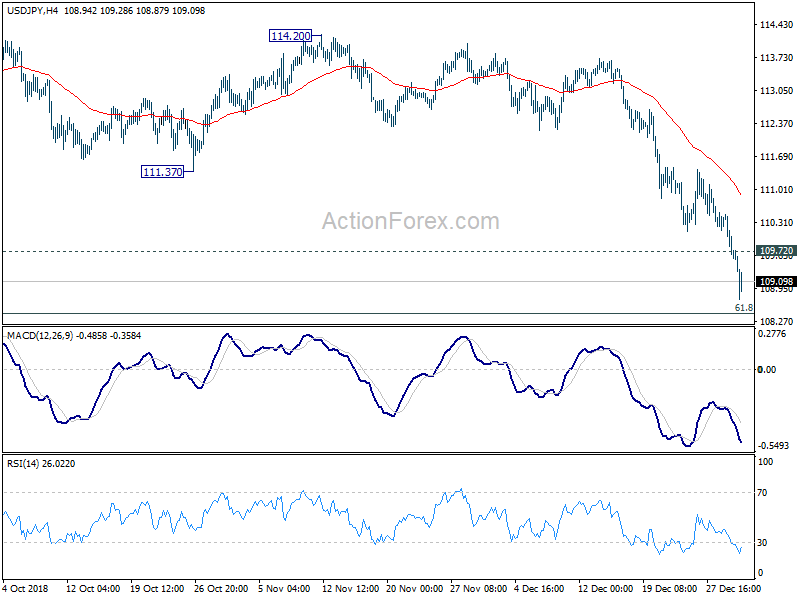
In the bigger picture, price actions from 125.85 (2015 high) are seen as a long term corrective pattern, no change in this view. Apparently, such corrective pattern is not completed yet. Fall from 114.54 is seen as another medium term down leg, 98.97/104.62 support zone. For now, we'd expect strong support from there to contain downside to bring rebound.
Yen Stays Strongest on Global Risk Aversion and Diving Yields
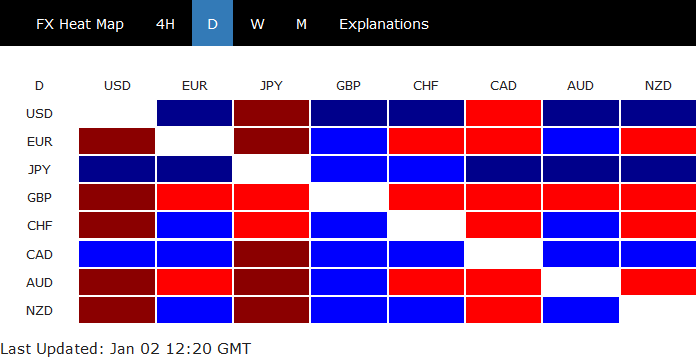
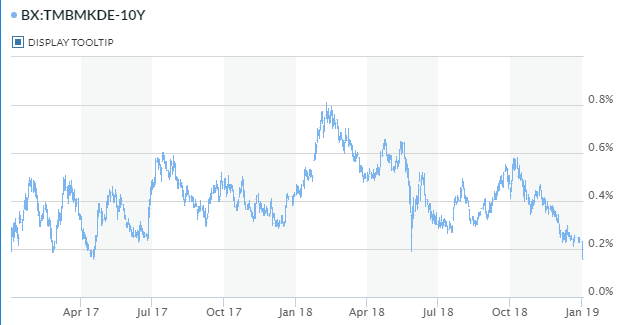
Yen remains the strongest one for today as the risk aversion dominates the global markets. Major European indices do pare back much of earlier losses. But it's unsure whether the recovery could sustain. Persistent decline in German 10 year bund yield, which hit the lowest since April 2017, is something for investor to worry about. Also, DOW futures is now down -300 pts, pointing to sharply lower open. More importantly, focus will also be on how much US yield curve would flatten at the long end, and invert from 1-year to 5-year.
Staying in the currency markets, Canadian Dollar is the second strongest, thanks to steadiness in WTI crude oil which stays above 45. Dollar is the third strongest one. Meanwhile, Sterling is reversing Monday's surprised gain and is trading as the weakest, followed by Australian Dollar and then Euro.
Technically, GBP/JPY's strong break of 139.29 key support now confirms medium-to-long term bearish reversal. EUR/JPY will be looking at equivalent key support at 124.08. EUR/USD breached 1.1485 resistance briefly earlier today and quickly reversed. Focus will now be on 1.1342 minor support and break will be the first sign of larger decline resumption. With today's selloff, GBP/USD is eyeing 1.2615 minor support and EUR/GBP is eying 0.9086 resistance.
In Europe, at the time of writing, FTSE s down -0.60%, DAX is down -0.25%, CAC is down -1.34%. German 10 year yield is down -0.0882 at 0.161, lowest since April 2017. Earlier in Asia, Hong Kong HSI dropped -2.77%. China Shanghai SSE dropped -1.15%. Singapore Strait Times dropped -0.97%. Japan was on holiday.
UK PMI manufacturing rose to 54.2, stocks at near record but positive impact likely short-lived
UK PMI manufacturing rose to 54.2 in December, up from 53.1 and beat expectation of 52.6. It's also the highest level in six months. Markit also noted that "new order and new export order inflows strengthen", and "stocks of purchases and finished goods rise sharply".
Rob Dobson, Director at IHS Markit, said in the release that the rise followed "short-term boosts to inventory holdings and inflows of new business as companies stepped up their preparations for a potentially disruptive Brexit." He added that stocks of purchases and finished goods both rose at near survey-record rates, but "any positive impact on the PMI is likely to be short-lived". Also, manufacturing will be entering 2019 "on a less than ideal footing with Brexit uncertainty having intensified considerably."
Eurozone PMI manufacturing finalized at 51.4, manufacturing boom faded away to near stagnation
Eurozone PMI manufacturing was finalized at 51.4 in December, unrevised. It's down from November's 51.8 and hit the lowest since February 2016. Markit also noted that "fall in new work signalled for third month running" and "confidence about the future hits fresh six-year low". Among the countries, Germany hit 33-month low at 51.5. Spain hit 28-month low at 51.5. France hit 27-month low at 49.7, in contraction. Italy, despite recovering to 2-month high at 49.2, remained in contraction.
Chris Williamson, Chief Business Economist at IHS Markit noted in the release that "a disappointing December rounds off a year in which a manufacturing boom faded away to near stagnation." And, "the last three months of 2018 saw manufacturers report the worst quarterly performance in terms of production since the second quarter of 2013." Also, "the undercurrent of weak demand and growing risk aversion evident across the surveys suggests that any rebound could prove modest at best, with Brexit representing a particularly worrying unknown for the outlook."
China Caixin PMI manufacturing in first contraction since 2017, greater downward pressure ahead
The Caixin China PMI manufacturing dropped to 49.7 in December, down from 50.2 and missed expectation of 50.3. That's also the first contractionary reading since May 2017. Zhengsheng Zhong, Director of Macroeconomic Analysis at CEBM Group, noted in the release that "external demand remained subdued due to the trade frictions between China and the U.S., while domestic demand weakened more notably". And, "it is looking increasingly likely that the Chinese economy may come under greater downward pressure."
In our view, the latest PMI data added further evidence that China's economy is in bad shape. Trade war with the US has not only weakened trade, but also domestic demand. The job market has also deteriorated, suggesting further stimulus is needed to be in place as soon as possible. We expect the central bank to accelerate monetary easing. While further reduction in required reserve ratio is widely expected, we believe PBOC could also reduce the policy rate to support the economy. The government's fiscal policy would be increasingly accommodative, in the form of increasing spending on infrastructure and cutting taxes. More in China's PMIs Confirmed Manufacturing Sector in Contraction.
USD/JPY Mid-Day Outlook
Daily Pivots: (S1) 109.53; (P) 109.73; (R1) 109.93; More..
USD/JPY drops to as low as 108.70 so far today and intraday bias remains on the downside. Current fall from 114.54 should target 61.8% retracement of 104.62 to 114.54 at 118.40 first. Sustained break there will pave the way to retest 114.54 low next. On the upside, above 109.20 minor resistance will turn intraday bias neutral to bring consolidation. But upside of recovery should be limited by 111.37 support turned resistance to bring fall resumption.
In the bigger picture, price actions from 125.85 (2015 high) are seen as a long term corrective pattern, no change in this view. Apparently, such corrective pattern is not completed yet. Fall from 114.54 is seen as another medium term down leg, 98.97/104.62 support zone. For now, we'd expect strong support from there to contain downside to bring rebound.
Economic Indicators Update
| GMT | Ccy | Events | Actual | Forecast | Previous | Revised |
|---|---|---|---|---|---|---|
| 1:45 | CNY | Caixin PMI Manufacturing Dec | 49.7 | 50.3 | 50.2 | |
| 8:45 | EUR | Italy Manufacturing PMI Dec | 49.2 | 48.4 | 48.6 | |
| 8:50 | EUR | France Manufacturing PMI Dec F | 49.7 | 49.7 | 49.7 | |
| 8:55 | EUR | Germany Manufacturing PMI Dec F | 51.5 | 51.5 | 51.5 | |
| 9:00 | EUR | Eurozone Manufacturing PMI Dec F | 51.4 | 51.4 | 51.4 | |
| 9:30 | GBP | PMI Manufacturing Dec | 54.2 | 52.6 | 53.1 | 53.6 |
| 14:30 | CAD | Manufacturing PMI Dec | 54.9 | |||
| 14:45 | USD | Manufacturing PMI Dec F | 53.9 | 53.9 |
Into US session: Yen stays strongest even European stocks pared losses
Entering into US session, risk aversion seems to have eased a little bit in European markets, with major indices pared back much of earlier losses. But Yen remains overwhelmingly the strongest one, thanks to falling European yields. Canadian Dollar follows as the second strongest as WTI crude oil manages to stay in tight range above 45, for now. Dollar is the third strongest.
Meanwhile, Sterling is the worst performing one despite stronger than expected PMI manufacturing. The Pound is reversing the unexpected strong gains on Monday. Australian Dollar follows as second weakest. Euro and Swiss franc trail.
In Europe:
- DAX dropped to as low as 10386.97 but it's now at 10551, down only -0.07%
- CAC hit as low as 4606.20 but it's now at 4665, down -1.37%.
- FTSE reached as low as 6599.48 but it's now back at 6694, down -0.50%
- German 10 year bund yield, however, is still in decline and is down -0.081 at 0.162, lowest since April 2017
Earlier in Asia:
- Hong Kong HSI dropped -2.77% to 25130.35
- China Shanghai SSE dropped -1.15% to 2465.29, very close to 2449.19 low made in October.
- Singapore Strait Times dropped -0.97% to 3038.89
- Japan was on holiday today
DAX Edges Lower As European Stock Markets Slip
European markets have started 2019 with losses, and the DAX is down slightly in the Wednesday session. Currently, the index is at 10,547, down 0.11% since the year-end close on Monday. On the release front, Germany and the Eurozone posted manufacturing PMIs, with readings of 51.5 and 51.4, respectively. Both readings matched the forecast.
The ongoing global trade war has dampened economic growth and hurt investor confidence. With investors reading in their morning newspapers that equity markets suffered their worst year since 2008, risk apprehension remains high as we begin the New Year. However, one positive development in December was the announcement that U.S. and Chinese delegations are set to meet next week and tackle the trade issues that have sparked a serious rift between the world’s two largest economies. The talks are critical, as the U.S. has said that it will impose heavy tariffs on Chinese products on March 1, but agreed to suspend the move while talks are ongoing. Earlier in the week, President Trump said that ‘big progress’ had been made with China, but with the sides yet to meet face-to-face, the markets are not putting much stock in Trump’s remarks.
Global stock markets have taken investors on a roller coaster ride in recent weeks. The sharp volatility has shaken investors, who have flocked to safe-assets such as gold and the Japanese yen at the expense of equities. In the eurozone, policymakers begin the year with serious headaches, as the markets brace for soft numbers for the fourth quarter. As well, the Italian budget crisis has not been resolved and Brexit will be back in the headlines, as the British parliament will vote on the withdrawal agreement in mid-January. With plenty of hot-spots both domestically and abroad, traders can expect volatility from European stock markets in the coming weeks.
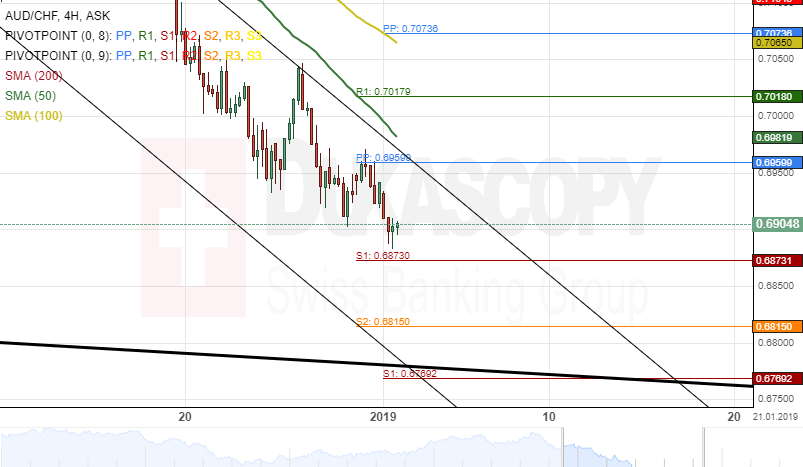
AUD/CHF 4H Chart: Narrow Channel Likely To Prevail
The dominant pattern that has guided the AUD/CHF exchange rate for the last one year is a descending channel pattern. As apparent on the chart, the pair reversed from its upper boundary on December 3 and has since traded in a narrow channel down.
The Aussie is currently stranded between two important support and resistance areas. The pressure from both sides could force the pair to consolidate in a narrow range between their bounds.
If looking into the shorter term, a test of the bottom border of the narrow down channel at 0.6815.
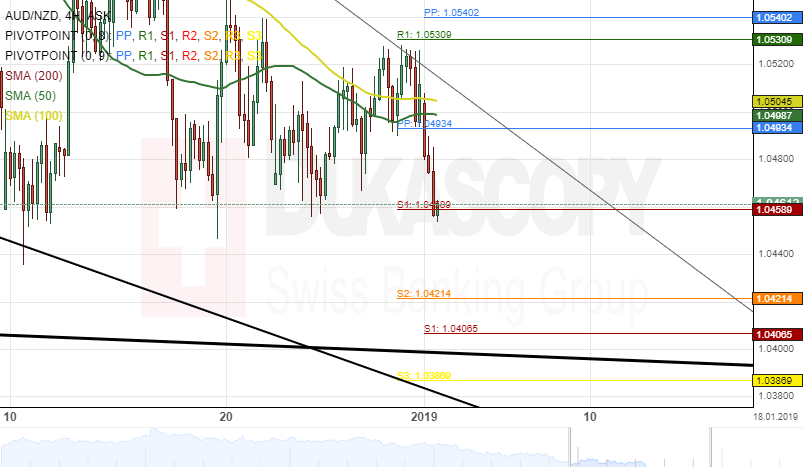
AUD/NZD 4H Chart: Pair Likely To Decline
The Australian Dollar has been moving in a five-month descending channel pattern against the New Zealand Dollar. The currency pair reversed from the upper boundary of a dominant descending channel at 1.1150 on August 7 and followed by downside wave.
As for the short-term future, it is likely that the currency exchange rate will aim at the lower boundary of the dominant descending channel pattern at 1.0386 during the following trading session.
However, a support level formed by a swing low at 1.0440 could hinder the AUD/NZD exchange rate from falling.
AUDUSD Tests 0.70 Key Support For First Time In Three Years
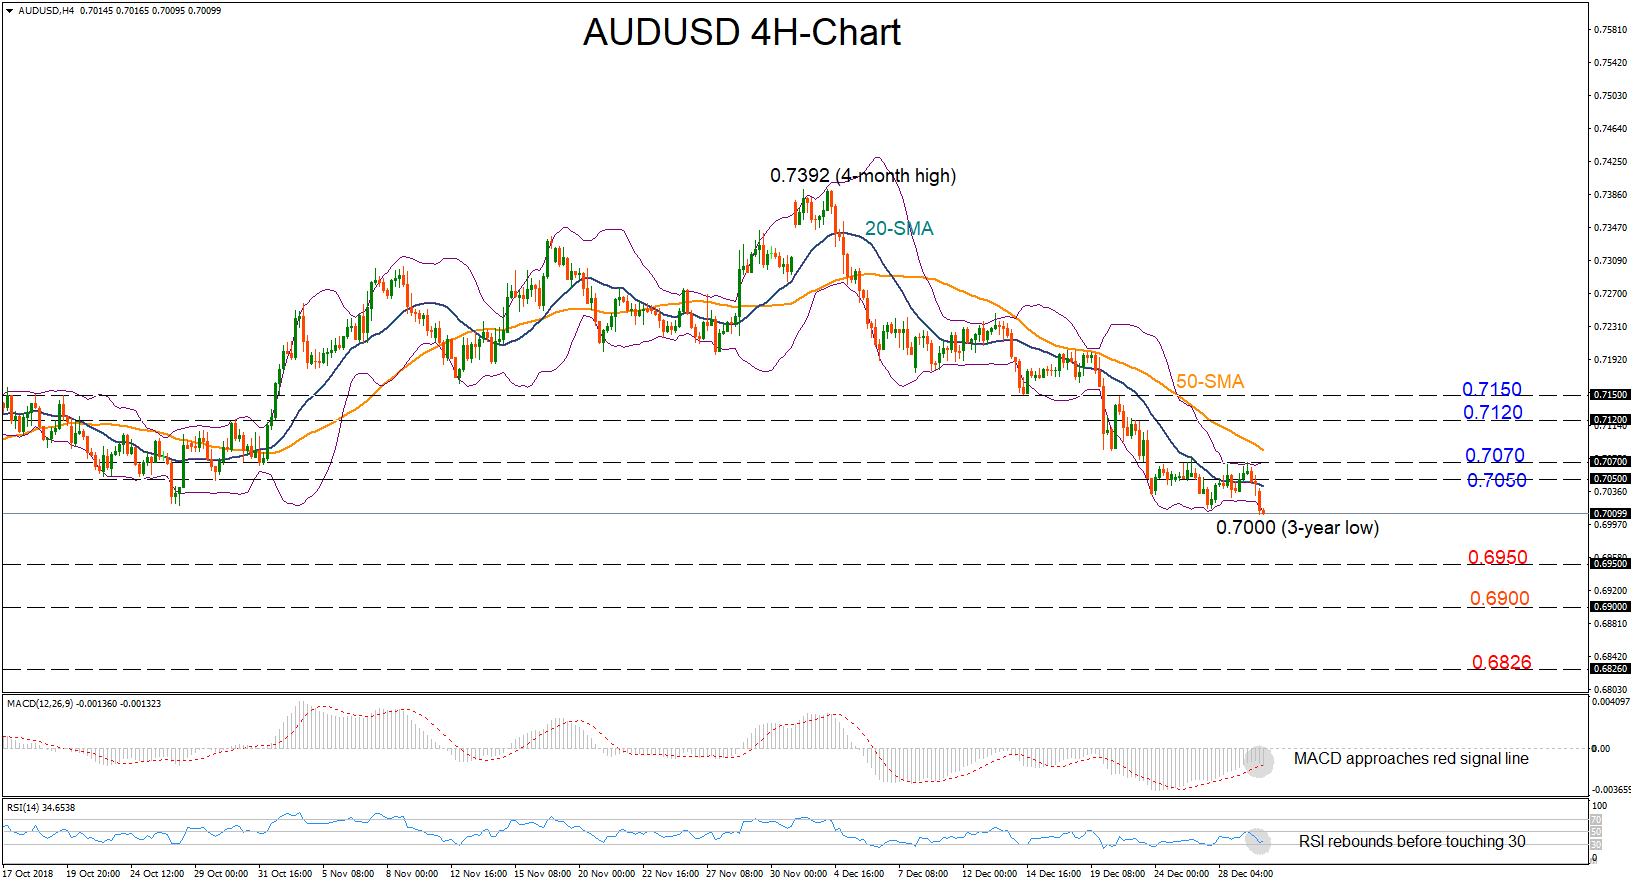
AUDUSD broke key support around 0.7020 and dropped to a fresh three-year low of 0.70 in the first trading day of 2019, signaling that the bearish trend is not about to end any time soon.
Still, with the price flirting with the lower Bollinger band in the four-hour chart and the RSI trying to gain ground above its 30 oversold limit, some sort of recovery is likely to happen in the short term. However, if the MACD extends negative momentum below its red signal line, any gains could appear temporary.
In case the price indeed heads up and back above 0.7020, immediate resistance is expected to come between 0.7050 and the upper Bollinger line currently seen at 0.7070. Overcoming the latter and more importantly crawling above the 50-period (simple) moving average (MA) would boost market confidence and raise buying bids somewhere between 0.7120 and 0.7150.
Alternatively, if sellers manage to clear the 0.70 floor, turning the outlook even more bearish, support could come first around 0.6950 before attention shifts to the 0.69 psychological level. Even lower, all eyes will be on 0.6826, the lowest mark reached since March 2009.