Sample Category Title
Crude Oil: Oil Trading Lower This Morning
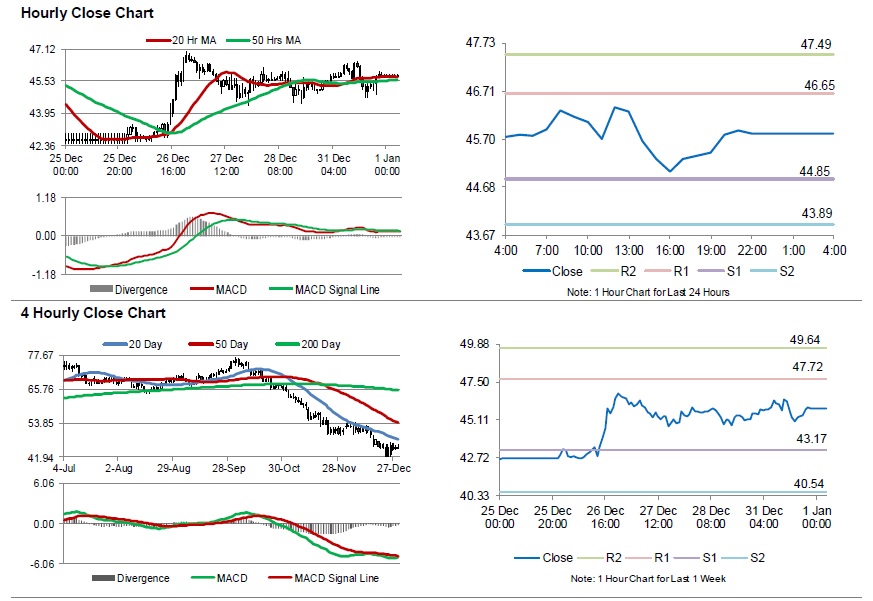
For the 24 hours to 23:00 GMT, Crude Oil declined 0.09% against the USD and closed at USD45.77 per barrel, amid persistent concerns over global supply glut.
In the Asian session, at GMT0400, the pair is trading at 45.13, with oil trading 1.40% lower against the USD from yesterday’s close.
The pair is expected to find support at 44.40, and a fall through could take it to the next support level of 43.66. The pair is expected to find its first resistance at 46.20, and a rise through could take it to the next resistance level of 47.26.
Crude oil is showing convergence with its 20 Hr moving average and trading above its 50 Hr moving average.
GBP/JPY Daily Outlook
Daily Pivots: (S1) 138.58; (P) 139.33; (R1) 140.59; More...
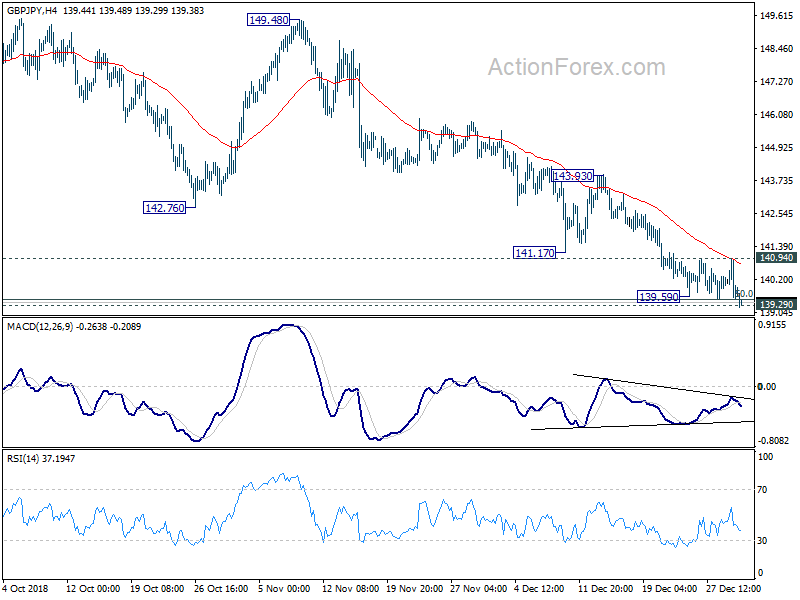
GBP/JPY's decline resumed by taking out 139.59 and intraday bias is back on the downside. Focus is now on 139.29/47 key support zone. Decisive break there will carry larger bearish implication. 135.43 long term fibonacci level will be next target. On the upside, though, break of 140.94 resistance will be the first sign on near term reversal. Intraday bias will be turned back to the upside for 143.93 resistance first.
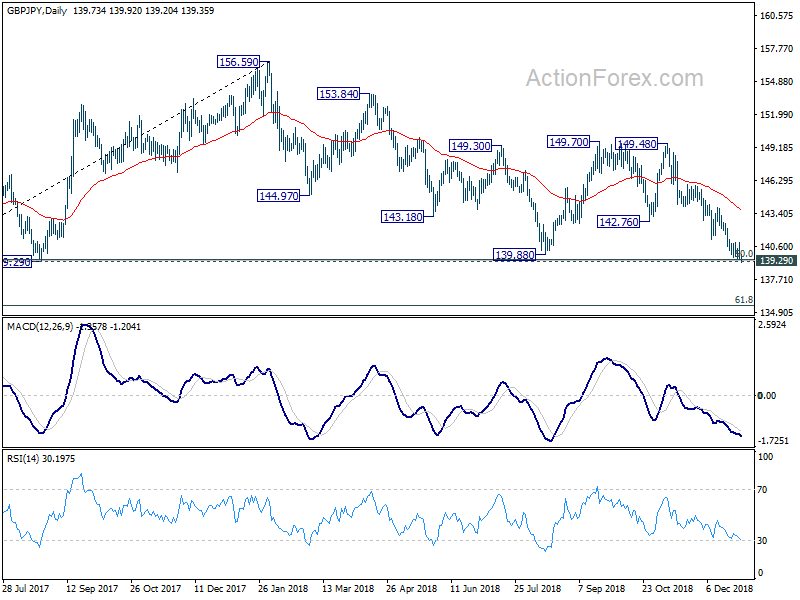
In the bigger picture, focus is now on 139.29 cluster support (50% retracement of 122.36 to 156.59 at 139.47). Decisive break will confirm completion of up trend from 122.36 (2016 low). GBP/JPY should target 61.8% retracement at 135.43. Sustained break will pave the way back to 122.36 low. Nevertheless, strong rebound from current level, followed by 142.76 support turned resistance will retain medium term bullishness.
EUR/JPY Daily Outlook
Daily Pivots: (S1) 125.24; (P) 126.15; (R1) 126.74; More....
EUR/JPY's fall resumed by taking out 125.52 and reaches as low as 125.16 so far. Intraday bias is back on the downside. Current decline from 133.12 should target 124.08/89 support zone next. On the upside, break of 127.09 resistance is needed to indicate short term bottoming. Otherwise, near term outlook will remain bearish even in case of recovery.
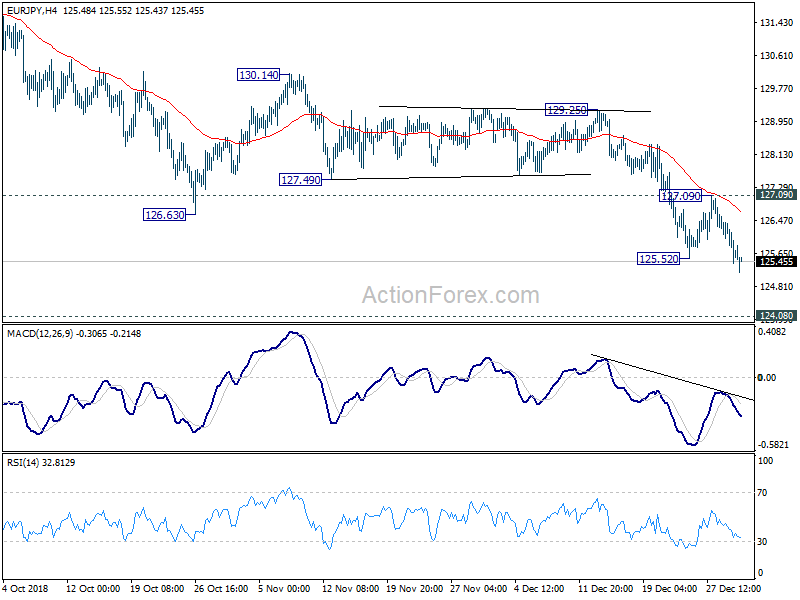
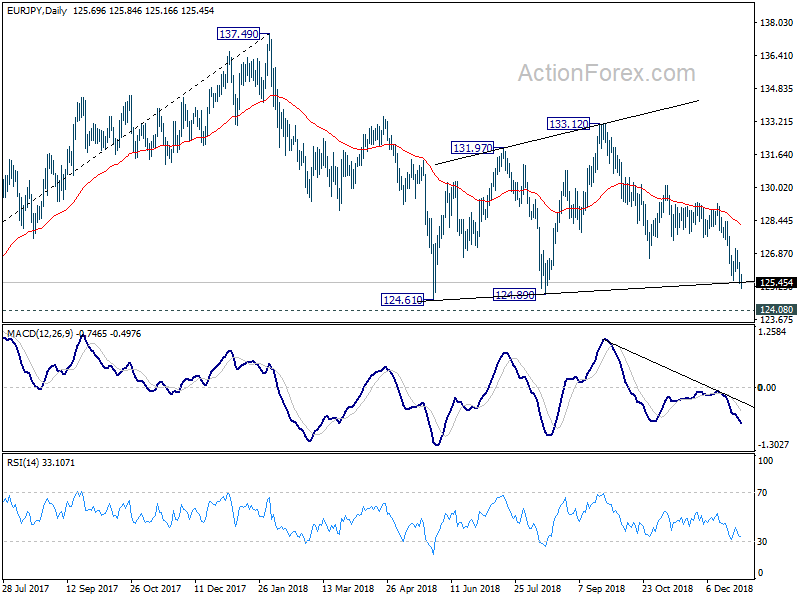
In the bigger picture, with the current decline, focus would be back on 124.08 key resistance turn supported holds. Decisive break of 124.08 will argue that such rise from 109.03 (2016 low) has completed and turn outlook bearish. In that case, deeper fall would be seen to 61.8% retracement of 109.03 to 137.49 at 119.90. Meanwhile, strong rebound from 124.08, followed by break of 129.25 resistance will retain medium term bullishness. Rise could 109.03 could still extend through 137.49 resistance in that case.
Aussie Trades At Lowest Level Since 2016
General Trend:
- US equity futures reverse gains, Oil futures decline: China Caixin PMI Manufacturing had first contraction since 2017
- Chinese equities weighed down by banking and materials sectors
- (CN) Shanghai Banking index -1.6% on session: Former ICBC Chairman Jiangqing said to have warned about possible systematic risk
- China and Hong Kong Property names decline amid People’s Daily commentary
- Financials and energy shares underperform in Australia
- Shares of Kia and Hyundai Motors decline, issued 2019 sales targets
- Chinese liquor maker Kweichow Moutai outperforms, issued 2018 guidance
- Asian currencies start 2019 generally weaker vs US dollar
- Singapore Q4 GDP missed estimates, manufacturing sector contracts
- As of Tuesday, the US partial government shutdown entered its 11th day
- Bank of Korea (BOK) Gov suggested lower oil prices could weigh on inflation
- China PBOC drains liquidity to start the new year
- Japan financial markets to reopen on Jan 4th (Friday) after new year's break
Headlines/Economic Data
Australia/New Zealand
- ASX 200 opened -0.2%
- (AU) Australia Dec CoreLogic House Price M/M: -1.3% v -0.9% prior (15th m/m straight decline); Y/Y: -4.8% v -4.1% prior
- (AU) Australia 10-year bond yield 2.297%, down 2.5bps (lowest since Nov 2016)
China/Hong Kong
Shanghai opened +0.2%, Hang Seng -0.1%
- (CN) Hearing Morgan Stanley started China property sector at 'attractive'
- (HK) Hong Kong Macau Dec Gambling Rev:26.5B v 25.0B prior, +16.6% y/y v 10%e
- (CN) China President Xi: Domestic economy stayed within a reasonable range; To implement tax cut in 2019 - New Year's Eve address
- (CN) China said to conduct checks on certain firms derivative trading, follows recently disclosed loss by Sinopec's Unipec unit
- (CN) China People's Daily: Domestic regional economies need to reduce reliance on the property market for growth, focus on sustainable long-term development
- (CN) China PBoC sets yuan reference rate: 6.8482 v 6.8632 prior
- (CN) China PBoC Open Market Operation (OMO): Injects CNY40B in 7 and 14-day reverse repos v CNY230B injected in 7 and 14-day reverse repos prior; Net: CNY70B drain v CNY230B injection prior
Japan
- Nikkei 225 closed
Korea
- Kospi opened +0.3%
- (KR) Bank of Korea Gov Lee: Inflation forecast could be lower than earlier projection, did not expect oil prices to decline this much; External conditions are 'not good'
- (KR) North Korea leader Kim: committed to achieving "complete denuclearization" as agreed during first summit with Trump in June, we have stopped making nuclear weapons and that he is ready to meet Trump again at any time - Yonhap citing new Years speech
- (KR) South Korea President Moon: Changing frame of economic policies takes time; government will support companies to make active investment
- (KR) South Korea Dec Manufacturing PMI: 49.8 v 48.6 prior
- (KR) South Korea sells KRW1.6T v KRW1.6T indicated in 3-year bonds, avg yield 1.815%
Other
- (SG) SINGAPORE Q4 ADVANCE GDP Q/Q: 1.6% V 3.6%E; Y/Y: 2.2% V 2.5%E
- (CN) China President Xi: Reiterates nobody can change the fact that Taiwan is part of China, will leave 'no space' for Taiwan independence activities; willing to talk and communicate with parties in Taiwan
- (ID) Indonesia Dec CPI M/M: 0.6% v 0.5%e; Y/Y: 3.1% v 3.0%e
- (TH) Thailand Dec CPI M/M: -0.7% v -0.1%e; Y/Y: 0.4% v 1.0%e
North America
- (US) US President Trump formally invited Democrats to meeting at White House on Wed, unclear if Democrat leaders will attend - US press
- (US) Sen Maj Leader McConnell (R-KY): the Senate won't send Pres Trump a budget bill that he won't sign; Senate won't consider House Democratic bill to reopen govt
- (US) US President Trump: Gas prices are low and expected to decline in 2019; Looks forward to meeting with North Korea leader Kim
Europe
- (UK) Certain business leaders said to be concerned about deteriorating economic conditions in the UK - FT
Levels as of 01:00ET
- Nikkei 225, closed, ASX 200 -1.6%, Hang Seng -3%; Shanghai Composite -1.3%; Kospi -1.7%
- Equity Futures: S&P500 -0.8%; Nasdaq100 -0.9%, Dax -0.9%; FTSE100 -0.6%
- EUR 1.1472-1.1442 ; JPY 109.76-109.33 ; AUD 0.7058-0.7001 ;NZD 0.6726-0.6682
- Feb Gold +0.4% at $1,286/oz; Feb Crude Oil -1.6% at $45.05/brl; Feb Copper +0.2% at $2.648/lb
EUR/GBP Daily Outlook
Daily Pivots: (S1) 0.8988; (P) 0.9024; (R1) 0.9078; More...
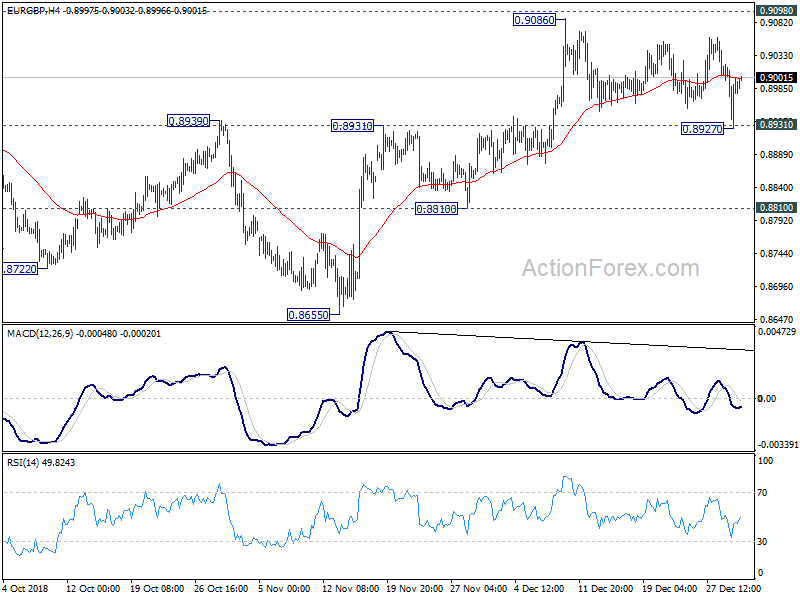
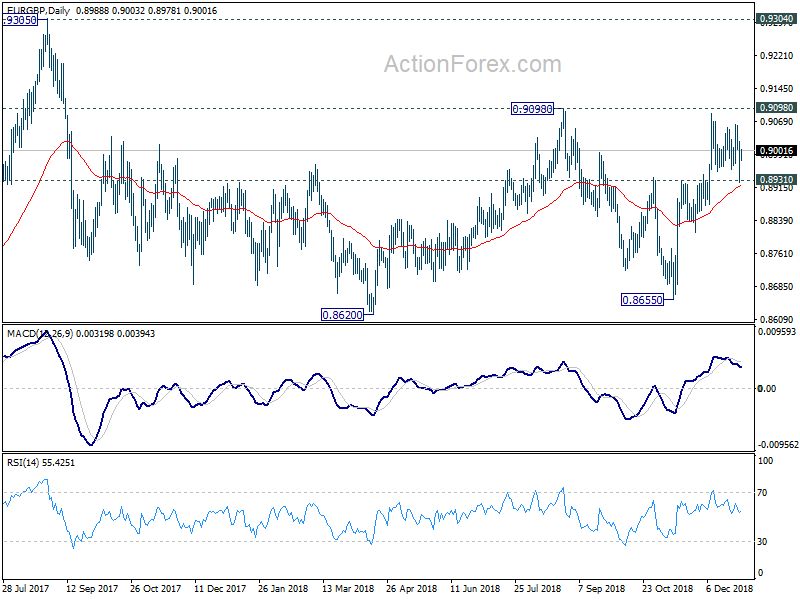
Despite dipping to 0.8927, EUR/GBP drew quick support from 0.8931 and recovered. Intraday bias stays neutral first and further rise is mildly n favor. On the upside firm break of 0.9098 resistance will extend the whole rise from 0.8655 to 0.9304 key resistance next. However, on the downside, firm break of 0.8931 will indicate near term reversal and target 0.8810 support and below.
In the bigger picture, EUR/GBP is seen as staying in long term range pattern started at 0.9304 (2016 high). It should be in medium term rising leg for 0.9304. Meanwhile, in case of another fall, down side should be contained by 0.8620/55 support zone to bring rebound.
EUR/AUD Daily Outlook
Daily Pivots: (S1) 1.6123; (P) 1.6291; (R1) 1.6423; More....
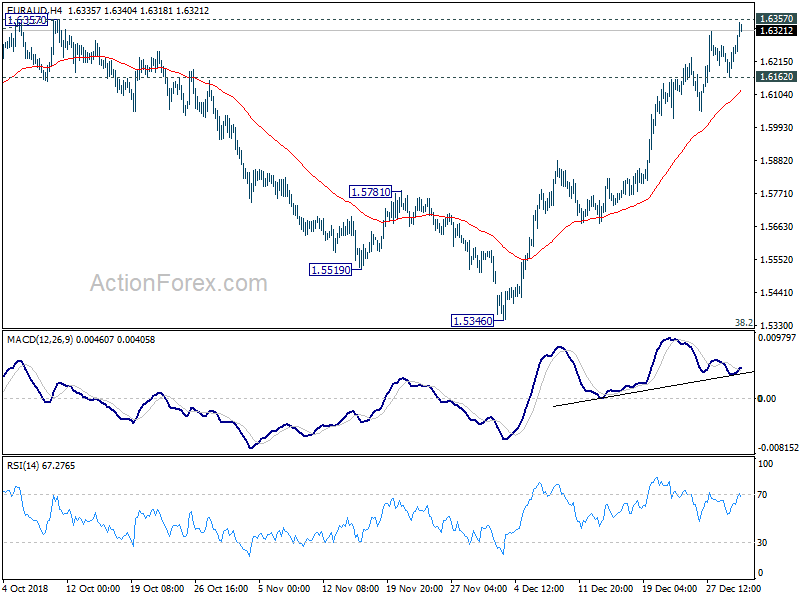
EUR/AUD's rally extends after brief retreat and reaches as high 1.6348 so far. Intraday bias stays on the upside for 1.6357 high. At this point, we'd be cautious on topping around there to bring pull back. On the downside, break of 1.6162 will turn bias to the downside for pull back. Meanwhile, sustained break of 1.6357 will confirm up trend resistance for next key resistance at 1.6587.
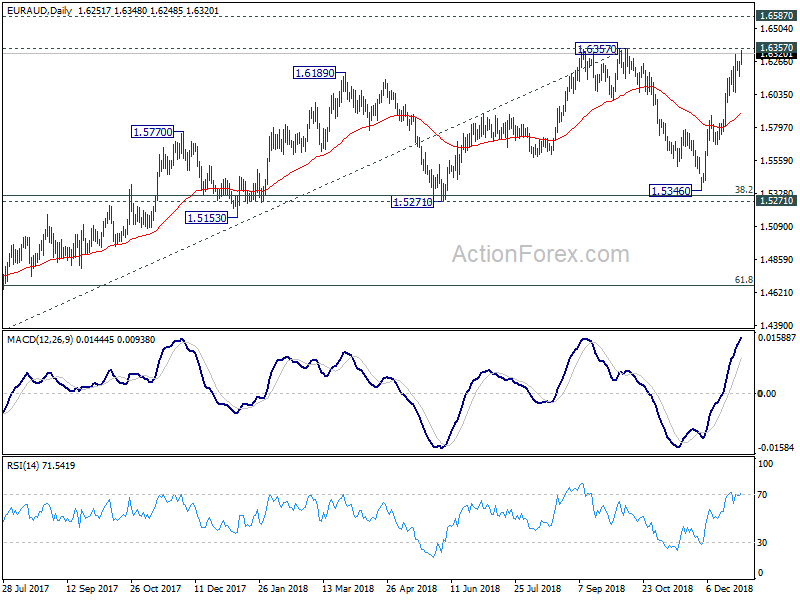
In the bigger picture, no change in the view that 1.6357 is a medium term top. But the strong rebound ahead of 1.5271 cluster support (38.2% retracement of 1.3624 to 1.6357 at 1.5313) suggests price actions from 1.6357 are developing into sideway consolidation, rather than a deep correction. The range of 1.5271/6357 is likely set for the consolidation. And we don't expect a break of the range any time soon. But decisive break of 1.6357 will resume the larger up trend from 1.3624 (2017 low) to 1.6587 (2015 high).
EUR/CHF Daily Outlook
Daily Pivots: (S1) 1.0648; (P) 1.1853; (R1) 1.2461; More...
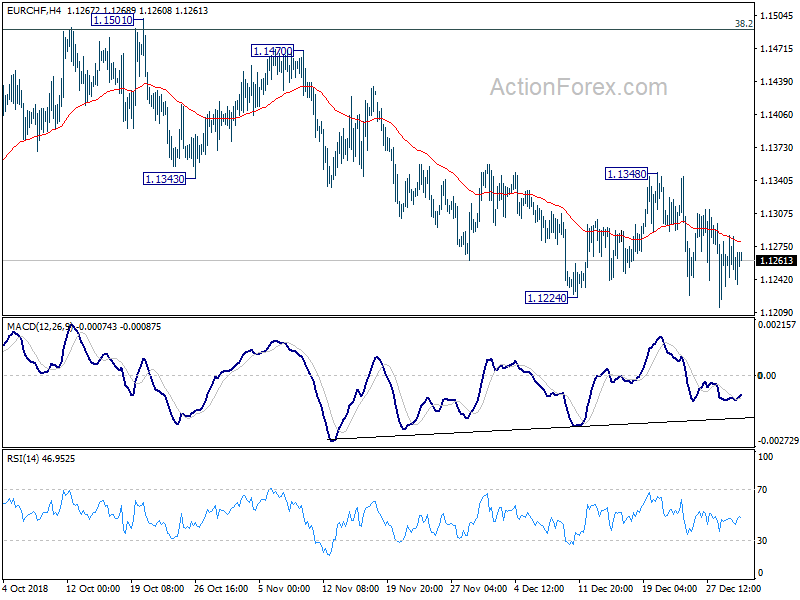
EUR/CHF breached 1.1224 but quickly recovered. But with 1.1348 resistance intact, further decline is still expected in the cross. The decline from 1.1501 will target to 1.1173 low. On the upside, though, break of 1.1348 resistance should confirm near term reversal and target 1.1501 resistance.
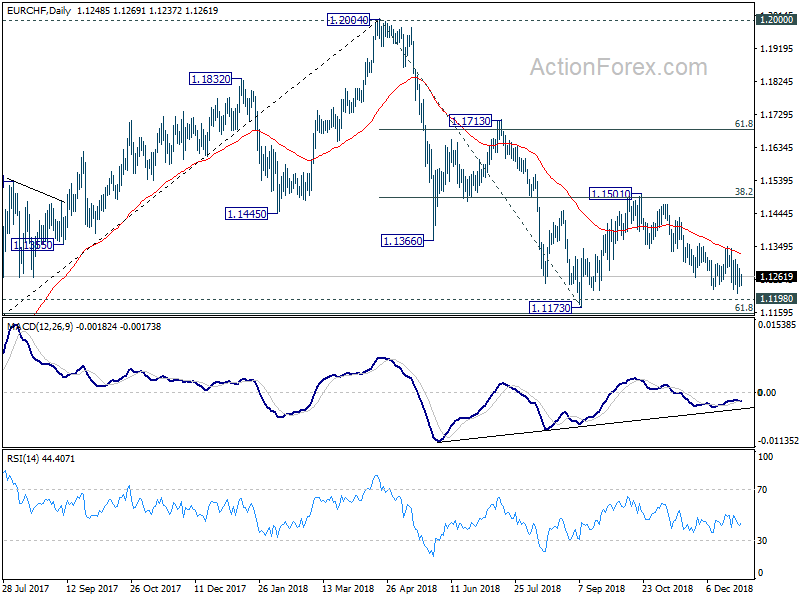
In the bigger picture, price actions from 1.2004 medium term top is seen as a correction only. Downside should be contained by support zone of 1.1198 (2016 high) and 61.8% retracement of 1.0629 to 1.2004 at 1.1154 to complete it and bring rebound. A break of 1.2 key resistance is still expected in the medium term long term. However, sustained break of the mentioned support zone will mark reversal of the long term trend. In that case, 1.0629 key support will be back into focus.
EUR/USD Remains Bullish While USD/JPY Accelerates Decline
EUR/USD traded higher recently and broke the 1.1425 resistance zone. USD/JPY remained in a downtrend and it may continue to decline towards the 109.00 level.
Important Takeaways for EUR/USD and USD/JPY
- The Euro climbed higher recently and broke the 1.1425 resistance area.
- There is a key bullish trend line formed with support at 1.1440 on the hourly chart of EUR/USD.
- USD/JPY is under a lot of pressure and it may decline further towards 109.00.
- There is a major bearish trend line formed with resistance at 110.20 on the hourly chart.
EUR/USD Technical Analysis
The Euro started a decent upward move from the 1.1340 support level against the US Dollar. The EUR/USD pair traded higher and broke the 1.1380 and 1.1425 resistance levels.
There was even a close above the 1.1400 pivot level on FXOpen. The pair traded towards the 1.1475 level and settled above the 50 hourly simple moving average. The last swing high was near 1.1475 and later the pair corrected lower below 1.1450.
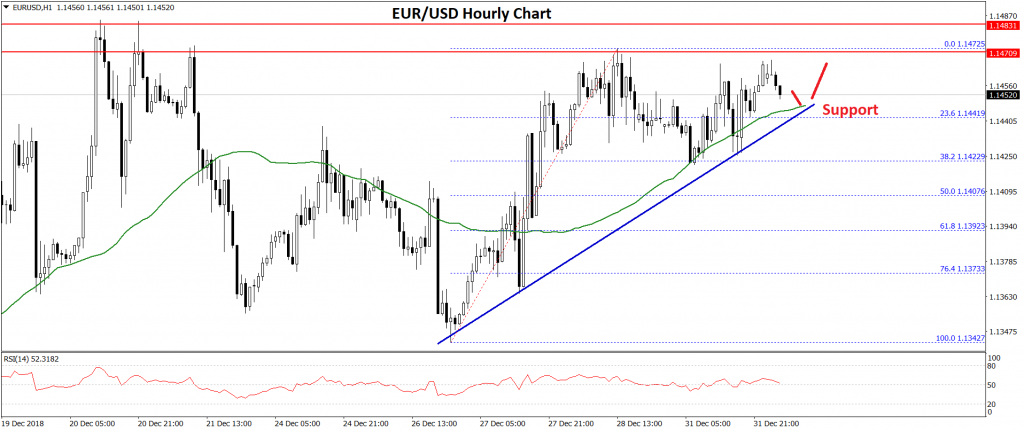
The pair even traded below the 23.6% Fib retracement level of the last wave from the 1.1342 low to 1.1472 high. However, the decline was protected near the 1.1422 level.
More importantly, there is a key bullish trend line formed with support at 1.1440 on the hourly chart of EUR/USD. The 38.2% Fib retracement level of the last wave from the 1.1342 low to 1.1472 high also acted as a solid support.
If the pair continues to move down, there could be a downside break below the 1.1400 support. The next support is at 1.1380 followed by 1.1350.
On the upside, the pair must break the 1.1475 and 1.1495 resistance levels to start a fresh bullish wave. A clear break above the 1.1500 resistance may well open the doors for a solid upward move towards the 1.1550 level in the near term.
USD/JPY Technical Analysis
The US Dollar remained in a significant downtrend from the 113.00 swing high against the Japanese Yen. The USD/JPY pair declined below the 112.50 and 111.60 support levels to move into a bearish zone.
Recently, the pair broke the 110.20 and 110.00 support levels to accelerate the decline. Sellers even pushed the pair below the 1.236 Fib extension level of the last wave from the 110.13 low to 111.40 high.
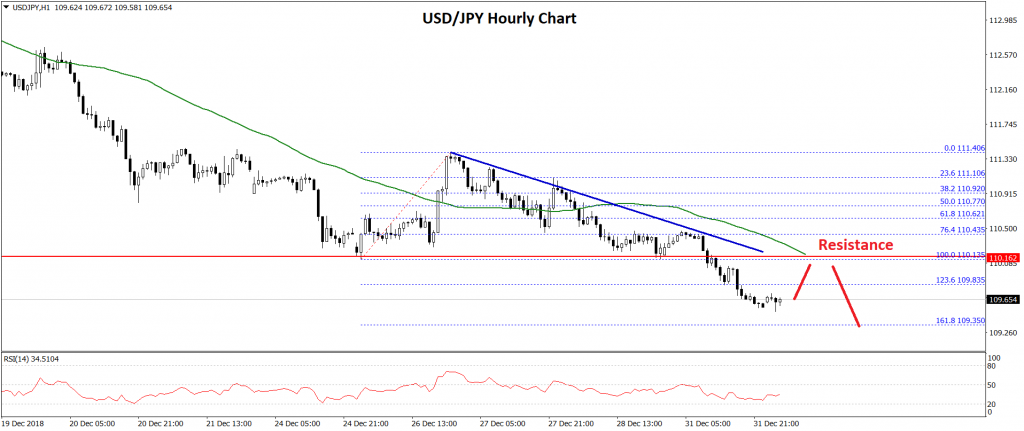
If the pair continues to move down below 109.30 and the 1.618 Fib extension level of the last wave from the 110.13 low to 111.40 high, then the pair may test the 109.00 support area in the near term.
On the upside, there is a strong resistance formed near the 110.15 level. There is also a major bearish trend line formed with resistance at 110.20 on the hourly chart.
Moreover, the 50 hourly simple moving average is also positioned near the 110.20 level. Therefore, a break above the trend line and 110.15 is needed for more gains in the near term.
Overall, the pair is positioned for more losses towards the 109.00 level as long as USD/JPY is placed below the 110.20 resistance level.
2018 In FX, Commodities & Indices
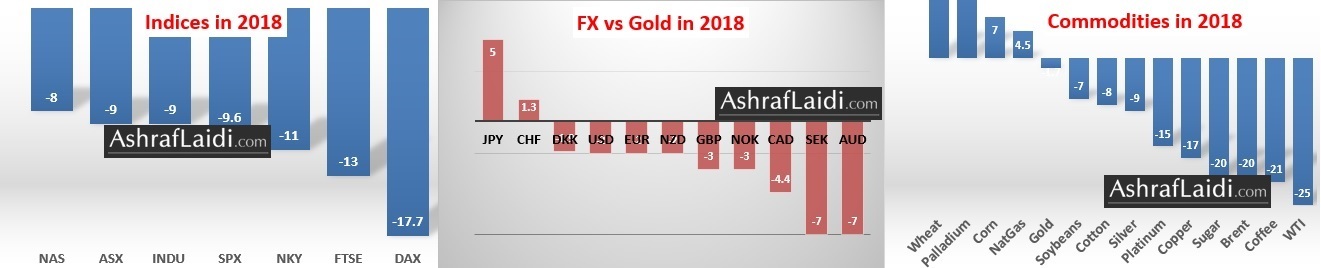
The last day of 2018 is winding down with more conflicting signals. The latest China PMI showed just how hard tariffs are hitting, while Trump on the weekend hinted at progress in trade talks. Markets started the week relatively flat ahead of last week's madness. Normally we'd expect extremely quiet trade through New Years but this year-end has been anything but normal. Tomorrow is a holiday almost everywhere, and US data on ISM and jobs will be released on Thursday and Friday respectively. The charts below rank the performance of global indices, FX and commodities.
President Trump teed up an upbeat start to the week after tweeting on Saturday that he had a call with Chinese President Xi and cited 'big progress made' on a comprehensive trade deal. Mid-level US officials will travel to China in the week of January 7 with 60 days remaining to broker a deal.
The optimism about a China deal was balanced by worry about Chinese industry after the official manufacturing PMI fell to 49.4 from 50.0. It was expected to remain unchanged. The drop is a fall to the lowest since July 2016. It was tempered by some good news in the services PMI at 53.8 compared to 53.2 expected.
The market is trying to sort out whether the global economy is simply slowing or grinding to a recession. There is concern about US industry as well but on Friday the Chicago PMI posted a reading of 65.4 compared to 60.3. That was in sharp contrast to a plunge in the Richmond Fed.
What will make the outlook going forward tricky is that the US Commerce Dept is shut down along with many other parts of the Federal government. That delayed Friday's planned releases of trade balance data and wholesale inventories. There's no sign of an end to the shutdown.
In Europe, Italy passed the 2019 budget after an acrimonious process. That ends this chapter but the seeds have been sewn for future problems.
USD/CAD Daily Outlook
Daily Pivots: (S1) 1.3487; (P) 1.3573; (R1) 1.3725; More...
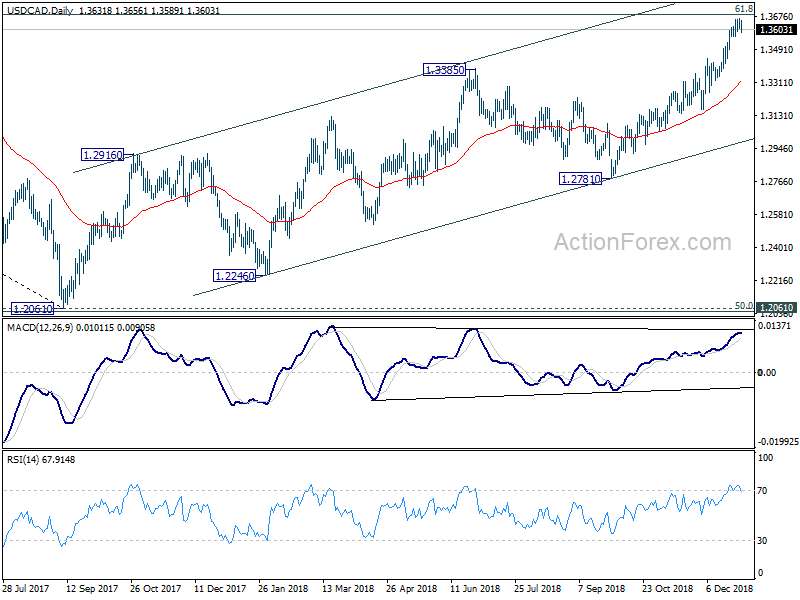
USD/CAD continues to lose upside momentum ahead of 1.3685 fibonacci level. But with 1.3566 minor support intact, further rise is still in favor. Decisive break of 1.3685 will target 1.3793 key medium term resistance next. On the downside, break of 1.3566 will indicate short term topping and bring deeper pull back to 55 day EMA (now at 1.3319).
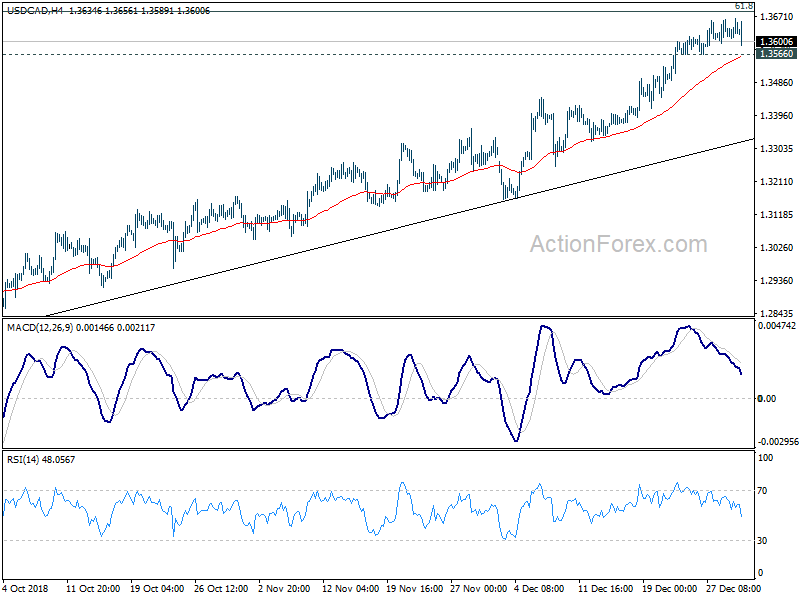
In the bigger picture, up trend from 1.2061 (2017 low) is still in progress and should target 61.8% retracement of 1.4689 (2016 high) to 1.2061 at 1.3685. At this point, the structure is not clearly impulsive yet. Hence, we'd be cautious on topping between 1.3685/3793. But in any case, medium term outlook will stay bullish as long as channel support (now at 1.2993) holds. Sustained break of 1.3793 will pave the way to retest 1.4689 (2015 high).