

Sample Category Title
Plop Plop Fizz Fizz , Oh What A Relief It Is
Markets
Thankfully for investors, the relentless selling on the back of risk-off sentiment which prevailed leading up to Xmas has mercifully halted as US stock markets recorded significant gains with the Dow surging over 1000 points while adding the most significant points gain in history.
It didn't take much to persuade the bargain hunters into action as early retailer reports are all pointing to a strong holiday season while investors took comfort in Kevin Hassett's, chairman of the White House Council of Economic Advisers, affirmation that Jerome Powell's job is “100 per cent” safe. And oil bulls finally had something to cheer about with WTI recovering north of 9 % reflecting gains in US equity markets but also supply discussions.
The surge in online purchases over the holiday season should be a reminder for the markets never to underestimate the purchasing power of the US consumer, as Mastercard payments tracking between November 1 and Christmas Eve leapt 5.1% from a year ago.
This data comes at the perfect time and will provide a huge relief for investors who had to watch with sheer horror the Christmas Eve plunge. There was a good buzz to buy the dip given the US underlying data suggested the latest rout was far too extreme and unwarranted. And indeed, for long-term investors who are more apt to weather the volatile times, which aren't about to leave the picture any time soon, post-Xmas equity market bargains were there for the taking. But this recovery should put to rest the feverish fear mongering that had investors believing the investment world as we know it, was coming to an end.
And adding to the positive vibe reports that A U.S. government delegation will travel to Beijing in the week of Jan. 7 to hold trade talks with Chinese officials.
But don't get too comfortable as discussions regarding the various political and policy questions remain hanging in the balance. Expect those conversations to continue Thursday amid a particularly light economic calendar.
Oil Markets
Oil bulls are breathing a collective sigh of relief this morning as the robust tone in global equity markets helped provide the perfect springboard for a massive rally in both WTI and Brent to ensue. A clear signal that the oil market tumult was rooted in the equity market volatility where investor sentiment has been weighted down by the unfortunate events in Washington, higher US Interest rates, China economic slowdown and the omnipresent US-China trade dispute.
But the real kicker for oil markets was the reaffirmation from Russian Energy Minister Novak who voiced expectations for a more stable market in H1 2019 and most importantly, suggested 100 % cooperation among OPEC and its allies in supporting the market. Also, Novak supported recent comments from other OPEC ministers indicating Russia's willingness to make deeper production cut if needed. Russia always remains a wild card, so with Novak singing the OPEC compliance tune, it's providing a massive boost to sentiment.
While demand side issue lingers, the overnight moves go a long way to righting the ship while reversing out much of questionable pre-Xmas sell-off that was lacking in any pure fundamental basis.
For good record, The American Petroleum Institute weekly statistical bulletin for the week ended December 21 has been delayed until 4:30 PM EST on Thursday.
The DOE Weekly Petroleum Status Report will follow at 11:00 AM EST on Friday.
Gold Markets
A case of too fast too soon given the US economic fundamentals were not screaming panic while fear mongering was steering the ship. Still various political and policy questions remain hanging in the balance not to mention an endless laundry list of concerns around Brexit and Trade wars which should keep Gold prices bid on dips. I still expect $ 1300 + in 2019 as given the recent equity market shellacking, unless there is significant progress on the trade front, the Fed will most likely hold off raising rates until Mid 2019 which should be supportive from gold prices. So, gold should continue to glitter in the risky environment despite overnight profit-taking triggered by surging equity markets and a stronger USD. Near-term support now comes in at $1260, indeed a bullish flip when I need to add 5 dollars to my support channel for four consecutive days.
Currency Markets
Improved equity market sentiment and Kevin Hassett's, support for Fed Chair Powell was a boost to over US capital market sentiment with saw the USD flourish overnight. USDJPY and EURUSD have both recalibrated 75-100pips in USD's favour,
US yields provided some support for USD as US 10y yields moved towards 2.8% following the 5y auction, which saw a 2.3bp tail.
On USDJPY, the lack of follow-through below 110 and with US equity markets stabilising yesterday, traders were lairing USDJPY stop losses around 110.75 anticipating a swift equity market correction if no selling follow through in the US session. Fairly prophetic as those stops were triggered overnight but USDJPY lower remains a favourite trade for G-10 traders.
On the EURUSD, the great debate continues with analysts expecting the ECB to hike next year while traders are taking a more pragmatic view based on the horrible EU economic data. But as we find markets trading the very familiar 1.1300 handle range trade mentality will likely kick in once again.
The Malaysian Ringgit
The local unit should take solace in surging oil prices along with the bullish flip in global equity markets.
These are two significant positives for Malaysian capital markets, despite the stronger USD.
Eco Data 12/27/18
[php_everywhere instance="1"]
S&P 500 Attempts to Fight off Bear Market
Stocks opened higher in NY after some market participants return from holiday. Over the holiday, President Trump attempted to assuage markets with votes of confidence in the US economy and Treasury Secretary Mnuchin. Mnuchin on Christmas Eve made calls with the heads of the six largest US banks. He confirmed they have enough liquidity to continue lending and that markets could continue to function properly. His decision to have a call with the President’s Working Group on financial markets crushed sentiment on what was supposed to be a thin trading session. The President reportedly has been getting increasingly frustrated with Treasury Secretary Mnuchin, despite publicly supporting him. The S&P 500 index fell 2.7% on Monday, the worst Christmas Eve ever, beating the 0.7% drop in 1985. This morning’s rebound occurs while most of Europe is closed for Boxing Day holiday. The government shutdown persists, and today’s session should remain choppy.
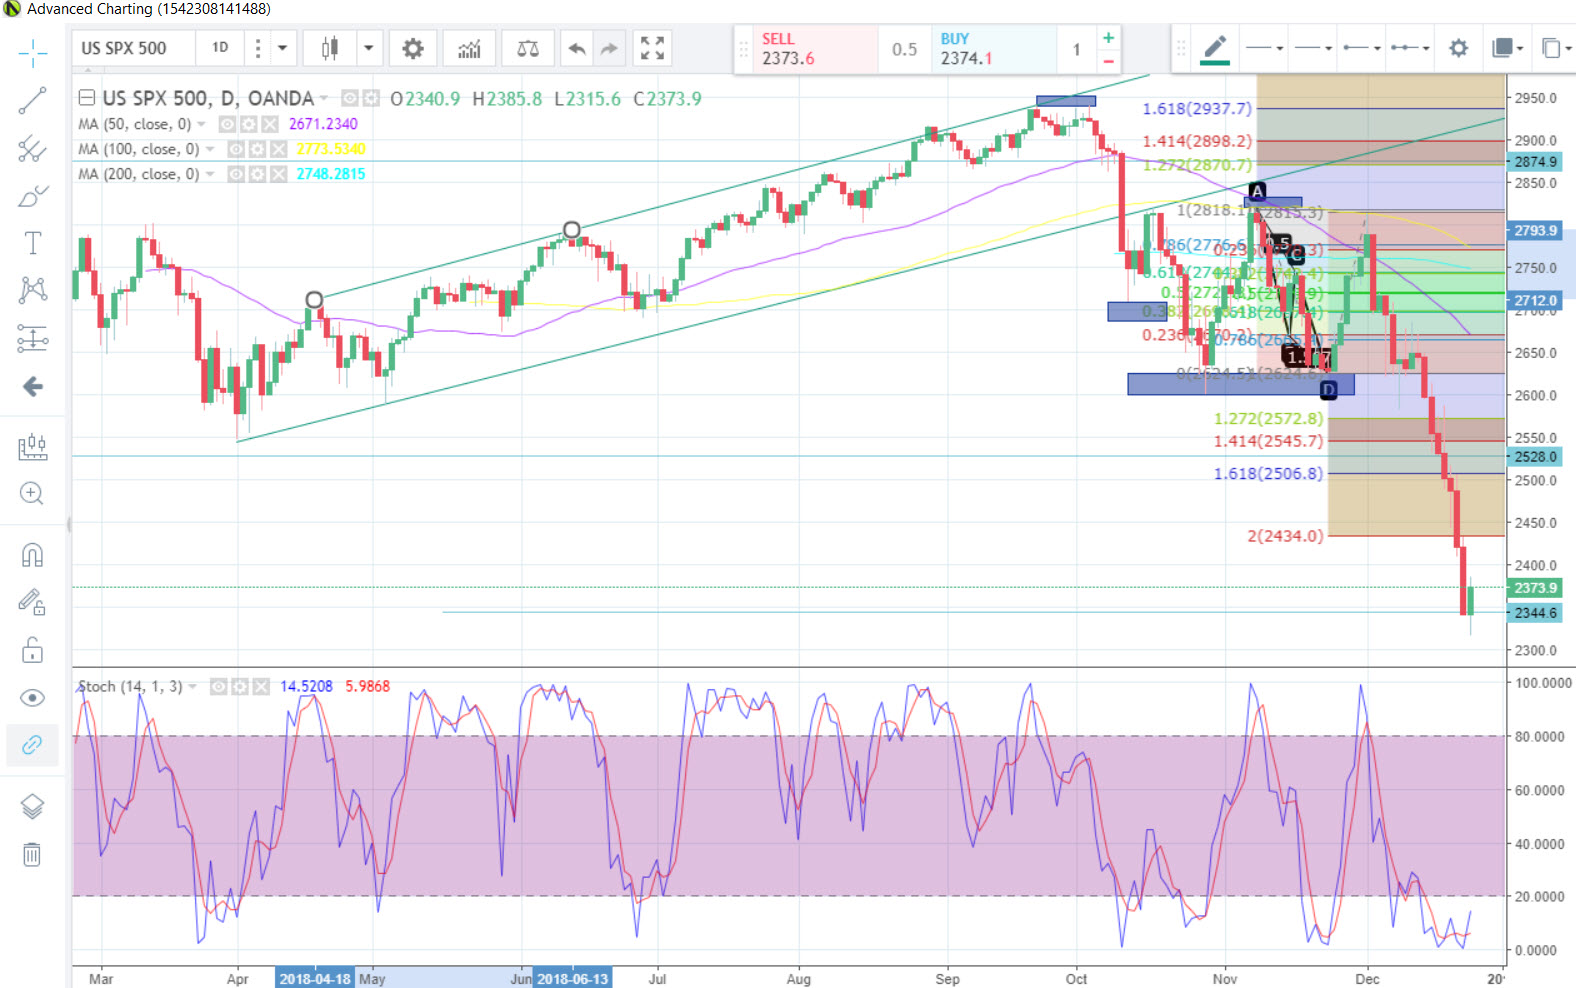
Everyone will watch to see if the S&P 500 Index can close into bear market territory and below the $2,344.60 level. Price action on the S&P 500 daily chart displays the acceleration lower took place once price formed a death cross early in December. Looking at the charts, one could think that US economy is already in a recession, but that is not quite the case just yet. Growth may slow 2% in 2019, but we should still be over a year or two from a recession. Another reason to be optimistic is if we see further progress with trade talks, which would alleviate global growth concerns. If we see the Fed catch up with the markets’ dovish expectations and that could be supportive for a softer dollar and stronger for equities. The current government shutdown is likely to persist a little more, but we may not see be enough of a catalyst to take stocks another major leg lower. The current sell-off could also pose a great entry for long-term value investors who are aiming to hold positions between 3 and 5 years.
EUR/USD Mid-Day Outlook
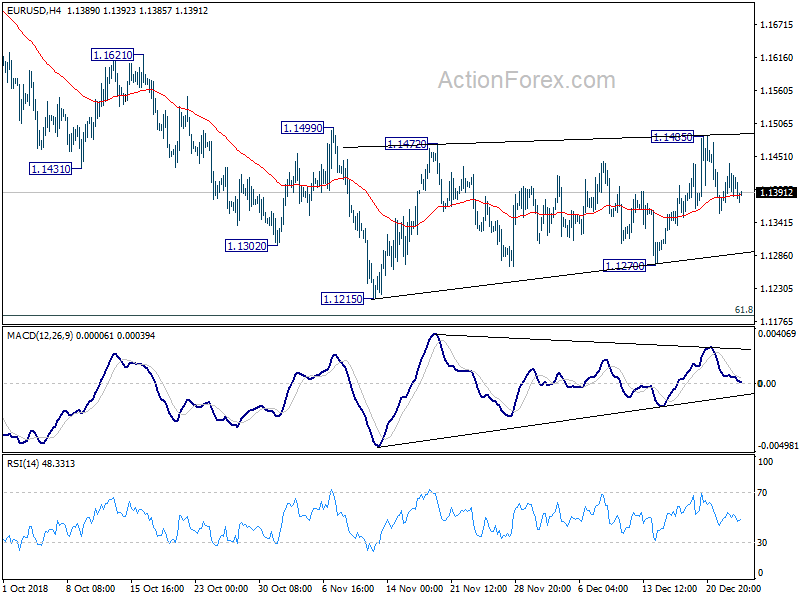
Daily Pivots: (S1) 1.1366; (P) 1.1395; (R1) 1.1425; More.....
No change in EUR/USD's outlook. It's staying in range of 1.1270/1485 and intraday bias remains neutral first. On the upside, break of 1.1485 resistance will revive the case of near term reversal. Intraday bias will be turned back to the upside for 1.1621 resistance first. Break will target 1.1814 key resistance next. On the downside, break of 1.1270 will, instead, revive the bearish case that down trend from 1.2555 is still in progress. Intraday bias will be turned back to the downside for 1.1186 key fibonacci level.
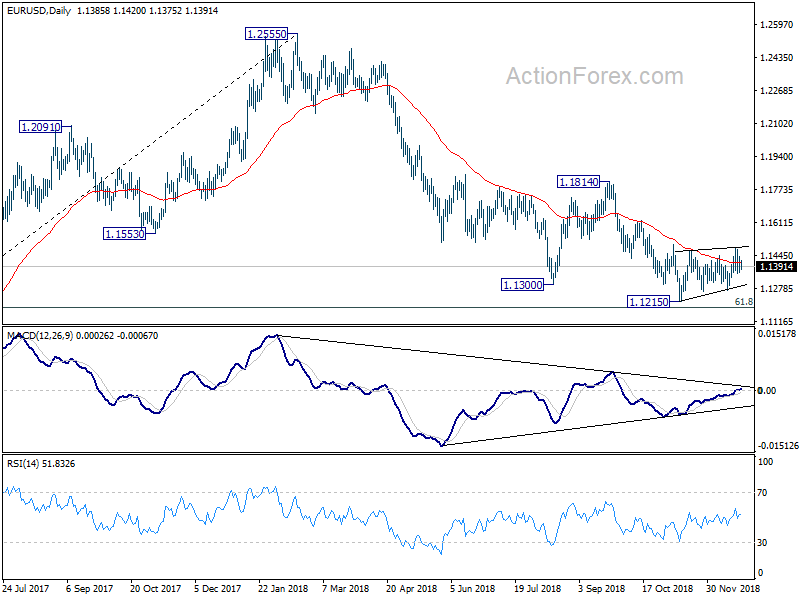
In the bigger picture, as long as 1.1814 resistance holds, down trend down trend from 1.2555 medium term top is still in progress and should target 61.8% retracement of 1.0339 (2017 low) to 1.2555 at 1.1186 next. Sustained break there will pave the way to retest 1.0339. However, break of 1.1814 will confirm completion of such down trend and turn medium term outlook bullish.
GBP/USD Mid-Day Outlook
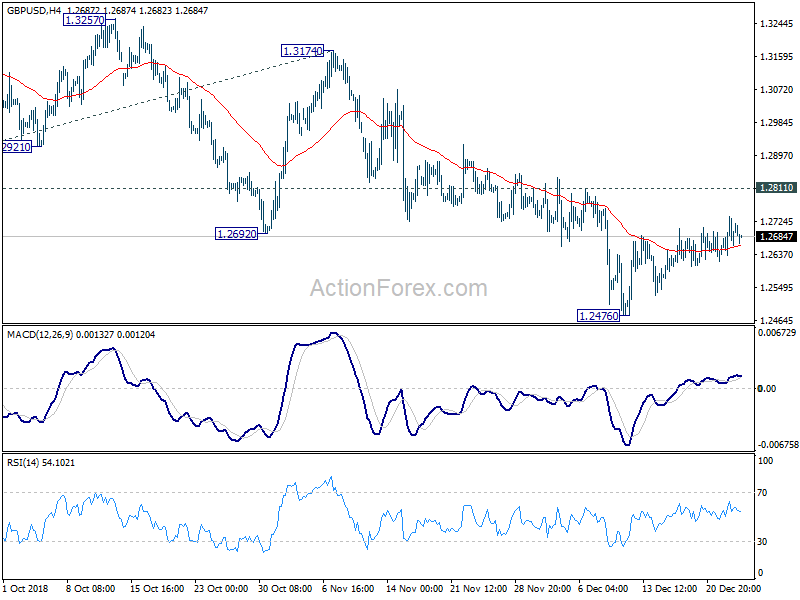
Daily Pivots: (S1) 1.2615; (P) 1.2696; (R1) 1.2758; More....
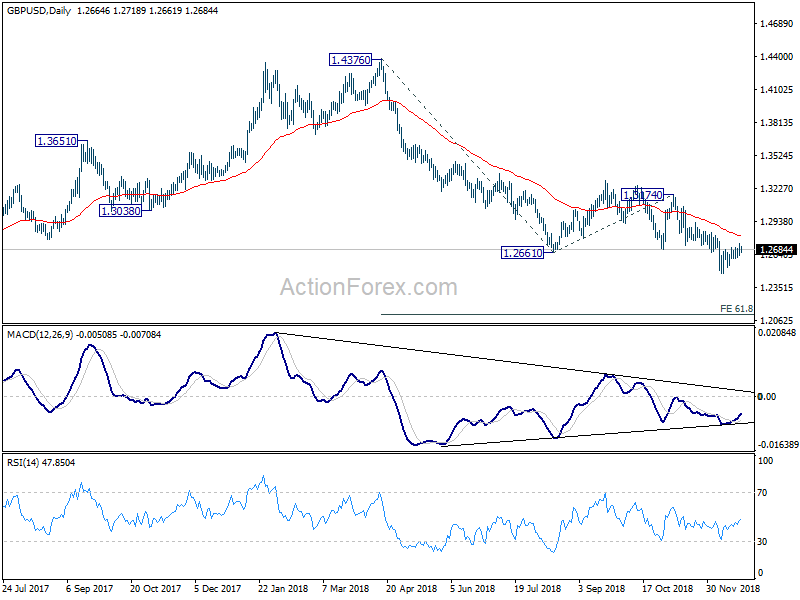
GBP/USD's consolidation from 1.2476 is still extending and intraday bias stays neutral. Also, upside of recovery should be limited by 1.2811 resistance to bring decline resumption. On the downside, break of 1.2476 will extend larger down trend from 1.4376 to 61.8% projection of 1.4376 to 1.2661 from 1.3174 at 1.2114. However, firm break of 1.2811 will be an early signal of trend reversal and turn focus back to 1.3174 resistance.
In the bigger picture, whole medium term rebound from 1.1946 (2016 low) should have completed at 1.4376 already, after rejection from 55 month EMA. The structure and momentum of the fall from 1.4376 argues that it's resuming long term down trend from 2.1161 (2007 high). And this will now remain the preferred case as long as 1.3174 structural resistance holds. GBP/USD should now target a test on 1.1946 first. Decisive break there will confirm our bearish view.
USD/JPY Mid-Day Outlook
Daily Pivots: (S1) 109.97; (P) 110.26; (R1) 110.53; More..
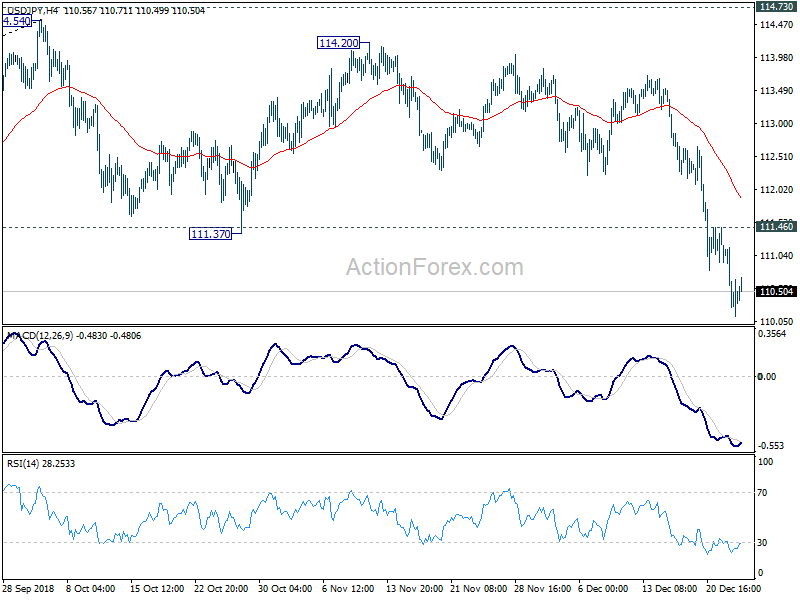
With 111.46 minor resistance intact, deeper decline is still expected in USD/JPY for 109.76 key support. Firm break there will confirm bearish reversal. Further fall should then be seen to 61.8% retracement of 104.62 to 114.54 at 108.40 and below. Nevertheless, break of 111.46 resistance will revive near term bluishness and turn bias back to the upside for 55 day EMA (now at 112.63) first.
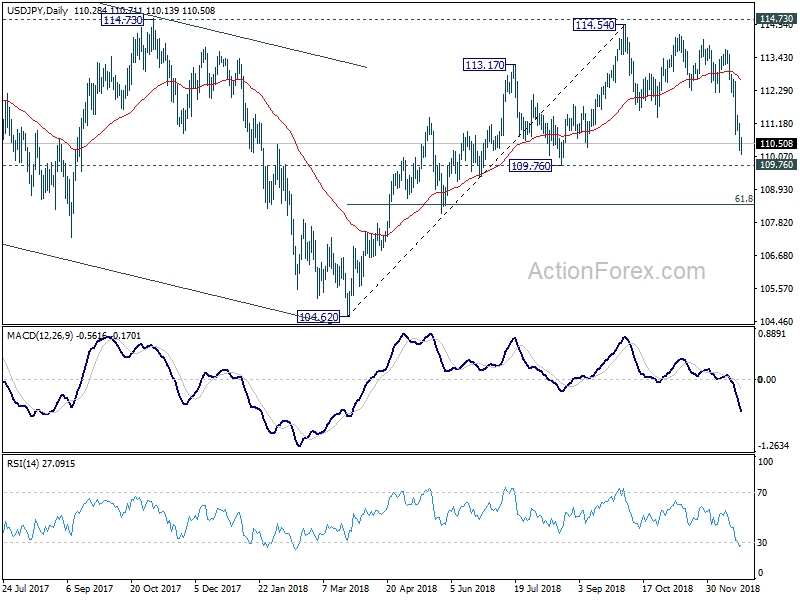
In the bigger picture, price actions from 125.85 (2015 high) are seen as a long term corrective pattern, no change in this view. Apparently, such corrective pattern is not completed yet. Break of 109.76 support will start another medium term down leg to 98.97/104.62 support zone. On the upside, break of 114.73 resistance will likely extend the rise from 98.97 through 118.65 resistance.
USD/CHF Mid-Day Outlook
Daily Pivots: (S1) 0.9818; (P) 0.9855; (R1) 0.9909; More...
USD/CHF rebounded strongly just ahead of 0.9848 key support again. But upside is limited below 0.9989 resistance. Intraday bias remains neutral first. At this point, we'd still expect strong support from 0.9848 to contain downside to complete the correction from 1.0128. On the upside, break of 0.9989 resistance will argue that such correction is completed. Intraday bias will be turned back to the upside for retesting 1.0128 high. However, decisive break of 0.9848 support will bring deeper decline to 0.9541 key support instead.
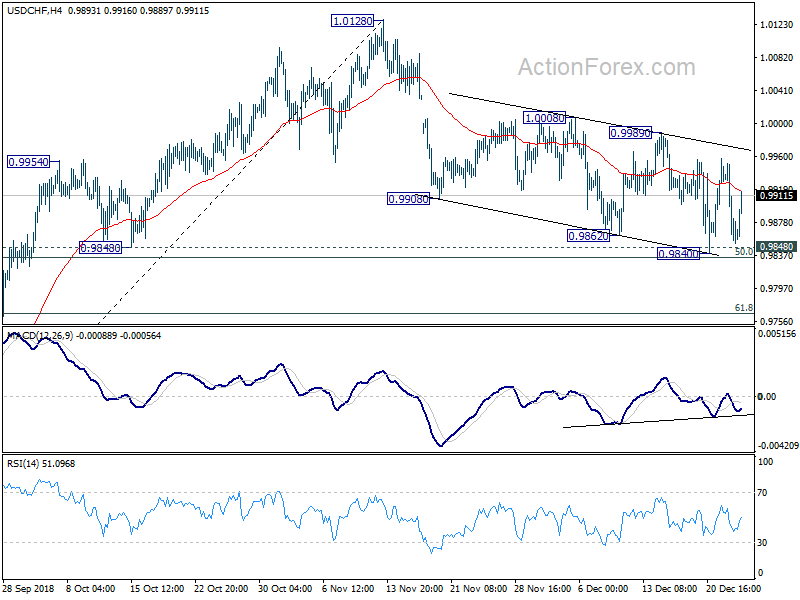
In the bigger picture, current development suggests that the medium term rally from 0.9186 hasn't completed yet. Break of 1.0128 will target 1.0342 key resistance next (2016 high). On the downside, firm break of 0.9848 support will dampen this bullish view and turn focus back to 0.9541 key support instead.
Subdued Holiday Trading Continues, Yen and Swiss Franc Pare Gains
The forex markets are generally rather quite today as most major countries remained on holiday. After another day of free fall on Monday, US stocks futures point to higher open. DOW could recover by triple-digit but the sustainability of the rebound is questionable.
There is no end in sight on US government shutdown. And, while we may feel refreshed after a holiday, the global economy won't. Today's rebound in US equities could just be setting itself up for another decline. And as usual, we'd listen, with tremendous caution, to people calling us to buy dips in bear markets.
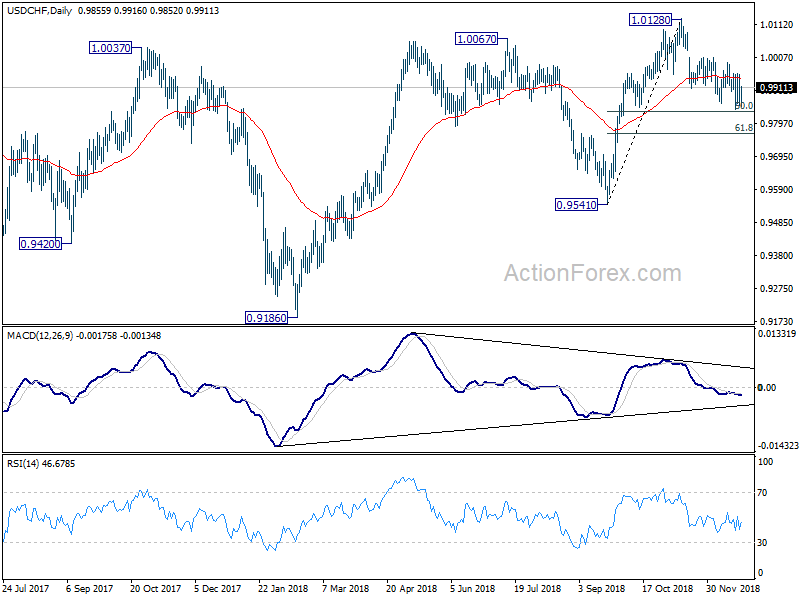
Anyway, for now, Australian Dollar is the strongest one for today, followed by New Zealand and then Canadian Dollar. Yen is the weakest followed by Swiss Franc, and then Euro. The picture could change quite drastically for the rest of the week.
BoJ Kuroda: Stock markets unstable due to global risks
In a speech at the Meeting of Councillors of Nippon Keidanren (Japan Business Federation) in Tokyo, BoJ Governor Haruhiko Kuroda warned that "it's necessary to bear in mind that uncertainties have recently increased with respect to developments in overseas economies."
He noted that the "stock market has been somewhat unstable". And, "the fluctuations are partly attributable to changes in perception of various risks surrounding the global economy".
On monetary policy, though, Kuroda sounded rather cautious. He said "In complex times like now, what's required is to persistently continue with the current powerful easing while weighing the benefits and costs of our policy in a balanced manner."
BoJ Minutes: Global economy to grow firmly on whole with increasing disparities
In the minutes of October 30/31 BoJ meeting, there consensus that the global economies continued to grow "firmly on the whole" However, there had been "increasing disparities of growth" among countries and regions. Some members urged to pay attention to slowing pace of improvement in business sentiments, as seen in PMIs in "declining trend". One member noted due to trade friction and rising US interest rates, overseas economies were "beginning to level off".
On Japan's price developments, members believed that the "continued relatively weak developments in prices compared to the economic expansion and the labor market tightening largely had been affected by the deeply entrenched mindset and behavior". But year-on-year change in CPI was "likely to increase gradually toward 2 percent, mainly on the back of the output gap remaining positive and medium- to long-term inflation expectations rising. "
On risks to baseline scenario of economic activity and prices, the minutes pointed to four upside and downside risk factor : (1) developments in overseas economies; (2) the effects of the scheduled consumption tax hike; (3) firms' and households' medium- to long-term growth expectations; and (4) fiscal sustainability in the medium to long term. On specific risks to prices, members pointed to the following three factors: (1) developments in medium- to long-term inflation expectations; (2) the responsiveness of prices to the output gap; and (3) developments in foreign exchange rates and international commodity prices.
Looking ahead
Global markets are will be back from holidays tomorrow. ECB will release monthly economic bulletin on Thursday, but that's more likely quite academic. BoJ summary of opinions will be something that's worth a read. On data front, US consumer confidence, Japan industrial production, Germany CPI, Swiss KOF will catch most attention. Here are some highlights for the rest of the short week:
- Thursday: Japan housing starts; ECB monthly bulletin; US jobless claims, house price index, consumer confidence, new home sales
- Friday: Japan Tokyo CPI, unemployment rate industrial production retail sales, BoJ summary of opinions; German CPI; Swiss KOF economic barometer; UK BBA mortgage approvals; US trade balance, wholesale inventories, Chicago PMI, pending home sales
USD/CHF Mid-Day Outlook
Daily Pivots: (S1) 0.9818; (P) 0.9855; (R1) 0.9909; More...
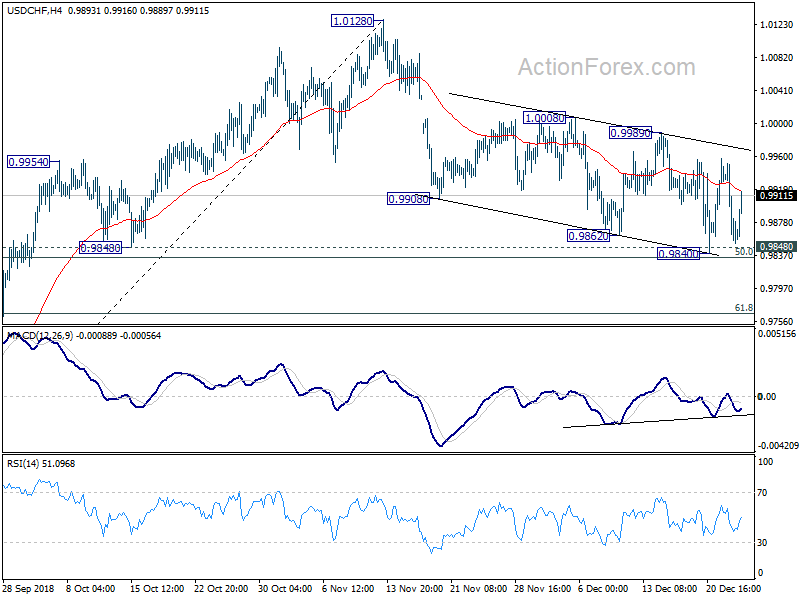
USD/CHF rebounded strongly just ahead of 0.9848 key support again. But upside is limited below 0.9989 resistance. Intraday bias remains neutral first. At this point, we'd still expect strong support from 0.9848 to contain downside to complete the correction from 1.0128. On the upside, break of 0.9989 resistance will argue that such correction is completed. Intraday bias will be turned back to the upside for retesting 1.0128 high. However, decisive break of 0.9848 support will bring deeper decline to 0.9541 key support instead.
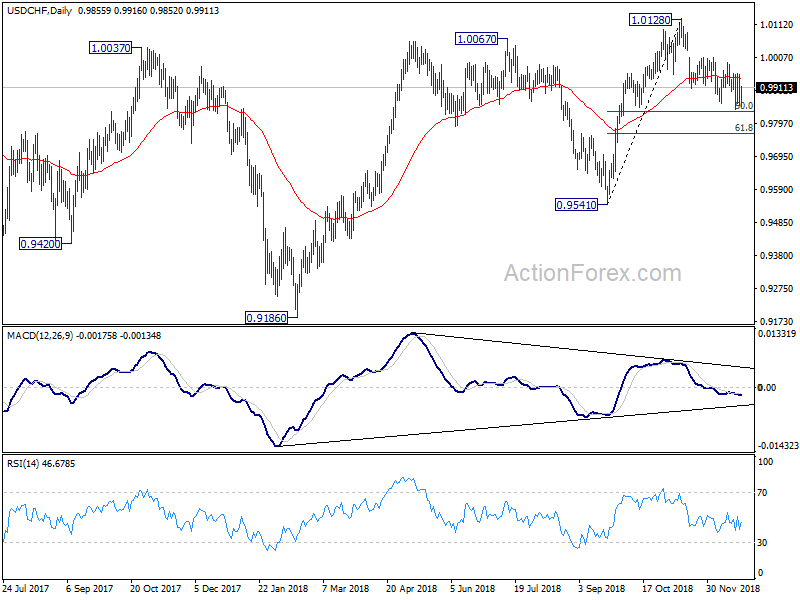
In the bigger picture, current development suggests that the medium term rally from 0.9186 hasn't completed yet. Break of 1.0128 will target 1.0342 key resistance next (2016 high). On the downside, firm break of 0.9848 support will dampen this bullish view and turn focus back to 0.9541 key support instead.
Economic Indicators Update
| GMT | Ccy | Events | Actual | Forecast | Previous | Revised |
|---|---|---|---|---|---|---|
| CH DE UK CA bank holiday | ||||||
| 23:50 | JPY | BOJ Minutes | ||||
| 14:00 | USD | S&P/Case-Shiller Composite-20 Y/Y Oct | 4.80% | 5.10% | ||
| 15:00 | USD | Richmond Fed Manufact. Index Dec | 14 |
Into US session: AUD recovers, Yen pulls back. But AUD/JPY just in corrective rebound
Markets remain rather quiet today as most of the major markets are still on holiday. Though activity could back with the US later today. For now, Australian and New Zealand Dollar are the strongest ones for today so far while yen and Swiss Franc are the weakest.
That's probably be due to easing risk aversion as US futures point to slightly higher open. But it should be noted that a higher open doesn't necessary mean a sustainable rebound in stocks. It could also be setting up the markets for another deep fall. Let's see.
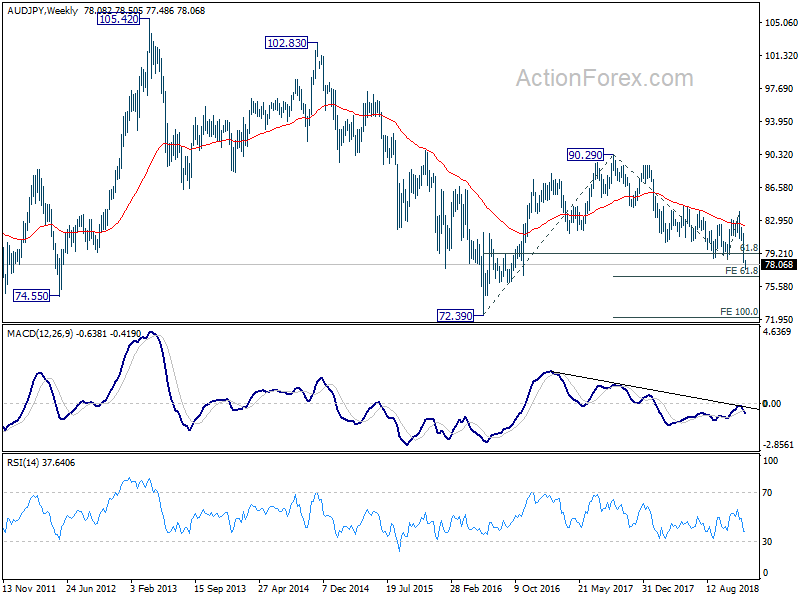
For now AUD/JPY is the top mover for today. But that's just a corrective recovery. AUD/JPY is indeed the worst performer for the month on risk aversion. It's down -5.96% for the month, quite a distance from second top mover NZD/JPY.
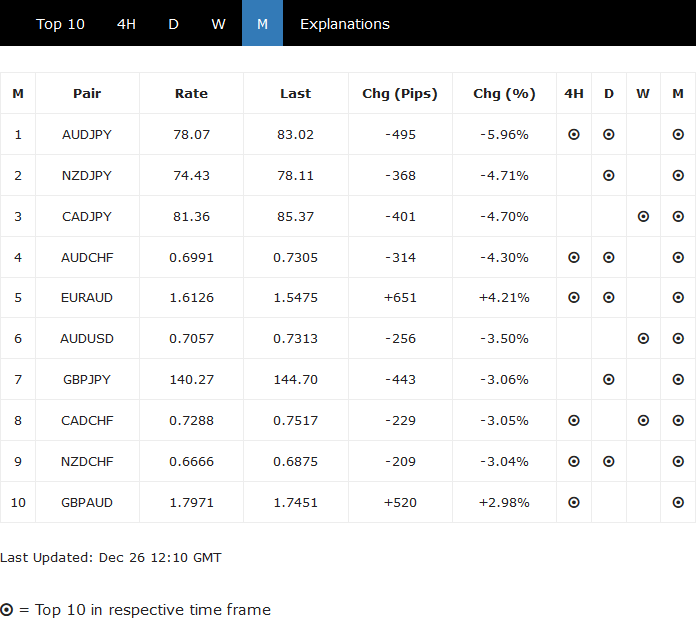
AUD/JPY's strong break of 78.56 support last week confirmed resumption of the down trend from 90.29 high.
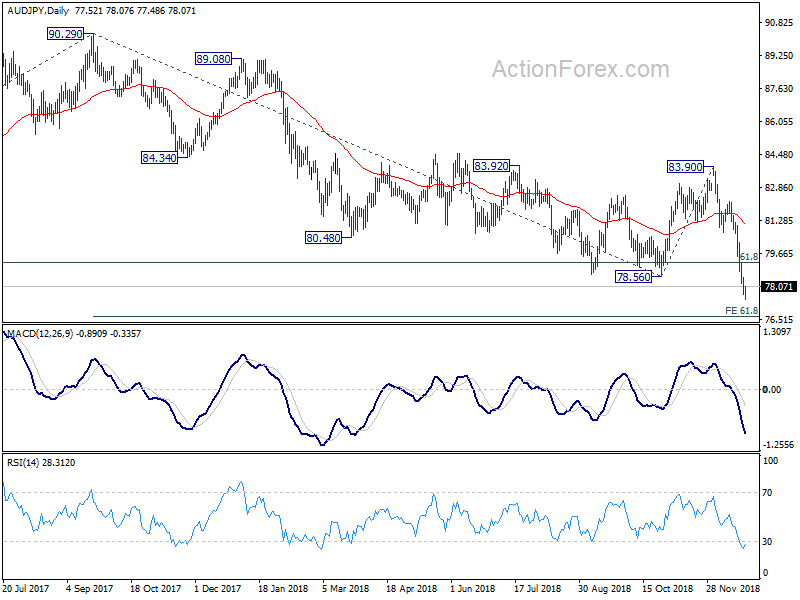
More importantly, AUD/JPY failed to sustain above falling 55 week EMA on last rebound attempt. Weekly MACD was also held below zero. It's also now broken 61.8% retracement of 72.39 to 90.29 decisively. These are also bearish signals. And fall from 90.29 could indeed be resuming larger down trend from 105.42 (2013 high). AUD/JPY should now target 61.8% projection of 90.29 to 78.56 from 83.90 at 76.65 first. Firm break there will add more credence to this long term bearish case.
The Analytical Overview Of The Main Currency Pairs
The EUR/USD currency pair
Technical indicators of the currency pair:
Prev Open: 1.13703
Open: 1.13890
% chg. over the last day: +0.12
Day's range: 1.13850 – 1.14199
52 wk range: 1.1214 – 1.2557
The trading activity and volatility on the major currencies have lowered due to the holidays. The USD is under pressure due to the political instability in the White House. The EUR is consolidating, the local support and resistance are 1.13700 and 1.14150. Positions should be opened from these levels.
The Economic News Feed for 26.12.2018 is calm.
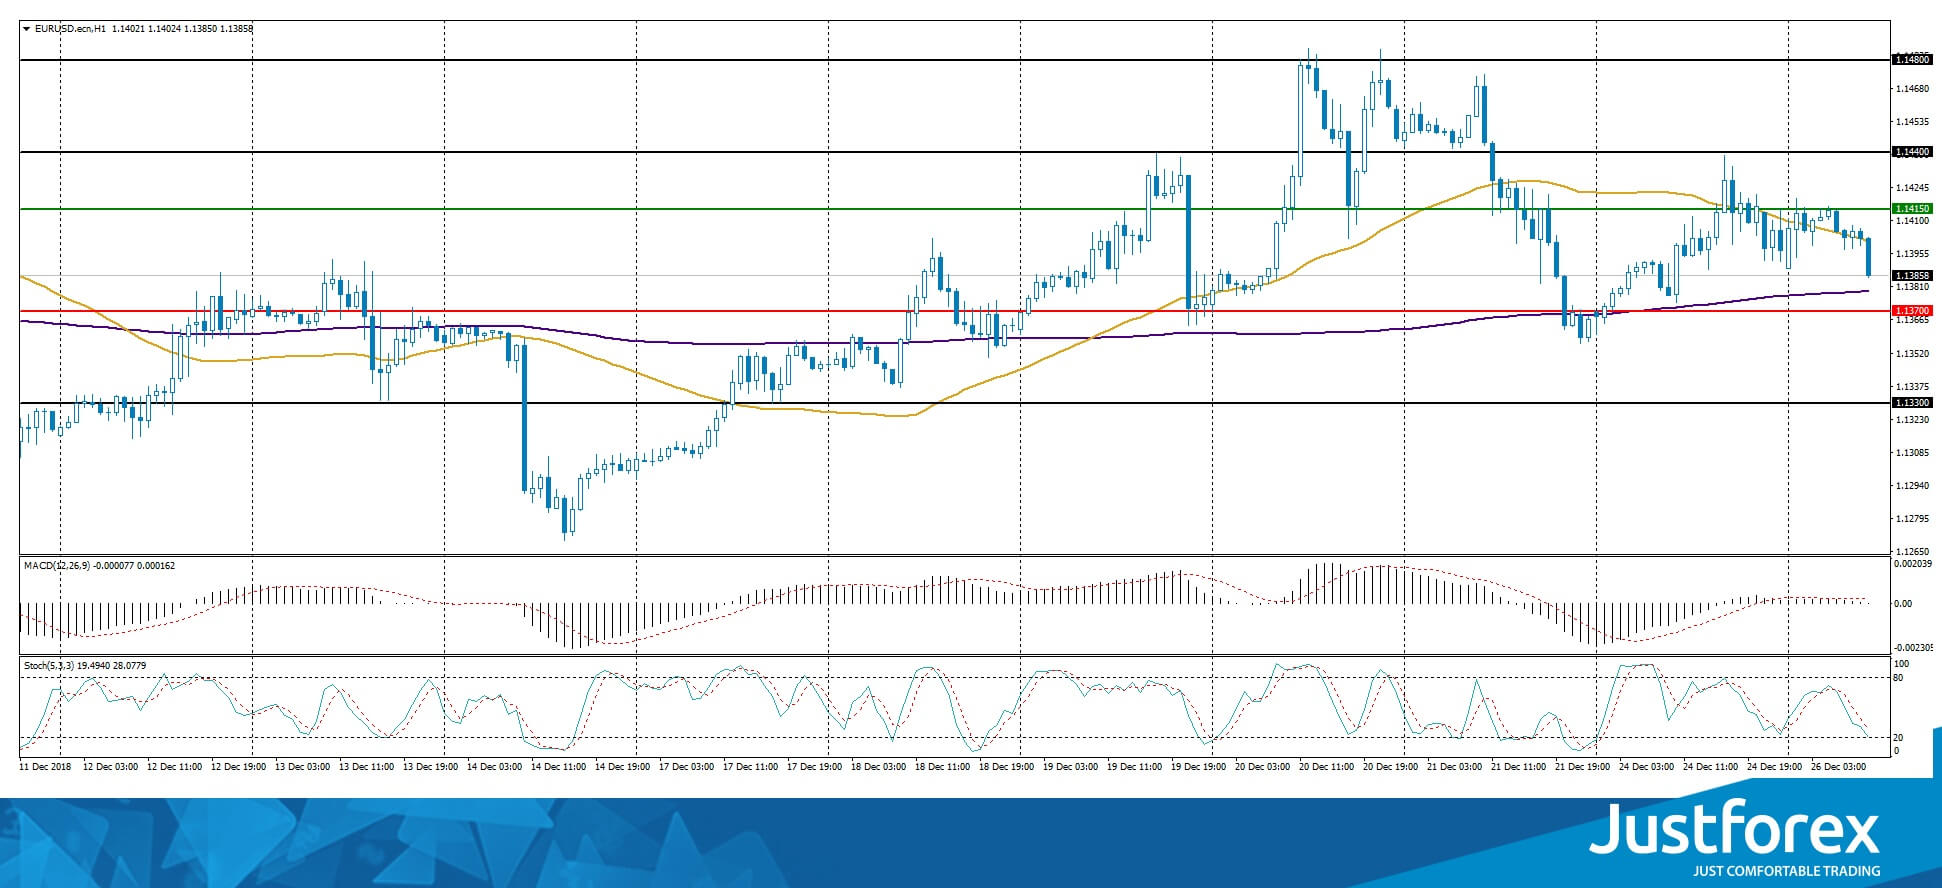
The indicators do not provide precise signals, the price has crossed 50 MA and 200 MA.
The MACD histogram is near the 0 mark.
The Stochastic Oscillator is in the neutral zone, the %K line is below the %D line, which points toward a bearish mood.
Trading recommendations
Support levels: 1.13700, 1.13300, 1.13000
Resistance levels: 1.14150, 1.14400, 1.14800
If the price fixes above the resistance level 1.14150, expect further growth of the EUR/USD quotes. The movement will tend toward 1.14400-1.14700.
Alternatively the quotes can descend toward 1.13400-1.13200.
The GBP/USD currency pair
Technical indicators of the currency pair:
Prev Open: 1.26414
Open: 1.26602
% chg. over the last day: +0.29
Day's range: 1.26542 – 1.27186
52 wk range: 1.2477 – 1.4378
GBP remains in a long flat. The technical picture is still ambiguous. The local support and resistance levels are 1.26700 and 1.27100. The financial market participants are waiting for additional drivers. You should open positions from these levels.
The Economic News Feed for 26.12.2018 is calm.
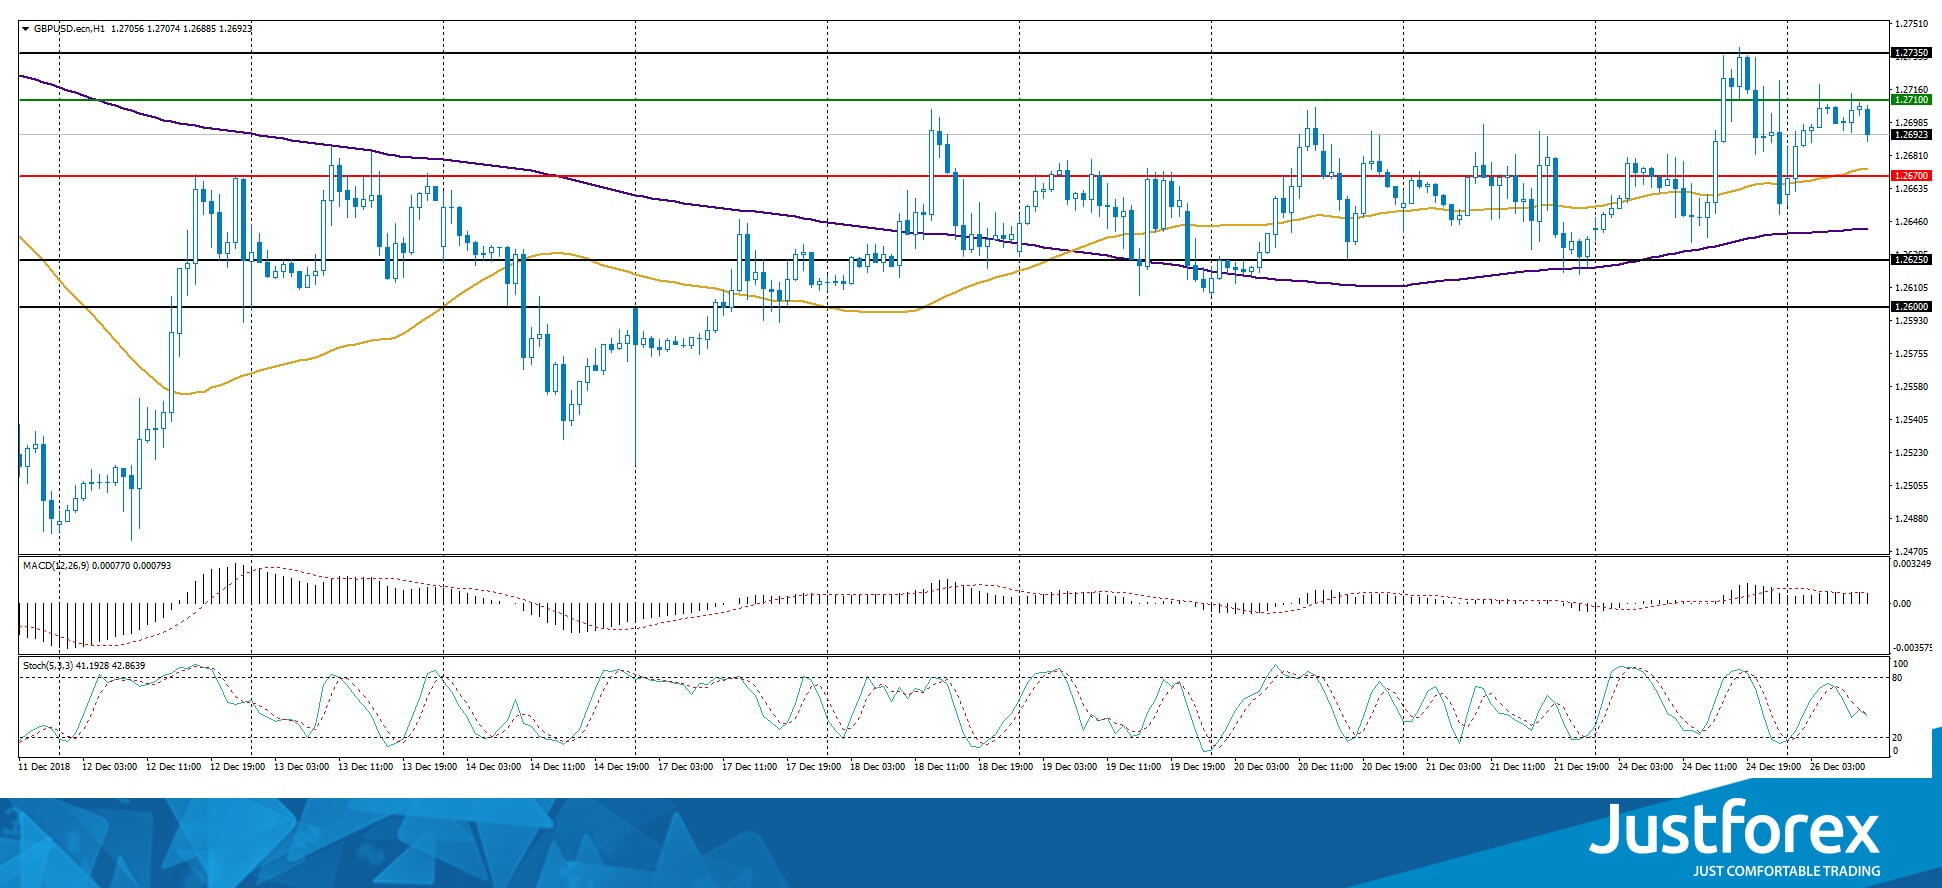
The price fixed above 50 MA and 200 MA which points toward the power of the buyers.
The MACD histogram is in the positive zone, which also signalizes a bullish mood.
The Stochastic Oscillator is in the neutral zone, the %K line crosses the %D line. There are no signals at the moment.
Trading recommendations
Support levels: 1.26700, 1.26250, 1.26000
Resistance levels: 1.27100, 1.27350
If the price fixes above the 1.27100 you should consider buying GBP/USD. The movement will tend toward 1.27400-1.27600.
Alternatively the quotes can descend to 1.26500-1.26250.
The USD/CAD currency pair
Technical indicators of the currency pair:
Prev Open: 1.35939
Open: 1.35782
% chg. over the last day: -0.12
Day's range: 1.35782 – 1.36135
52 wk range: 1.2248 – 1.4132
The USD/CAD currency pair shows a strong ascending trend. The CAD has weakened against the US by 350 pips since the beginning of the month. The USD/CAD currency pair is consolidating between 1.35650-1.36150. Positions should be opened from these levels. A technical correction is possible soon.
The Economic News Feed for 26.12.2018 is calm.
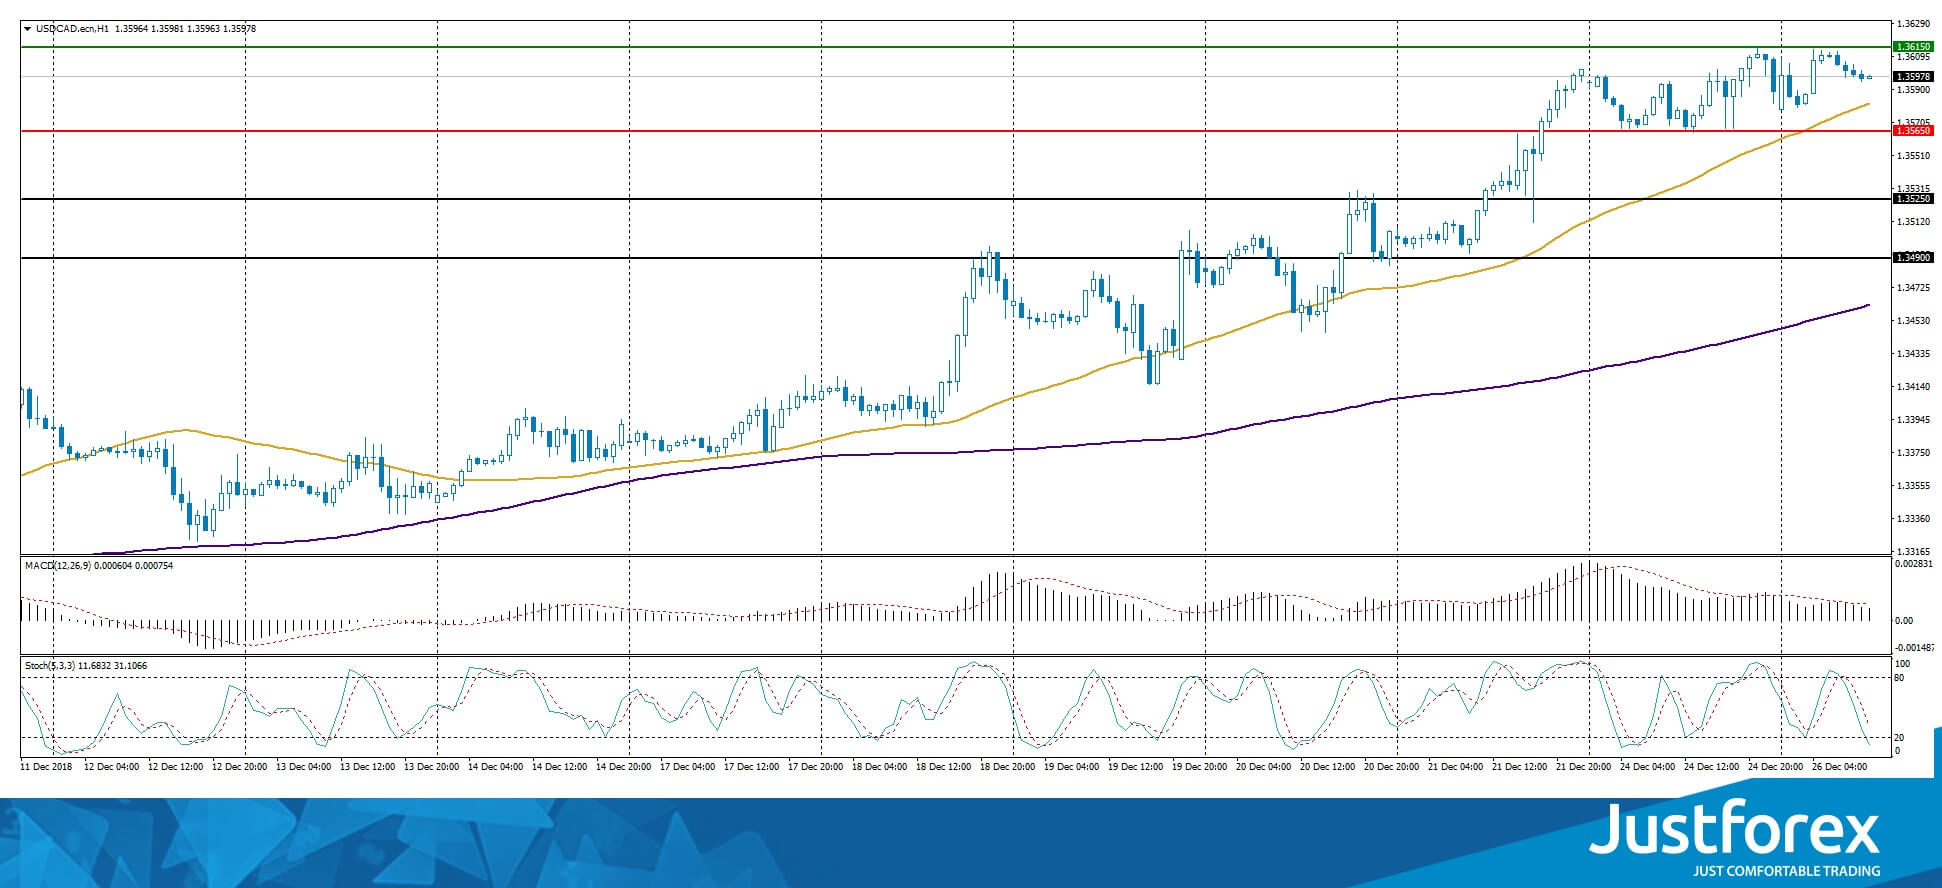
The price fixed above 50 MA and 200 MA, which indicates the power of the buyers.
The MACD histogram is in the positive zone but below the signal line, which gives a weak signal for buying USD/CAD.
The Stochastic Oscillator is in the neutral zone, the %K line is below the %D line, which indicates a bearish mood.
Trading recommendations
Support levels: 1.35650, 1.35250, 1.34900
Resistance levels: 1.36150, 1.36500
If the price fixes above the resistance level 1.36150 expect further growth of the USD/CAD quotes. The movement will tend to 1.36500-1.36700.
Alternatively, the price will fix below 1.35650, and you should look for the market entry points to open short positions. The movement will tend toward 1.35300-1.35000.
The USD/JPY currency pair
Technical indicators of the currency pair:
Prev Open: 110.942
Open: 110.230
% chg. over the last day: -0.56
Day's range: 110.138 – 110.673
52 wk range: 104.56 – 114.56
The USD/JPY currency shows a strong descending trend. The quote is consolidating around the monthly minimums. The key range is 110.200-110.700. A technical correction is possible soon. You should keep an eye on the US treasury bonds.
The Economic News Feed for 26.12.2018 is calm.
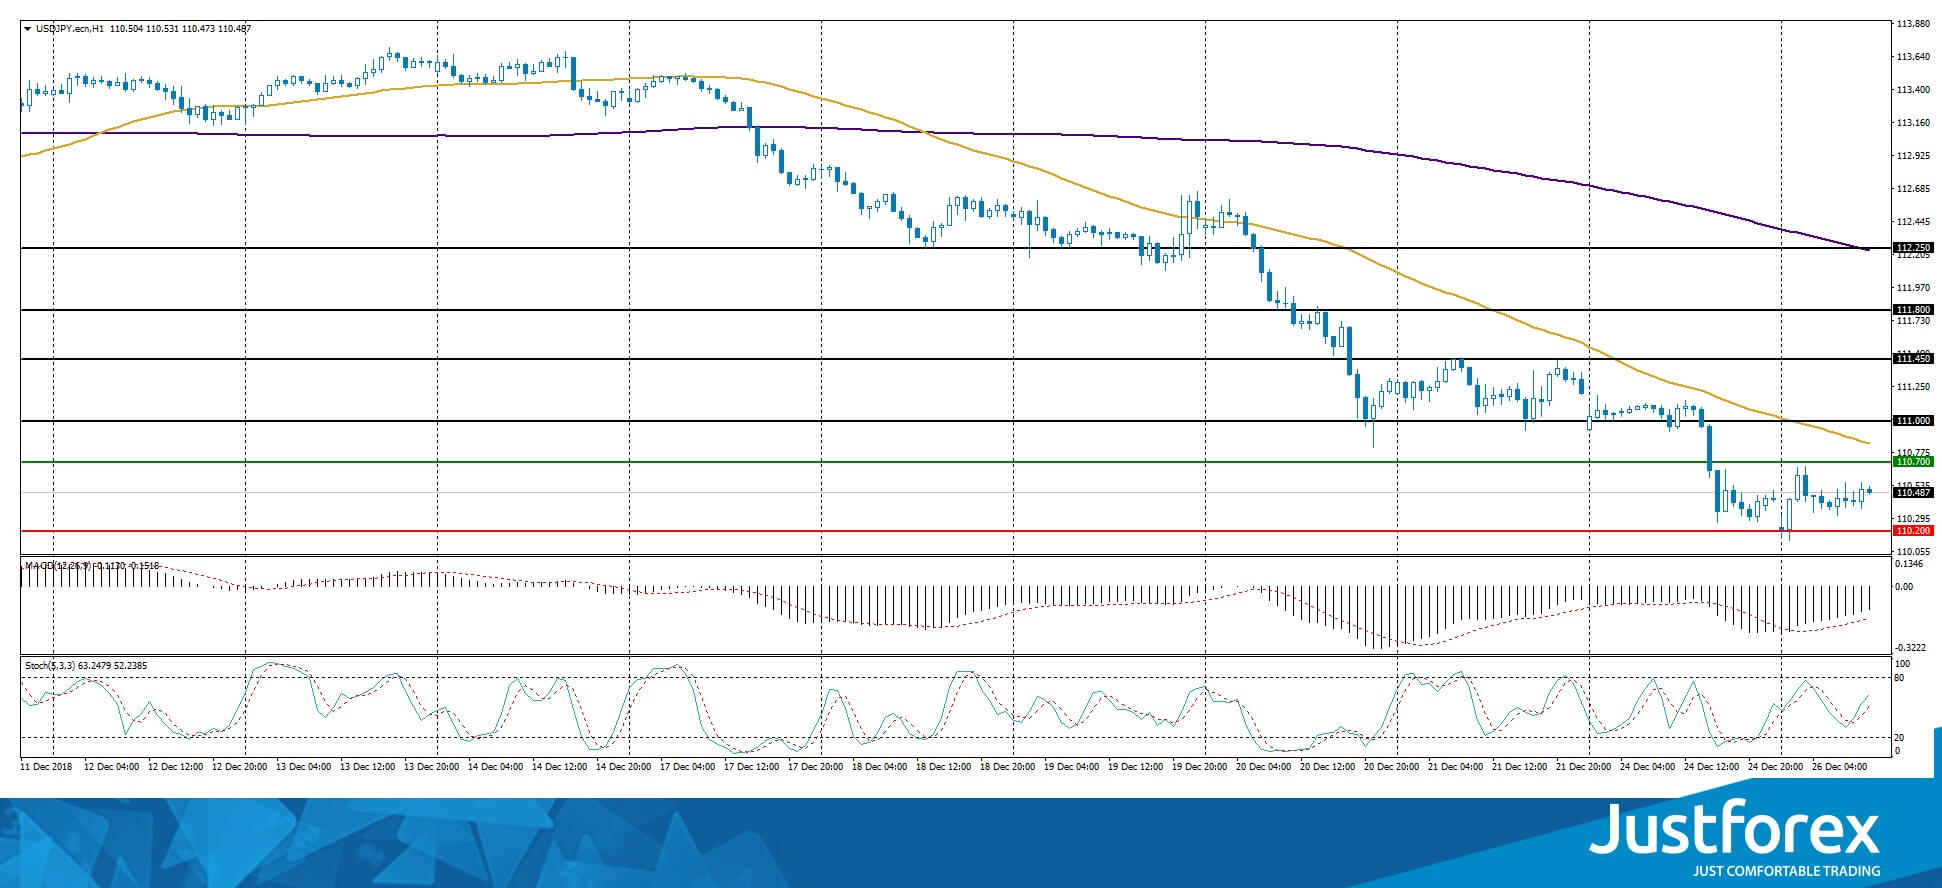
The indicators point toward the power of the buyers, the price fixed below 50 MA and 200 MA.
The MACD histogram is in the negative zone but above the signal line, which gives a weak signal to sell USD/JPY.
The Stochastic Oscillator is in the neutral zone, the %K line is above the %D line, which points toward a recovery of USD/JPY.
Trading recommendations
Support levels: 110.200, 110.000
Resistance levels: 110.700, 111.000, 111.450
If the price fixes below 110.200 expect further descend of the USD/JPY quotes toward 110.000-109.800.
Alternatively the quotes can recover toward 111.000-111.400.