Sample Category Title
Silver: White Metal Reverses Its Gains In The Morning Session
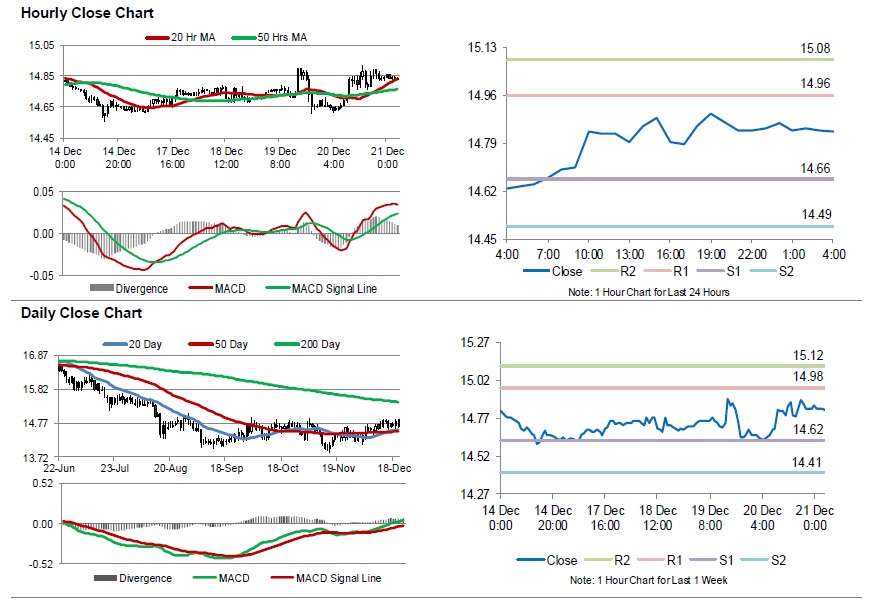
For the 24 hours to 23:00 GMT, Silver rose 0.99% against the USD and closed at USD14.84 per ounce, tracking gains in gold prices.
In the Asian session, at GMT0400, the pair is trading at 14.83, with silver trading 0.07% lower against the USD from yesterday’s close.
The pair is expected to find support at 14.66, and a fall through could take it to the next support level of 14.49. The pair is expected to find its first resistance at 14.96, and a rise through could take it to the next resistance level of 15.08.
The white metal is showing convergence with its 20 Hr moving average and trading above its 50 Hr moving average.
Crude Oil: Oil Trading Higher, Ahead Of Baker Hughes Weekly Rig Count Data
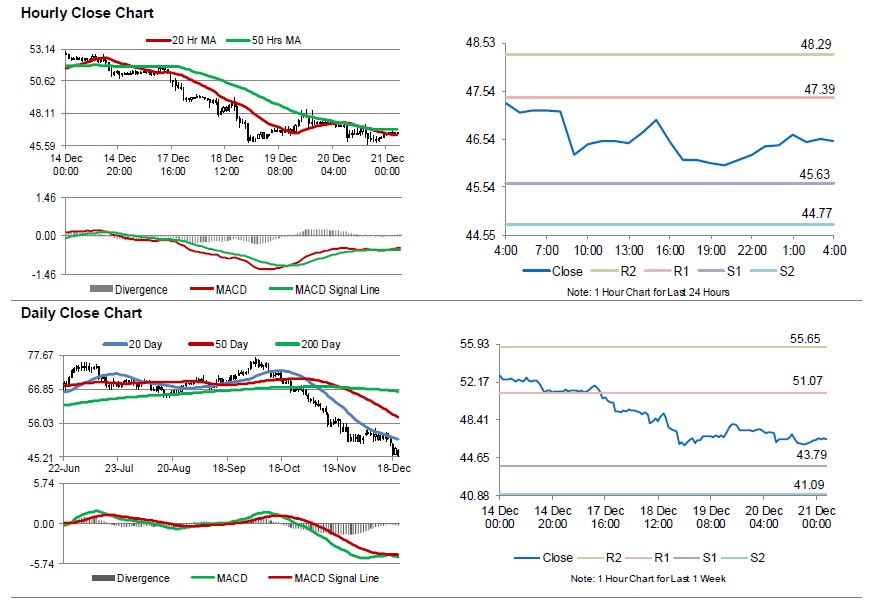
For the 24 hours to 23:00 GMT, Crude Oil declined 2.17% against the USD and closed at USD46.38 per barrel, amid worries over excess supply and outlook for energy demand.
In the Asian session, at GMT0400, the pair is trading at 46.49, with oil trading 0.24% higher against the USD from yesterday’s close.
The pair is expected to find support at 45.63, and a fall through could take it to the next support level of 44.77. The pair is expected to find its first resistance at 47.39, and a rise through could take it to the next resistance level of 48.29.
Crude oil is showing convergence with its 20 Hr moving average and trading below its 50 Hr moving average.
AUD/USD And NZD/USD Turned Sell On Rallies
AUD/USD declined recently and broke the 0.7150 support area. NZD/USD dropped heavily below 0.6800 and now recoveries are likely to face solid hurdles on the upside.
Important Takeaways for AUD/USD and NZD/USD
- The Aussie Dollar started a major downside move from 0.7200 and declined below 0.7150 against the US Dollar.
- There was a break below a major bullish trend line with support at 0.7170 on the hourly chart of AUD/USD.
- NZD/USD also fell significantly and broke the 0.6800 support area.
- There was a break below a key bullish trend line with support at 0.6810 on the hourly chart.
AUD/USD Technical Analysis
There were multiple failures near the 0.7245-0.7250 zone in the Aussie Dollar against the US Dollar. The AUD/USD pair started a major downside move and broke the 0.7200 and 0.7150 support levels.
The decline was such that the pair even broke the 0.7120 support level and the 50 hourly simple moving average. Moreover, there was a break below a major bullish trend line with support at 0.7170 on the hourly chart.
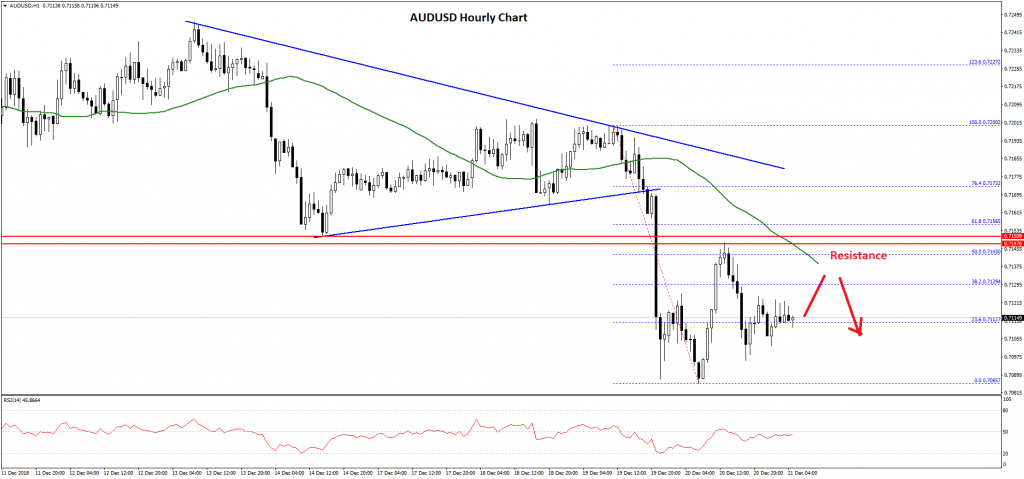
Finally, there was a push below the 0.7100 level and a low was formed at 0.7085 FXOpen. Later, the pair started an upside correction and traded above the 0.7120 level and the 38.2% Fib retracement level of the last drop from the 0.7200 high to 0.7085 low.
However, the upside move was capped by the 0.7145-0.7150 resistance zone, which was a support earlier. Moreover, the pair was rejected near the 50% Fib retracement level of the last drop from the 0.7200 high to 0.7085 low.
The pair declined once again and it is currently trading near the 0.7110 level. On the upside, there are many hurdles near the 0.7140, 0.7150, and the 50 hourly simple moving average.
Therefore, as long as the pair is below the 0.7150 resistance, it is likely to struggle. On the downside, a break below the 0.7100 support may call for more losses below the 0.7085 low in the near term.
NZD/USD Technical Analysis
After struggling a lot near the 0.7880 resistance area, the New Zealand Dollar started a downside move against the US Dollar. The NZD/USD pair broke the 0.6850 and 0.6820 support levels to move into a bearish zone.
During the decline, there was a break below a key bullish trend line with support at 0.6810 on the hourly chart. The pair settled below the 0.6800 support and the 50 hourly simple moving average.
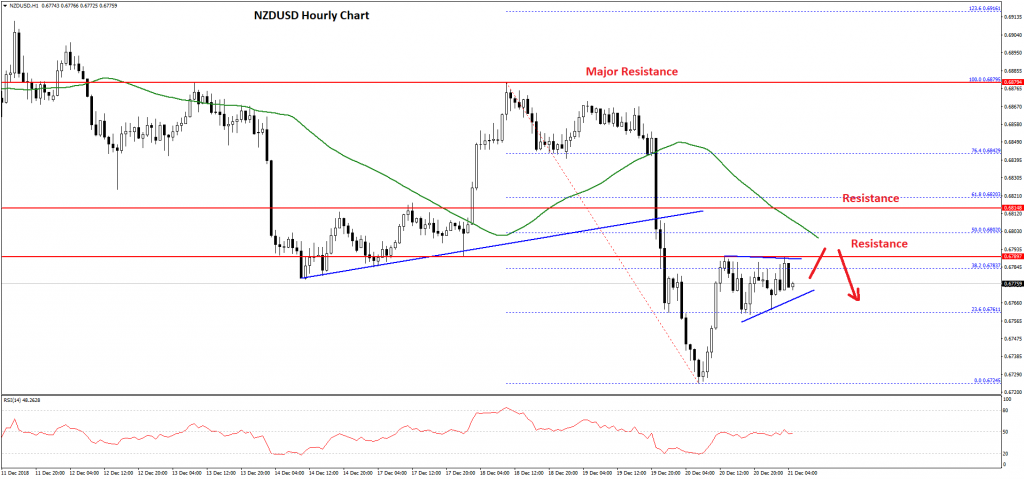
A new weekly low was formed at 0.6724 and later the pair corrected higher. It moved above the 0.6760 level and the 23.6% Fib retracement level of the recent decline from the 0.6879 high to 0.6724 low.
However, the pair is facing a solid resistance near the 0.6790 level. Above 0.6790, the next resistance is near the 0.6800 level and the 50% Fib retracement level of the recent decline from the 0.6879 high to 0.6724 low.
The 50 hourly simple moving average is also around the 0.6800 barrier. Therefore, as long as the pair is below the 0.6800 resistance, it is likely to resume its decline. If there is a close above 0.6800, the pair may bounce back towards the 0.6840 level.
On the downside, the main support is at 0.6760, below which the NZD/USD pair could decline towards the 0.6725 support area.
Market Morning Briefing: Aussie Is Likely To Test 0.710-0.705
STOCKS
Global equities in the grip of bears, with Dow and DAX more bearish than the Nikkei and Shanghai. India outperforms handsomely.
We were unable to work out a bearish target yesterday for the Dow (22859.60, -464.06, -1.99%), but now have something for you. Immediate Support seen between 22650-22500. Can produce a relief rally to 23500, to be followed by a fresh decline towards 21500-210000 in the longer term.
The DAX (10611.10, -155.11, -1.44%) saw a low of 10563.44 yesterday, coming close to our bear-target of 10500-400. A small relief rally towards 11000 might be possible over the Christmas and New Year weeks, but january is likely to see a fall 10000.
Good fall in the Nikkei (20068.23) over yesterday and today. A test of 19500 is quite likely in the near term, but that is a strong Support to be kept in mind.
The Shanghai (2511, -0.97%) trades below 2525 and could therefore test 2450, as mentioned yesterday. Note, however, that that would be a strong long-term Support.
The current bearishness in global equities might prevent the Nifty (10951.70, -15.60, -0.14%) from crossing past 11000 easily. But, the Nifty is likely to outperform its global counterparts easily.
COMMODITIES
Commodities are mixed. Brent looks bearish while there is medium term support on the WTI which if bounces could pull up Brent as well. Gold is trading near important resistance and could come off from there. Copper could remain stable before rising back to higher levels.
Sharp rise in Gold (1263.80) as Dollar Index moved lower. But while the immediate resistance near 1265 holds just now, we may see a dip in the Gold prices back towards 1240. Only a break above 1260, if seen could be bullish with a possibility of rising towards 1280. For now, we remain cautious of a fall from here towards 1240.
2.60-2.65 is an immediate support on the Copper (2.6920) and is likely to hold in the medium term, pushing the price back towards 2.70/75. A break below 2.60, if seen would force us to consider lower levels.
Brent (55.19) and Nymex WTI (46.61) have broken below immediate supports mentioned near 56 and 48 and now, the crude prices look bearish towards 54-52 and 44-42 respectively. Brent looks bearish for the coming weeks on the longer term charts with small interim corrective upmoves. WTI on the other hand has important support at 46 as seen on the weekly candles and may bounce back from there.
FOREX
Currencies are overall ranged and could possibly remain so next week before we see a fresh infusion of volatility in the medium term.
Euro (1.1452) has risen sharply but could face immediate resistance at 1.15. Dollar Index (96.39) on the other hand has broken below 96.50 levels but could possibly recover from here back towards 97-98 in the near term. Considering strong resistance on the Euro at 1.15 and support near 96 on the Dollar Index, we look for a possible rise in the Dollar Index and a fall towards 1.13 on the Euro in the near term. Some more range trade within 1.13-1.15 and 96-98 is possible on the Euro and Dollar Index respectively.
Dollar Yen (111.22) has fallen in line with our expectation and has enough room on the downside towards 111.5-111.0-110.5in the medium term. View is bearish while below 112.5.
Although Euro-Yen (127.35) has near term support above 127, it is looking bearish just now and could fall towards 126 before again bouncing back from there.
Pound (1.2659) is bearish contained well above 1.255 and could see some small sideways range trade within 1.255-1.275 region just now. However, while the medium term resistance at 1.28 holds, view for Pound is bearish in the longer run.
Aussie (0.7116) is likely to test 0.710-0.705 in the near term before bouncing back from there. Long term weekly trend line is visible and seems to be a strong support which could eventually take the currency back to higher levels in the longer run.
Dollar Rupee (69.71) is likely to rise from previous low near 69.56 back towards 70.00/20, today. However, we continue to keep a close watch on Brent crude because if the crude price weakens during the day, Dollar Rupee may not be able to break or sustain above 70.20 today.
INTEREST RATES
Bit of a bounce in US yields yesterday, with the 2, 5, 10, 30 Yr at 2.67%, 2.67%, 2.80% and 3.04% respectively. The 5-2 Spread has come up to 0% again from -2bp earlier. The 10-5 Spread (13bp) has been dipping for the past few days, but is now testing a medium term Support. So, maybe there is some scope for some Curve steepening.
The 12mth US Libor (3.0528%) has been coming down from 3.13% in the beginning of the month. The 6mth Libor (2.87%) has been flattening while the 3mth (2.79%) and 1mth (2.48%) have continued to rise. we need to see if the 1 and 3 months start tapering off.
The 10Yr GOI (7.2581%) has recovered a bit from the 7.22% low, and might move up some more, given that the Indo-US 10Yr Spread has come to a Support and can move up.
USD/JPY Nosedives Below 112.00, US GDP Next
Key Highlights
- The US Dollar declined heavily and broke the 112.00 support against the Japanese Yen.
- USD/JPY failed to break the 113.80-114.00 resistance zone and declined sharply.
- The US Initial Jobless Claims for the week ending Dec 15, 2018 increased from 206K to 214K.
- Today, the US Gross Domestic Product for Q3 2018 will be released, which is forecasted to grow 3.5%.
USDJPY Technical Analysis
This past week, the US Dollar failed to clear a crucial resistance near the 113.80-114.00 zone against the Japanese Yen. The USD/JPY pair started a major decline and broke the 113.00 and 112.00 supports.
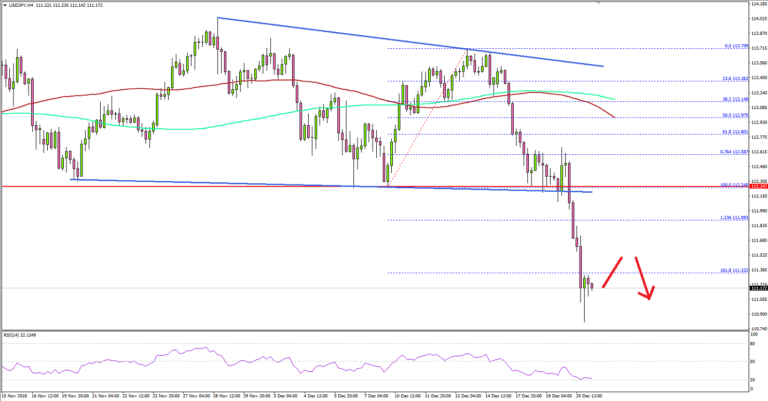
Looking at the 4-hours chart, the pair weakened a lot and settled below the key 112.20 support. During the decline, the pair broke a connecting support trend line at 112.18 and traded below the 1.236 Fib extension level of the last wave from the 112.24 low to 113.70 high at 111.89.
There was even a close below the 112.00 level and the 100 simple moving average (4-hours). It cleared the path for more declines and the pair accelerated towards the 111.00 level.
An immediate support is near 110.40 and the 2.618 Fib extension level of the last wave from the 112.24 low to 113.70 high. If there is a break below 110.40 and 110.00, the pair may extend losses towards 109.50.
On the upside, the previous key supports at 112.00 and 112.20 are likely to act as a strong barriers if the pair starts a recovery in the near term.
Fundamentally, the US Initial Jobless Claims figure for the week ending Dec 15, 2018 was released by the US Department of Labor. The market was looking for an increase from the last reading of 206K to 216K.
The result was better than the forecast since the US Initial Jobless Claims increased only 8K from 206K to 214K. The report stated that:
The 4-week moving average was 222,000, a decrease of 2,750 from the previous week’s unrevised average of 224,750.
Overall, USD/JPY moved into a bearish zone below 112.00 and it may continue to trade lower in the short term. On the other hand, major pairs like EUR/USD and GBP/USD recovered nicely, but today’s GDP report in the US could impact the market sentiment for the greenback.
Economic Releases to Watch Today
- UK GDP for Q3 2018 (QoQ) – Forecast +0.6%, versus +0.6% previous.
- US Durable Goods Orders for Nov 2018 – Forecast +1.6% versus -4.4% previous.
- US Gross Domestic Product Q3 2018 – Forecast 3.5% versus previous 3.5%.
- US Personal Income for Nov 2018 (MoM) – Forecast +0.3%, versus +0.5% previous.
Markets Trend Every Which Way But Up
Markets trend every which way but up.
Its been another frightening session for investors across a multitude of asset classes with some issues coming to a head as markets deal with year-end dwindling liquidity.
US bond yields are falling the S&P plummets amid a year-end washout in Global equities and risk. While in FX we’re seeing the USD struggling across the board after USDJPY moved sizably lower leaving the critical 112 level in its rear-view mirror as the currency traders are experiencing a post-Fed case of ” irritable Powell syndrome “Markets have continued to whipsaw throughout both the London and New York session as traders debated everything from policy error to Christmas dinner. But given the choppy nature of the market, I suspect most trader still have their finger in the wind.
Also, in his never-ending battle to get his wall built, President Trump is still threatening to Shutdown Government adding to an abundance of concerns weighing on equity sentiment.
And then to remind us we’re on the cusp of entering the next stage of the Trump administration’s China strategy where tension will spill over into both familiar and unfamiliar areas. The US charged two Chinese nationals for allegedly participating in a global hacking campaign to steal technology secrets, intellectual property, and the personal data of over 100000 Navy members, under their new ” anti-espionage war ” against China.
Oil markets
WTI made another leg lower, overnight as Oil prices are getting caught up the risk off the vortex. The ” herky-jerky ” moves are getting exaggerated by immensely thin liquidity conditions, risk sentiment, and holiday market participation. I expect this to continue into year-end. To say things are a bit negative out here, could be a significant understatement which is getting compounded by OPEC’seemingly rudderlessss efforts in these in these turbulent waters which continues to underscore the fact that the latest production cuts are not sufficient to right the ship.
Still, note that Reuters has seen an OPEC document that suggests the organisation plans to publish voluntary country quotes on the oil output cut deal reached earlier this month. Importantly, the effective oil output cut for members is 3.02%, which is higher than the initially discussed 2.5%.
Currency markets
While this equity sell-off could be little more than a liquidity event, there are more obvious moves in FX markets as exceptionalism around the US markets Teflon persona seems to be steering the bus right now. No longer are US equity market the sure bet.
The move higher USD/JPY this year was accompanies by a rise in Japanese equity outflows, which have primarily gone to US stocks and with USDJPY plummeting the first instances of repatriation flow are starting to kick in. And given Japanese managers are still long USDJPY given the staggering amount of US securities Japanese insurers own (reported over USD500bn to be in USD-denominated assets). All the while reducing their hedge ratios on USD assets by 5%, bringing USD hedge ratios down to a fresh post-crisis low of 48%, we could see more currency hedges triggered or repatriation flows if the USDJPY falls further, which will have far-reaching implication across G-10 and EM currencies
Eco Data 12/21/18
[php_everywhere instance="1"]
China Weekly Letter: Major Tax Cuts Coming – Trade Talks on Track
- A major tax cut to consumers and corporates is coming in 2019.
- 40-year anniversary of reform and opening-up marks reform path.
- US-China trade deal to be 'enforceable and verifiable'.
Major tax cuts coming in response to economic weakness
It is increasingly clear that China is preparing for a major tax cut in 2019 . A China Daily article this week with the title ' Major tax cuts are on the horizon ' speaks of a tax cut for households and corporates of more than 1% of GDP. On Tuesday, the annual Central Economic Work Conference will lay out economic policies for the coming year. An announcement on tax cuts and possibly new reform measures could come on the back of it.
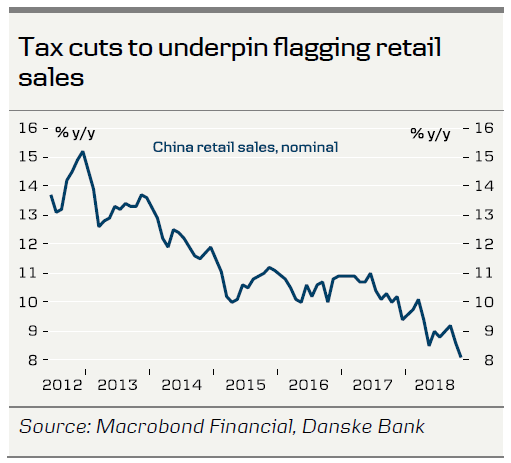
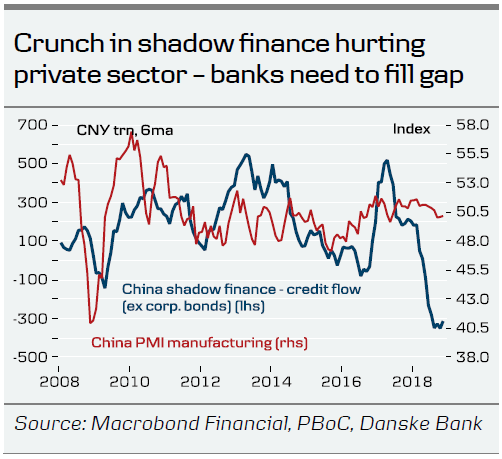
In a further effort to support for the private sector, on Tuesday the central bank, the People's Bank of China, announced a new facility to provide cheap medium-term funding for banks lending to smaller businesses. The rate will be 3.15% of loans up to three years to banks that support the real economy. It compares with a rate of 3.5% on a one-year money market rate. The private sector is smarting from a crunch in shadow finance, which needs to be filled by the banks (see chart).
Comment . A tax cut underpins growth and increases expectations that China will weather the storm and recover at some point in 2019. The tax cut will come on top of other stimulus measures this year such as cuts in the Reserve Requirement Ratio for banks, lending targets for the private sector and faster approval of infrastructure projects. Our main scenario is still that the Chinese economy will get worse before it gets better and that China will recover from around Q2 on the back of a trade deal with the US and stimulus kicking in. See China Outlook - short-term pain, long-term gain , 13 December 2018.
Celebration of 40-year anniversary of reform and opening-up
In a speech in celebration of the 40-year anniversary of China's reform and opening-up policy, Xi Jinping pledged that China will continue the policy path started in December 1978 . 'Opening up brings progress while closure leads to backwardness', he said. However, he also stressed that China would reform in its own way. 'There is no textbook of golden rules to follow for reform and development in China, a country with over 5,000 years of civilization and more than 1.3bn people...no-one is in a position to dictate to the Chinese people what should or should not be done' (see People's Daily, 19 December 2018).
At the celebration, the leadership awarded 100 Chinese citizens medals of reform pioneers. Among the recipients were Jack Ma and Pony Ma , founders of China's two tech giants Alibaba and Tencent. Former World Bank Chief Economist Justin Yifu Lin also received a medal. Lin is still an advisor to the Chinese government and this week was one of several Chinese economists to urge China to step up reforms to offset the trade war impact. See South China Morning Post , 16 December.
Comment. Xi's speech mostly repeated previous pledges to continue reforms and opening-up and did not bring much new. There had been some hope that the speech would provide specific reform measures but this was not the case. However, in general, we believe China's reform efforts are better than its reputation. On 31 October, the Doing Business Report by the World Bank showed that China had jumped 30 places up the list and was the no. 3 country to have made the most reforms to improve the business climate for small and medium enterprises. An illustration of the improving business climate is that around 15,000 private companies have opened annually (more than 10 per hour) in recent years. Still, we also see plenty of room for China to reform further and current headwinds should be used to speed up reforms further.
Trade talks in January – deal to be 'enforceable and verifiable'
US Treasury Secretary Stephen Mnuchin stated this week that the two sides are talking on a Vice Ministerial level and are planning face-to-face meetings in January. See Bloomberg: China and U.S. Talk on Trade Ahead of January Negotiations and SCMP: US and China trade negotiators will sit down in January, 18 December. He also revealed that the US and China have agreed that any eventual deal would have to be 'enforceable and verifiable and have specific dates on it'.
At a two-year review of US trade policy, China and the EU lambasted the US over its break of WTO rules (see Reuters, 17 December). 'The multilateral trading system is in a deep crisis and the United States is at its epicentre', said EU Ambassador Mark Vanheukelen. However, US trade ambassador blamed China for pursuing 'non-market industrial policies and other non-market competitive practices'.
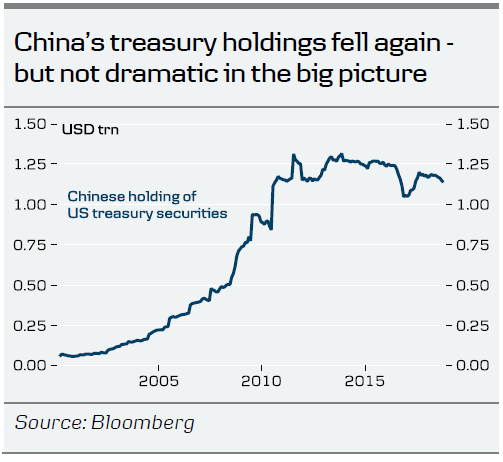
US treasury holdings declined in October for the fifth consecutive month raising questions marks over whether this was a deliberate move as part of the trade war. See China Daily: China remains largest foreign buyer of US Treasury bonds in Oct, 18 December.
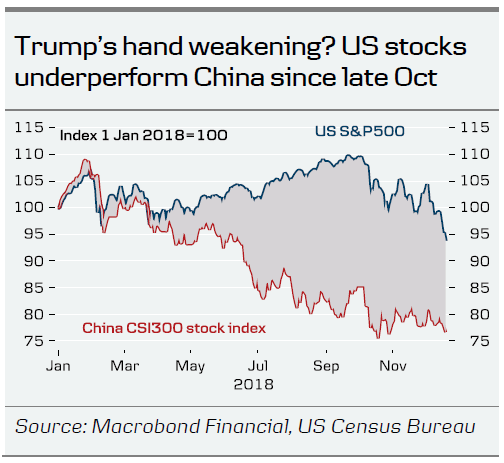
Comment. The US and China seem to be in agreement that the arrest of the Huawei CFO recently should be kept separately. We expect negotiations to continue and still look for a deal within the next three-six months. Trump's hand has weakened further recently as US markets have started to underperform Chinese equities (top chart). There will be a battle over the reform of WTO but this is also likely to be kept separately. The decline in treasury holdings is not dramatic (see chart) and is probably related to China's intervention this year to keep the CNY from weakening too much (requires selling of USD reserves to buy CNY).
Other China news
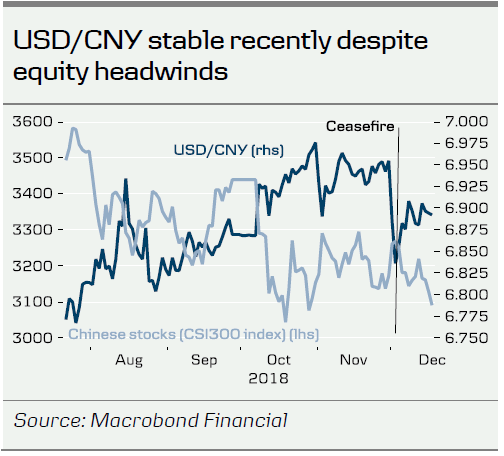
Revision to our USD/CNY forecast. We no longer look for USD/CNY to rise above 7 in 12M as we now expect a trade deal to include a commitment from China to stop CNY depreciation. We now look for USD/CNY at 6.80 in 12M.
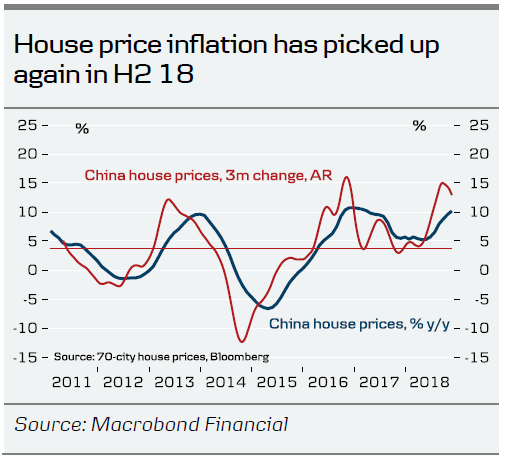
House price inflation still robust. Prices on residential property increased 10.3% y/y in October (see bottom chart). Housing is one of the pillars benefiting from the decline in bond yields and giving support to the otherwise weak economy.
Bankruptcies surge in China (see Bloomberg, 16 December). This is an effect of the shadow banking squeeze but also a change in policy to let more companies go bankrupt to avoid moral hazard. Therefore, it is an effort to clean up and discipline the financial sector.
Boeing opened its first factory in China (see Reuters, 15 December). China is expected to overtake the US as the world's largest aviation market over the next decade.
Germany tightens rules for foreign investment in a move aimed at China (see Reuters, 16 December).
Weekly Focus – ‘Santa’ Powell and Ingves Bring Hikes for Christmas
Market movers
- As the holiday season is just around the corner, market movers will be limited. However, if the US Congress and President Trump do not reach an agreement on the budget, we may have a government shutdown starting on Saturday 22 December.
- The next data point on the agenda is the US jobs report due out on 4 January, where we expect 190,000 new jobs. More importantly, we estimate average hourly earnings rose +0.25% m/m in December (equivalent to 2.9% y/y).
- Similarly, 4 January is the next focal point in the euro area as the inflation report is due out. We expect headline to remain at 1.9%, but core inflation to tick up to 1.1%.
- We expect little news on the Brexit turmoil and US-China trade war during the holiday season.
Weekly wrap-up
- Both the Fed and Riksbank hiked policy rates and lowered their projected rate paths.
- The Italian government struck a deal with the EU over the budget for 2019.
- The Brexit turmoil continues, with the next crucial date set to be during the week of 14 January, when the House of Commons is due to vote on the Brexit deal.
- Global risk sentiment remains fragile. In FX markets, EUR/USD has edged higher amid softer Fed pricing and declining political risk premia in Europe..
Elliott Wave Analysis: EURCAD at Interesting Levels; More Weakness in View
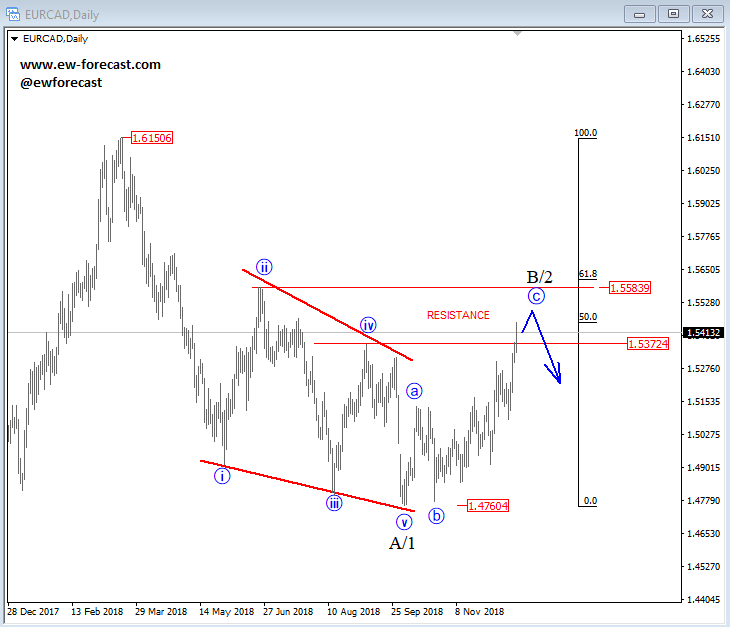
Let's take a look at daily chart of EURCAD. What we see is a leading diagonal into wave A/1 from highs and a current recovery since the beginning of October definitely looks slow and corrective. But, the most important part is that price can be approaching strong resistance area between 50% and 61,8% Fibo. retracement and 1.54 – 1.56 levels. So, we should be aware of a decline soon, especially if Crude oil finds support. If we are correct, then this could prove to be a very nice bearish setup for the upcoming months.
EURCAD, Daily