Sample Category Title
Australia employment grew 37k, but full time jobs dropped -6.4k
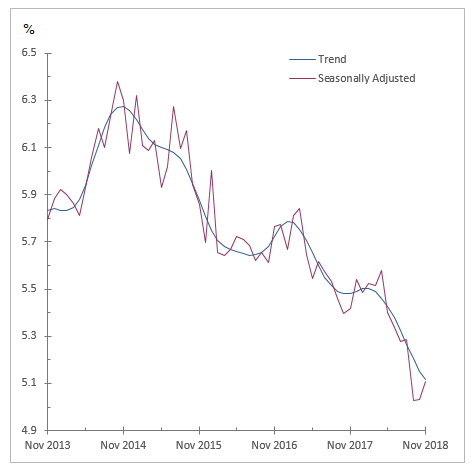
Australian employment market grew 37.0k, seasonally adjusted, in November, much better than expectation of 20.0k. However, the growth was mainly driven by part-time jobs, which rose 43.4k. Full-time employment has indeed dropped -6.4k. Unemployment rate also rose 0.1% to 5.1%, above expectation of 5.0%. Participation rate rose 0.2% to 65.7%.
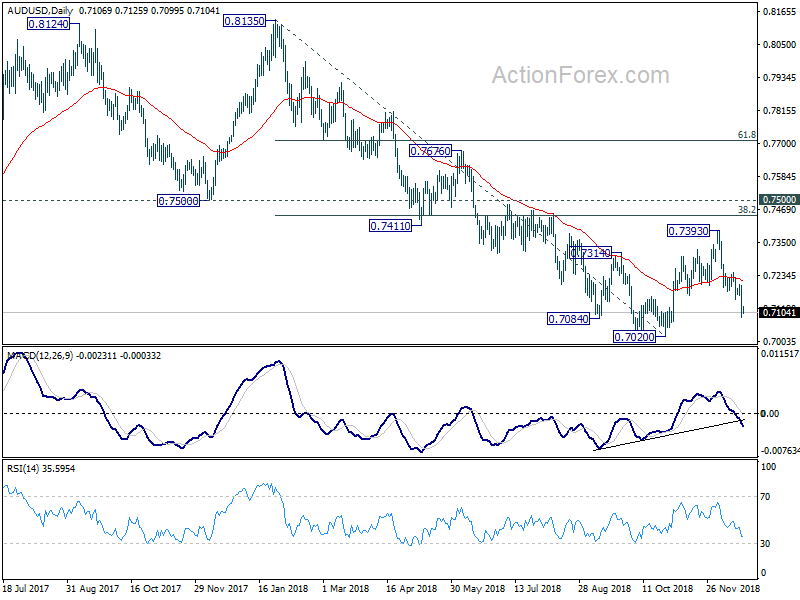
The set of data provided no support to Australian Dollar. Risk aversion is a factor weighing down the Aussie. Also, it's sold off against Dollar on less dovish than expected Fed, and against Euro in Italy-EU budget deal. AUD/USD's fall from 0.7393 is on track to retest 0.7020 low.
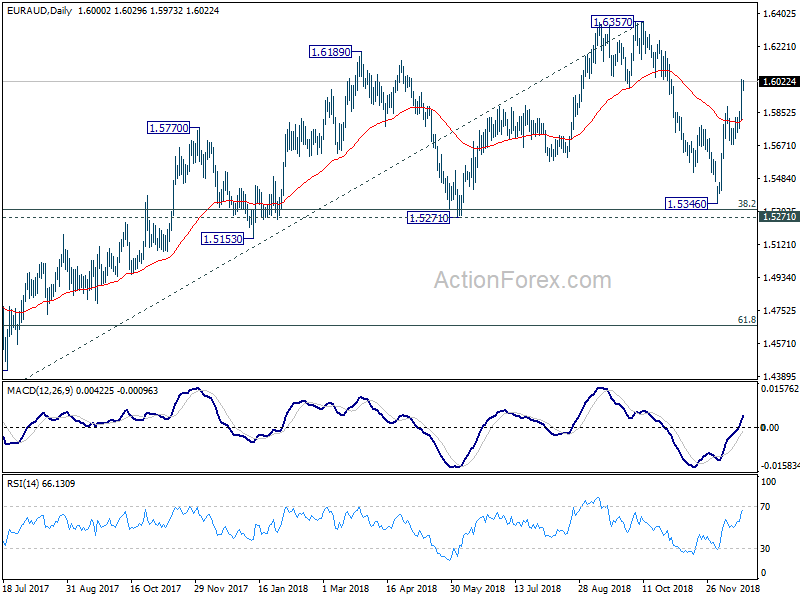
EUR/AUD is also on track for retesting 1.6357 high.
New Zealand GDP grew only 0.3%, sharp contraction in construction and manufacturing
New Zealand Dollar drops sharply today after big miss in GDP data. GDP grew 0.3% qoq in Q3, sharp slow down from Q2's 1.0% qoq and missed expectation of 0.6% qoq. Deep contraction is seen in both construction and manufacturing. Construction fell -0.8%, driven by a decrease in heavy and civil construction. Manufacturing dropped -0.8% "with 6 of 9 manufacturing industries declining." Services growth also eased to 0.5%, slowest rate of growth in six years. Also from New Zealand, trade deficit shrank to NZD -861M in November.
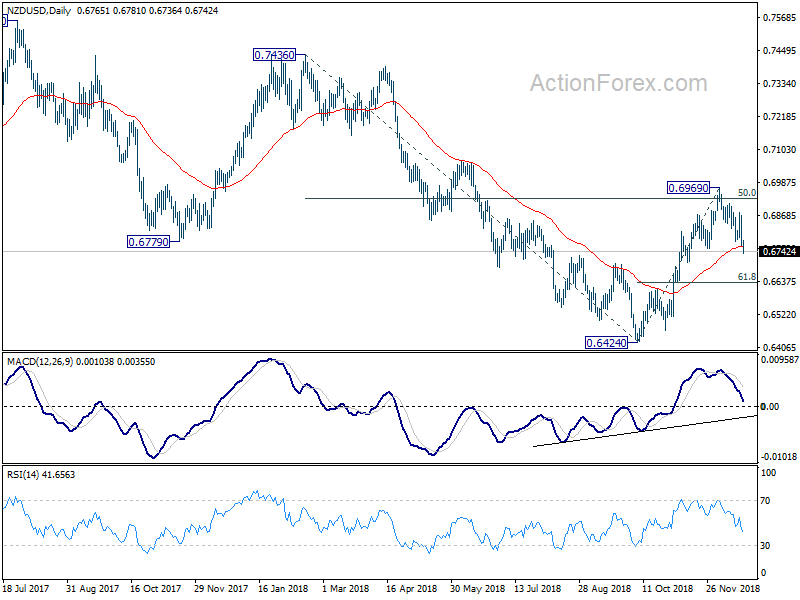
NZD/USD's recovery this week proved to be rather short-lived. Fall from 0.6969 resumed and reached as low as 0.6736 so far. Such decline is expected to extend to 61.8% retracement of 0.6424 to 0.6969 at 0.6632. For now, we'd expect strong support from there to bring rebound. Price actions from 0.6424 medium term bottom would develop into a consolidative pattern that lasts for a while.
Oil Fundamentals Remain Fragile Despite OPEC+ Cut. Saudi’s Over-Optimistic Budget Reinforces Oversupply Worries
The deal made by OPEC+ to cut output had only limited boost the oil prices. The renewed selloff in crude oil prices, indicating another leg of downturn, is driven by concerns over global growth slowdown, decline in stock markets and Saudi Arabia's budget plan. US' weekly report showed less-than-expected withdrawal in crude oil inventory while production stayed at record high. The fundamentals point towards dismal price outlook for the coming year.
New OPEC+ Deal
The majority of OPEC members and several non-OPEC producers has agreed on December 7 to reduce the overall production by 1.2M bpd (from October's output), effective as of January 2019 for an initial period of 6 months. On aggregate, OPEC would be responsible for 0.8M bpd of the cut while non- OPEC participating countries would be responsible for the remaining -0.4M bpd. In the OPEC camp, Saudi Arabia would take up the most reduction, prone to reduce its output by -0.28M bpd. For non-OPC participants, Russia would reduce its output by -0.23M bpd, to around 11.17M bpd from October's post-Soviet high of 11.4M bpd.
While this marks a 1.2M bpd reduction for the entire OPEC+ group from October. The effective cut from November levels indicates that the actual reduction would be near -1.5M bpd, as OPEC’s November production was higher than October’s
Saudi Arabia's Budget Plan
At the budget plan for 2019, the Kingdom estimates that its oil revenue would rise to $177B, up +9% from this year. The projection sounds aggressive amidst production cut and weak oil prices. According to the December agreement, Saudi's new production quota would be about 10.36M bpd in the first 6 months of next year. If it sticks to the quota, the Kingdom would need oil price to average at about $80/bbl (Brent crude) next year. This is roughly +10% above consensus forecast of $73/bbl. Should the Kingdom insist to achieve this revenue target at lower oil prices, it would increase production, a scenario detrimental to oil price outlook.
US Oil Inventory
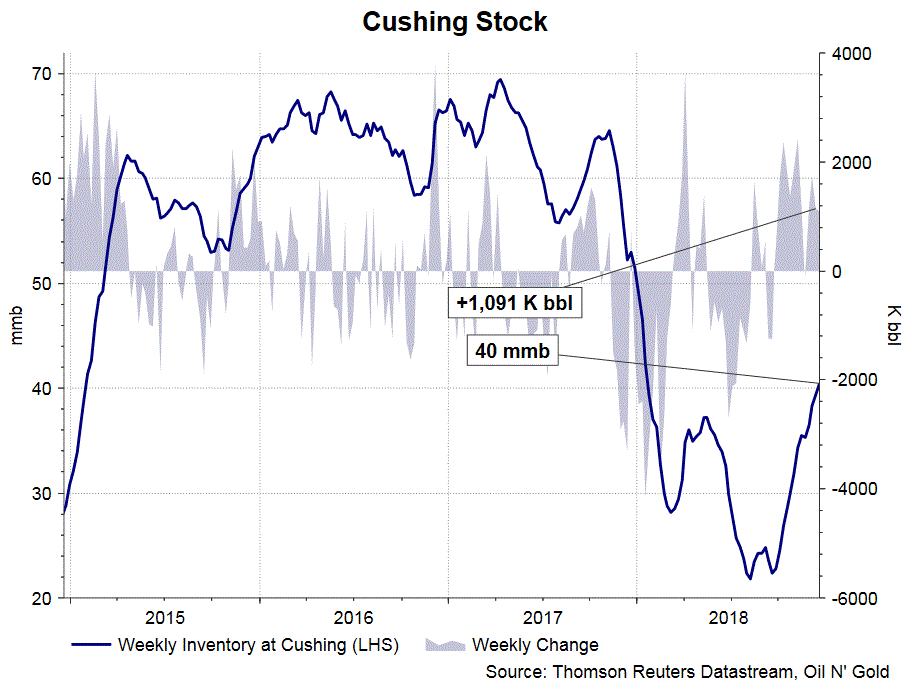
The report from the US Energy Information Administration (EIA) shows that total crude oil and petroleum products stocks dropped -10.32 mmb to 1229.59 mmb in the week ended December 14. Crude oil inventory dropped -0.5 mmb (consensus: -2.44 mmb) to 441.46 mmb. Inventories decreased in 3 out of of 5 PADDs. Meanwhile, Cushing stock added +1.09 mmb to 40.49 mmb. Utilization rate climbed higher, by +0.3% to 95.4% and crude production steadied at 11.6M bpd for the week.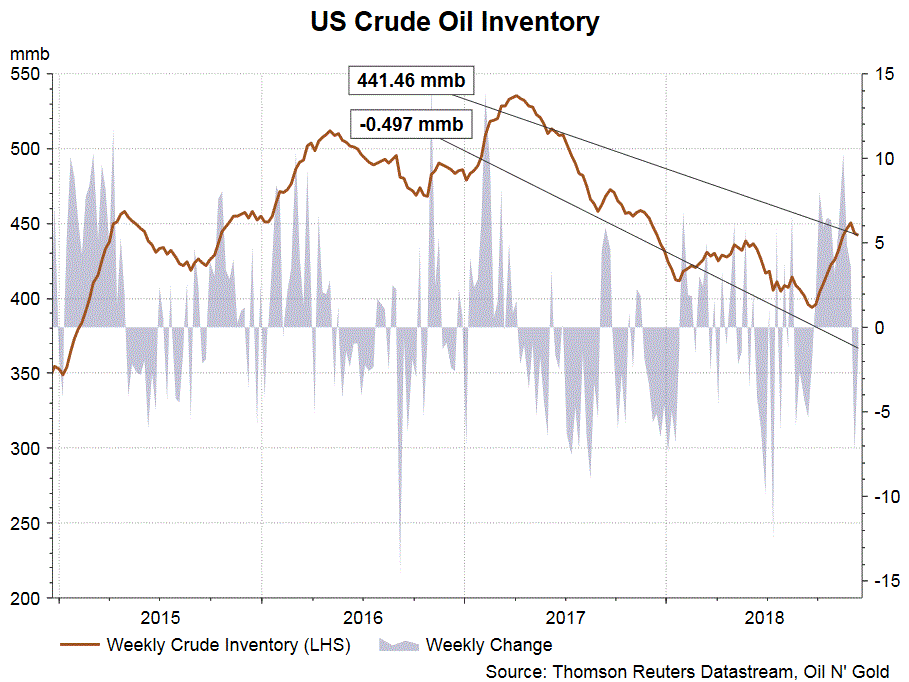
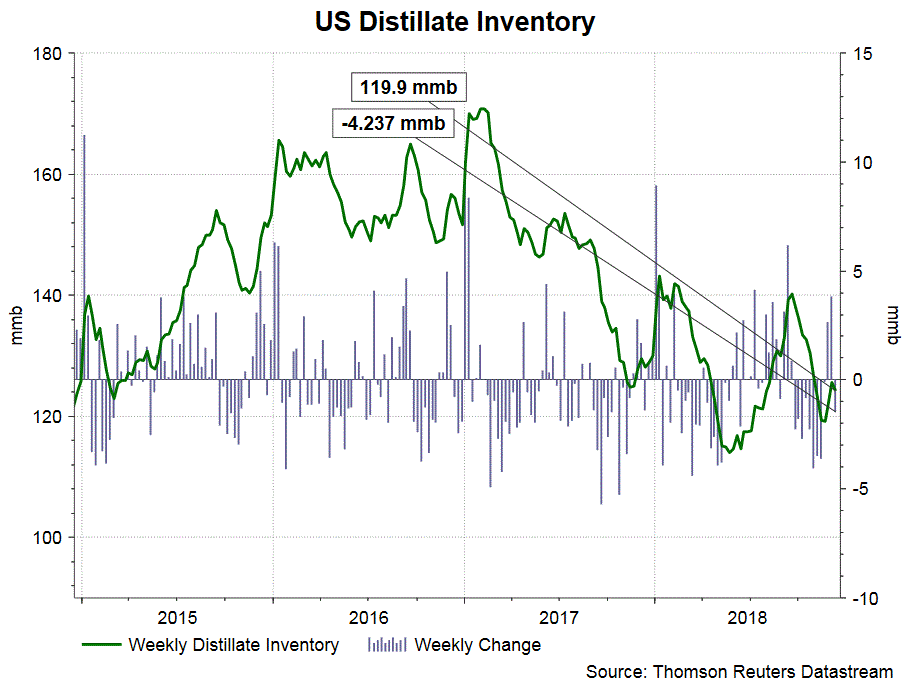
 Concerning refined oil product inventories, gasoline inventory added +1.77 mmb to 230.1 mmb although demand gained +2.29% to 9.24M bpd. The market had anticipated a +1.2 mmb increase in stockpile. Production slipped -1.18% to 9.24M bpd while imports jumped +13.33% to 0.6M bpd during the week. Distillate inventory declined -4.24 mmb to 119.9 mmb as demand soared +9.33% to 4.89M bpd. The market had anticipated a +0.57 mmb gain in inventory. Production dropped -2.74% to 5.39M bpd while imports were down -3.47% to 0.14M bpd during the week.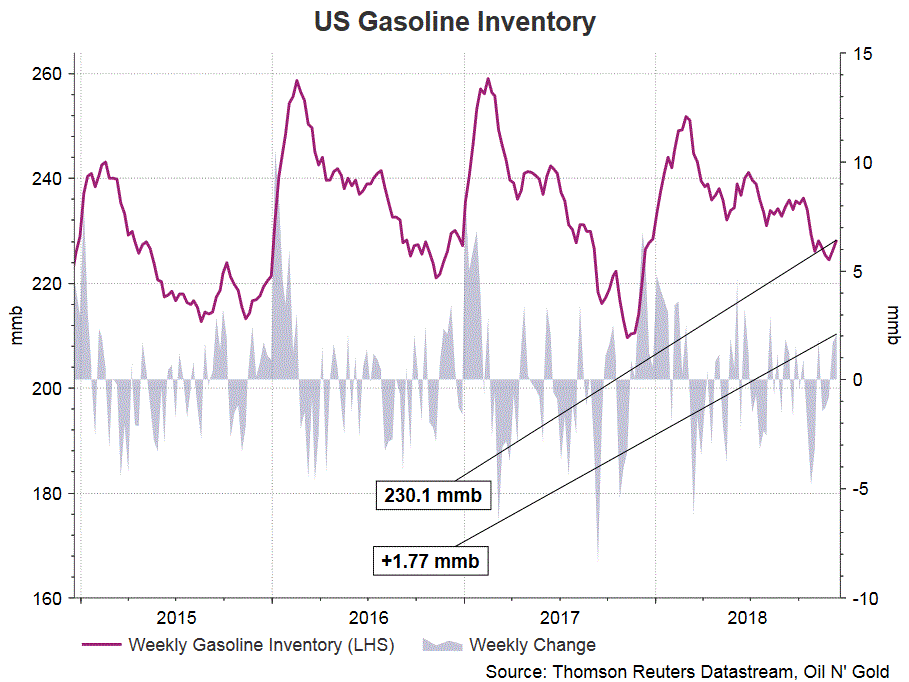
Released after market close on Wednesday, the industry- sponsored API estimated that crude oil inventory soared +3.5 mmb during the week. For refined oil products, gasoline stockpile gained +1.8 mmb while distillate was down -3.4 mmb.
Stocks tumble, yield curve flattens as Fed is not dovish enough
US stocks tumbled sharply overnight, together with bond yields as markets saw Fed's dovish turn as being not dovish enough. Dollar also rebounded. At least, Fed isn't pausing yet after yesterday's rate hike. In particular, Fed maintained in the statement that "some further gradual increases" in federal funds rate will be consistent with sustaining the expansion and keeping inflation near target. Fed Chair Jerome Powell, while admitting that global growth is "softening", also said "policy does not need to be accommodative" as the US economy continues to perform well.
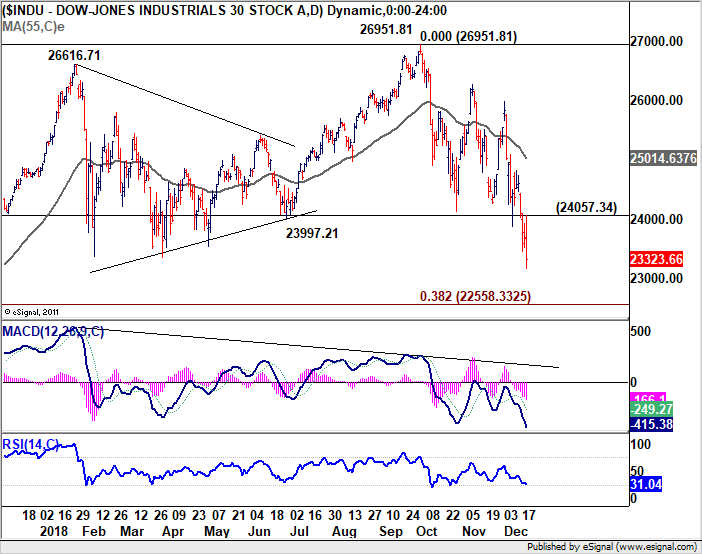
After initial recovery, DOW resumed recent decline and hit as low as 23162.64 before closing at 23323.66, down -1.49%. S&P 500 dropped -1.54% while NASDAQ dropped -2.17%. As long as 24057.34 resistance holds, the medium term corrective fall from 26951.81 will extend to 38.2% of 15450.56 (2016 low) to 26951.81 (2018 high) at 22558.33 before completion.
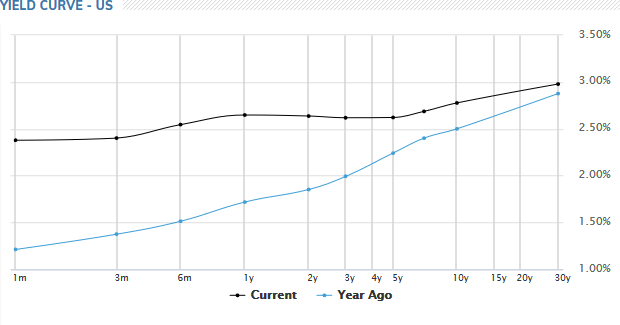
US treasury yields tumbled sharply, specially at the long end. 10-year yield dropped -0.047 to 2.778. 30-year yield dropped -0.064 to 3.015, and it's now risking 3% handle. More importantly, yield curve flattened further and it's now inverted from 1-year (2.648) to 5-year (2.622).
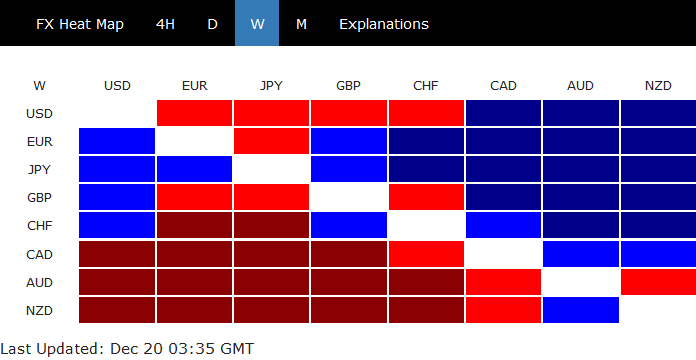
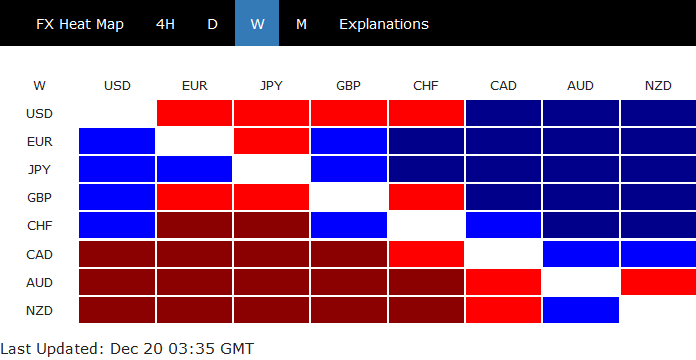
Dollar is so far mixed for the week, up versus commodity currencies by down against others.
Market Morning Briefing: Pound Is Bearish While Below 1.27
STOCKS
Ugh! Huge volatility in the Dow. Closed at 23323.66 (below the crucial 23500), giving up on an intra-day high of 24057.34. The intra-day low was 23162.64. This forces us to look for downside targets now, with 23500 becoming a crucial Resistance now, but we are unable to figure out a downside target yet.
The Fed did raise rates by 25bp last night, and did reduce its dot-plot to 2 hikes in 2019 from the earlier 3 hikes, but the market might have been wanting to see 1.
Asian markets have reacted negatively. The Nikkei (20747) continues to decline, targeting 20000-19500. Immediate Support might be at 20400. The Shanghai (2531, -0.73%) is also bearish. Break below 2525 would open up 2450.
Even the DAX (10766.21, +25.32, +0.24%), which managed a meagre gain yesterday is likely to start falling again, targeting 10500-400.
The Nifty (10967.30, +58.60, +0.54%) had closed higher yesterday, but is reported to be trading lower near 10897 on the SGX today, below the crucial 10925 level. This is in line with our reading yesterday that, "If the global environment does not improve after the FOMC today, there could be a danger of the Nifty succumbing to bearishness as well."
COMMODITIES
Markets interpret the FOMC statement as "not so dovish" although the expected rate hike of 25bps was made. Worry of slower economic growth in 2019 looms as the Fed mentioned that they would continue to shrink their balance sheet which could be a problem for economic growth according to some economists.
Overall the commodity prices tanked after the FOMC statement and Powell's press conference before recovering slightly.
Gold (1248.40) tested the expected resistance near 1262 before coming off sharply to current levels of 1248. While 1265/70 holds, Gold could fall further towards 1239-1230 in the near term before again bouncing back from there.
Silver (14.65) is almost stable trading near the upper end of the sideways range of 13.80-15.00. A sharp fall could be expected soon while 15 holds, targeting 14.25-14.00 again.
Copper (2.6765) fell sharply but has support at 2.67 as seen on the 3-day candles. While above 2.65/67, there is scope for a bounce back towards 2.80-2.90 levels in the longer run; else a fall below 2.65 if seen and sustains, could initiate fresh weakness towards 2.50.
Brent (56.55) and Nymex WTI (47.35) did saw a rise towards 58 and 48 respectively but is trading lower today. While they trade below 56.50 and 48, bearishness could be on the cards towards 54-52 and 44-42 in the near term. Some stability could be seen over the next 1-2 sessions. On the WTI 3-day line chart, current level is an important support which if holds could produce a bounce in the near term.
Gold-WTI ratio (26.38) has come off from immediate resistance near 27 and while that holds, it could be bearish towards 25 indicating a fall in Gold and a possible range trade in Crude prices.
FOREX
The FED statement triggered a rise in Dollar index (97.02) to levels above 97 from an intra-day low of 96.55. The narrow contraction in the 96.75-97.30 region is still intact. A few more sessions could see trade within the mentioned range before a sharp break is seen preferably on the downside.
Euro (1.1380) is trading within 1.13-1.12 region and has scope of extending to 1.14 or 1.11 on either side. Immediate view could be a rise towards 1.14 before coming off from there towards 1.12/11.
Dollar Yen (112.43) rose back after testing 112. Note that 112 could provide an immediate support which if holds could lead to a rise back towards 113-114 levels; else a break below 112 could take it down towards 111.50-111.00 in the near term. On the longer term charts, view is bearish after a near term stable movement within 112-115.
Euro-Yen (127.97) has immediate support near 127.0-127.5 and while that holds there is some possibility of a range trade above 127 for a couple of sessions. There is also some possibility of breaking below 127 but that could be seen next week, if 127 fails to produce a bounce back towards 128 or higher.
Pound (1.2617) is bearish while below 1.27. A re-test of 1.2486-1.25 looks possible in the near term.
Aussie (0.7101) has support at 0.71 and further down at 0.7050. Although the currency saw a sharp fall yesterday, there is chance of recovery while the immediate supports hold.
Dollar Rupee (70.40), having tested 69.8450 on the downside closed higher yesterday. A rise back towards 70.60/80 is likely today extending gradually towards 71 in the near term.
INTEREST RATES
After the FOMC disappointed the markets last night, US Yields have fallen at the Far end and the Curve has flattened instead of steepening. The 2Yr (2.66%) has gone up from 2.65%, while the 5Yr has dipped to 2.64%, effectively inverting the 5-2 Spread again to -2bp.
The 10Yr (2.77%) has come down from 2.81% and the 30Yr (2.99%) has come down sharply from 3.06%, both possibly breaking below long-term support trendlines coming up from 2016.
The Indo-US 10Yr Spread (4.45%) is quoting below 4.49%, the support mentioned yesterday. But it could see a bounce today, given the fall in US yields overnight, unless the Indian 10Yr GOI (7.22%), which closed below 7.25% yesterday, sees further decline today. We have to wait and see on that.
Highs And Lows NZ GDP
- GDP rose by 0.3% in the September quarter, less than forecast.
- The soft September result was partly payback for the 1% gain in June, which benefited from some one-off factors.
- Revisions to the historic GDP data reveal that the economy has retained more momentum than previously thought, with annual growth running at around 3%.
- Today's results don't alter our near-term outlook for the economy.
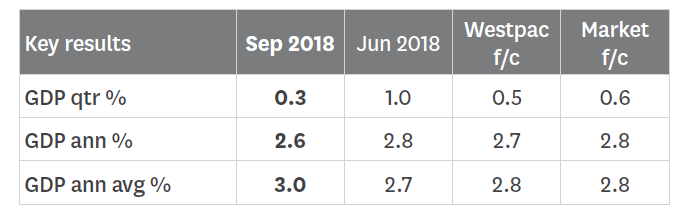
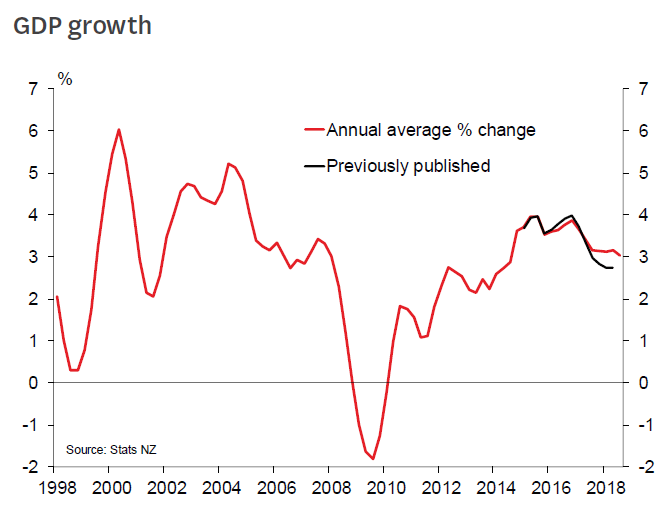
We were braced for some payback after the 1% surge in June quarter GDP, which was supported by some nonrepeating factors. As it turns out, the September quarter result was softer than anyone expected. GDP rose by just 0.3%, the smallest quarterly gain in almost five years. On a more positive note, Stats NZ's annual round of GDP revisions has once again painted a more upbeat picture of recent history. GDP growth was revised down slightly for 2016, but was revised up quite a bit over 2017. (It's worth noting that we highlighted the potential for both of these revisions as far back as our June Economic Overview.) The result is that the slowdown in growth over the last couple of years has been more modest than previously thought, and that the economy still has reasonable momentum, with growth tracking at around 3% a year.
On balance, though, it was still a disappointing GDP report, and the market reaction on the day is understandable – the New Zealand dollar is down about 20 points to 0.6780, and swap rates fell by about four basis points. Despite the upward revisions to historic GDP, the Reserve Bank will probably still conclude that the economy is not running as close to its full potential as expected, and that inflation pressures may be slower to build. Our view remains that the RBNZ will stay its course for a long time, with no hike in the OCR until late 2020.
Looking ahead, the details of today's report don't give us obvious cause to change our outlook. We continue to expect growth to pick up a little in 2019, supported by faster growth in government spending and a slightly more buoyant housing market. However, this pickup in growth is likely to be a short-lived one, with population growth slowing and the level of construction peaking.
Details
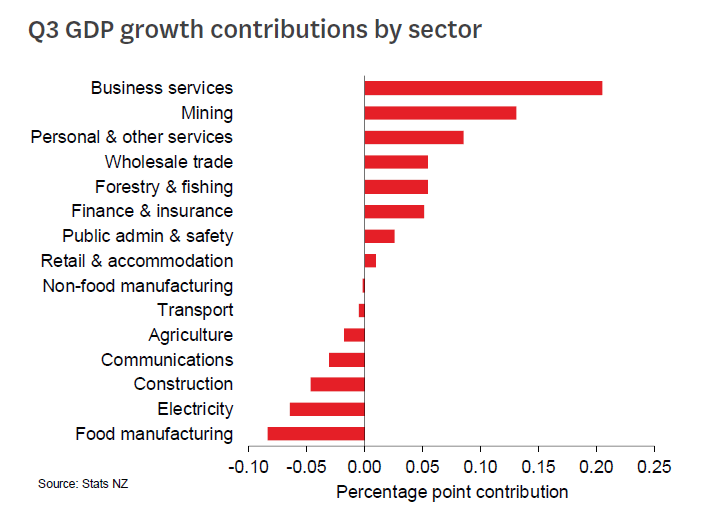
The production measure of GDP rose by 0.3% in the September quarter, compared to a 1.0% gain in June and a 0.9% rise in the same quarter a year ago. We were forecasting a 0.5% increase, while market forecasts were clustered around 0.5-0.6% and the Reserve Bank forecast a 0.7% rise in its November Monetary Policy Statement. As expected, some of the big positives in the June quarter proved to be one-offs. Agricultural output, and consequently food manufacturing, were down in seasonally adjusted terms, following an abnormally strong June quarter. Electricity generation was hit by both lower demand and low hydro lake levels. And tourist spending reversed after a sharp June quarter rise, which appears to have been felt most keenly in the hospitality sector.
On the positive side, there was continued solid growth in areas such as business services, forestry, wholesale trade and healthcare. Retail spending, outside of hospitality, saw a solid 0.8% gain.
Do the surprises relative to our forecast give us cause for concern about the near-term outlook? Again, it's likely that temporary factors are playing a role. One of the reasons for the shortfall in our forecast was that mining output didn't recover by as much as we assumed, reflecting ongoing disruptions at the Pohokura offshore oil field. But this simply means that the rebound will carry on into subsequent quarters.
Another weak point was construction. Housing and commercial construction rose as expected, but there was a sharp drop in non-building activity, for which there is very little data available. Roading repairs after the Kaikoura earthquake are now winding down; once they're complete, they won't be an ongoing drag on the pace of growth.
Central government services rose by 0.7% for the quarter. But we were expecting a substantially larger gain, given that government personnel spending – the main indicator for this sector – surged during the quarter. The implication is that much of the increase has been treated as nominal rather than real – that is, higher pay rates rather than more services provided.
The final surprise for us was a 0.9% decline in the IT and telecommunications sector. But this is a dynamic field where the level of activity is difficult to measure, and its growth is often only revealed in subsequent data revisions. The expenditure measure of GDP is more volatile and considered to be less reliable on a quarterly basis, but in this case was in line with our 0.5% forecast. Household spending grew by 1%, the same as in the previous quarter reinforcing the sense that the softness in the retail trade survey was due to lower spending by tourists rather than locals. The Government's Families Package came into effect at the start of the September quarter, and the extra money in many households' pockets is likely to have outweighed the rise in petrol prices.
Business investment in plant and machinery fell by 1.6% for the quarter, though it's still up almost 4% on a year earlier. Subsequent data on imports of machinery suggest that we'll see a pickup in investment in the December quarter. Exports were mixed, with a 2.2% rise in goods but a 4.2% fall in services. The latter followed a 4.4% gain in the June quarter, reflecting the volatility in tourist spending. Imports were flat for the quarter.
Our forecast for December quarter GDP growth remains at 0.8%. Consumers are becoming a little more confident as petrol prices have pulled back from their highs, business investment us looking stronger, mining output should continue to recover, and milk production is running ahead of recent years as it enters the peak of the season.
Australian Employment Holding a Solid Pace into Year End
November Labour Force Survey. Employment 37.0k, unemployment 5.1%, participation 65.7%
Employment was holding a solid pace into year-end with a robust 37.0k gain in November which was stronger than both consensus and Westpac’s forecast for 20k. In the year, total employment has grown 286.0k or 2.3% but the recent pulse in employment has lifted the six month annualise pace to 2.9%yr.
More surprising was the jump in the unemployment rate to 5.1% from 5.0% (market median was for 5.0%) due to a 0.2ppt lift in participation to 65.7% (65.69% at two decimal places) which drove a solid 49.5k gain in the labour force. It does appear there sample volatility had a role to play with the ABS noting that the incoming rotation group had a higher employment to population ratio than the group it replaced while the unemployment rate of the incoming rotation group was also higher than the whole sample and the group it replaced. Also the participation rate of the incoming group was higher than the group it replaced.
As such we would not define the November rise in unemployment as a softening in labour market conditions.
But what does suggest a softer tone for November was that all gains in employment were part-time (+43.9k) which was partially offset by a fall in full-time employment (–6.4k). Also on the soft side, hours worked fell –0.2% in the month. In the year to November total hours worked are up just 1.1%yr which is quite a bit softer than the 2.3%yr pace in total employment.
This month the gains were in Victoria (30.9k) and Queensland (21.8k) while NSW saw a –12.6k correction to the solid 20.2k in October.
More detailed analysis to follow shortly but this update on the labour market would give the RBA some comfort on how the Australian economy was tracking heading into the festive season.
FOMC to Continue With Hikes, but Mindful of Risks
Two-to-three additional rate hikes are forecast by the Committee. Risks however are growing in prominence.
Come their December meeting, the FOMC raised the benchmark federal funds rate by 25bps to a 2.25%–2.50% range. More important to the market however was the tone of the accompanying communications, which set the scene for 2019.
In the short decision statement, changes to the language around the economy were minimal. Data to hand indicates that the “labor market has continued to strengthen and that economic activity has been rising at a strong rate”. By sector, the FOMC’s description of the economy was also unrevised, with “Household spending [said to have] continued to grow strongly, while growth of business fixed investment has moderated from its rapid pace [of] earlier in the year”. To the extent that the consumer makes up 70% of the economy versus investment’s 14%, continued strength in the former offsets concern over the latter – particularly as the starting point for investment growth was abnormally high.
The Committee’s quantitative forecasts to 2021 further highlight their belief in the underlying strength of the US economy. Through 2018, 2019 and 2020 aggregate growth is expected to remain above potential of 1.75% at 3.0%; 2.3%; and 2.0% – only marginally below the forecasts of September (3.1%; 2.5% and 2.0%).
Despite this robust view of the US’ economy however, the focus on “global economic and financial developments” in both the risks section of the statement and, more notably, Chair Powell’s press conference makes clear that “cross-currents” are increasingly giving the Committee cause for caution.
On global growth, Chair Powell was clear in the press conference that the Committee believe momentum has turned and that there are downside risks to the outlook. Chair Powell’s comments on this matter were kept very broad, but presumably key points of tension for the Committee include Europe’s economic slowdown and political tensions (including Brexit), and continued emerging market weakness – a function of trade tensions, higher US dollar interest rates, and now declining commodity prices.
In part because of this loss of global momentum as well as concern over higher US dollar interest rates, financial market volatility has clearly risen in recent months and become a much greater concern for the Committee. Arguably this is because the Committee is worried that, should it intensify further, this volatility could shock confidence amongst US consumers and businesses, and consequently beget a materially weaker growth outcome. To be clear, financial volatility is not a concern in and of itself; how it affects the real economy is the focus. Here there can be considerable lags, and so the Committee will have to deal with lingering uncertainty.
In addition to the potential confidence effect of financial market volatility, the ‘cash-flow consequence’ of changes in financial conditions are also front of mind. Since the September meeting, declining equity prices and a higher US dollar have tightened conditions for both US businesses and households. On interest rates: Treasury yields rose for a time, but have now reversed; credit spreads have moved wider however, and LIBOR higher. Looking ahead, to the extent that the Committee still sees two-to-three more hikes in this cycle, one has to expect that both US market interest rates and the dollar will move higher in 2019, and presumably credit spreads could widen further. Financial conditions are then set to remain in focus.
The FOMC clearly remains positive on the health of the US economy. Should their core view prove prescient, then two-to-three more rate hikes will be warranted. That being said, with headline and core inflation seen at target over the forecast period, and given the above “cross-currents”, having now reached the bottom of the estimated neutral range of 2.5%–3.5%, the FOMC will be more cautious ahead. To our view of three hikes and that of the Committee, risks are therefore skewed to the downside.
USD/CAD Remains Well Supported On Dips
Key Highlights
- The US Dollar traded higher recently and broke the 1.3400 resistance against the Canadian Dollar.
- There is a major bullish trend line formed with support at 1.3420 on the 4-hours chart of USD/CAD.
- The Canadian CPI increased 1.7% in Nov 2018 (YoY), less than the forecast of 1.8%.
- Today, the US Initial Jobless Claims will be released, which is forecasted to increase from 206K to 216K.
USDCAD Technical Analysis
The US Dollar started a major bullish wave from the 1.3120 support against the Canadian Dollar. The USD/CAD pair traded above the 1.3400 resistance and it remains supported on dips if there is a downside correction.
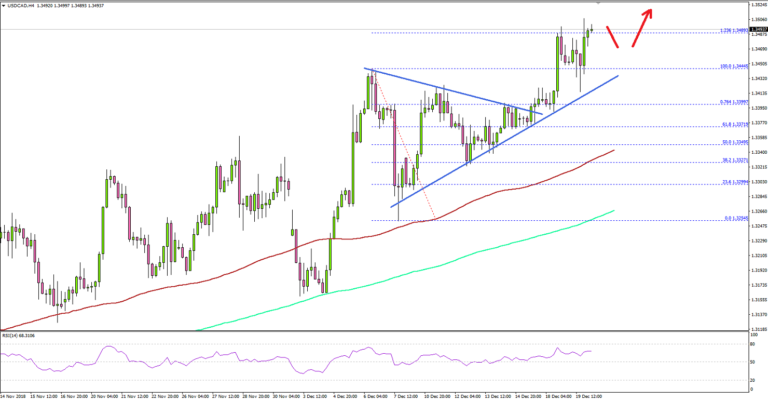
Looking at the 4-hours chart, the pair recently broke a connecting bearish trend line at 1.3390 and traded above 1.3440. It traded towards the 1.3500 level and tested the 1.236 Fib extension level of the last decline from the 1.3445 high to 1.3254 low.
On the upside, a proper break and close above 1.3500 could trigger more gains. The next stop for buyers could be 1.3560, which is near the 1.618 Fib extension level of the last decline from the 1.3445 high to 1.3254 low.
On the downside, there are many supports near the 1.3400 level. Moreover, there is a major bullish trend line formed with support at 1.3420 on the same chart. Should there be a break below 1.3400, the pair may test the 1.3340 support and the 100 simple moving average (4-hours).
Fundamentally, the Canadian CPI figure for Nov 2018 was released by the Statistics Canada. The market was looking for an increase of 1.8% in the CPI in Nov 2018 compared with the same month a year ago.
The result was lower than the forecast, as the CPI increased 1.7% in Nov 2018. The monthly change was -0.4%, similar to the forecast. The monthly Core CPI increased 0.1%, less than the last 0.3%. The report stated that:
Energy costs declined 1.3% compared with November 2017, following a year-over-year increase (+7.9%) in October. Gasoline prices fell 5.4% year over year, as declining global crude oil prices led to lower prices at the pump and the first 12-month decrease in the gasoline index since June 2017.
Overall, USD/CAD remains well supported on dips near 1.3400 and 1.3340, and it may continue to move higher in the near term.
Economic Releases to Watch Today
- UK Retail Sales for Nov 2018 (YoY) – Forecast +1.9%, versus +2.2% previous.
- UK Retail Sales for Nov 2018 (MoM) – Forecast -+0.3%, versus -0.5% previous.
- UK Retail Sales ex-fuel for Nov 2018 (YoY) – Forecast +2.3% versus +2.7% previous.
- BoE Interest Rate Decision – Forecast 0.75%, versus 0.75% previous.
- US Initial Jobless Claims – Forecast 216K, versus 206K previous.
- Canada’s ADP Employment Change Nov 2018 – Forecast -18.0K, versus -23.0K previous.
Where The Fed May Be Wrong
The financial markets shot down the notion that the Fed delivered a dovish rate hike at the December FOMC meeting. The yield curve flattened, the dollar strengthened and the stock market sold off sharply.
Caught Between A Rate Hike and A Hard Place
Recessions are typically triggered by policy mistakes and the Federal Reserve may very well be on the road to making one. The policy statement that accompanied the Fed's latest rate hike attempted to allay fears the Fed would tighten too much by acknowledging the economic outlook has diminished and that the balance of risks was now roughly even. FOMC participants also slightly lowered their expectations for the federal funds rate and now call for just two rate hikes in 2019 and one more after that, while the drawdown of the Fed's balance sheet is expected to remain on auto-pilot at $50 billion a month in 2019.
The financial markets provided some powerful real-time feedback to the Fed. Stocks had rallied just before the Fed's decision was released, gave back their gains after digesting the policy statement and then sold off heavily during Chairman Powell's testimony. The yield curve also flattened further and remains inverted between the two- and five-year notes. The markets shot down the Fed's dovish tightening because they feel economic growth may not be as strong as the Fed believes and is certainly not strong enough to hold to the notion that monetary policy, in its entirety, remains short of neutral.
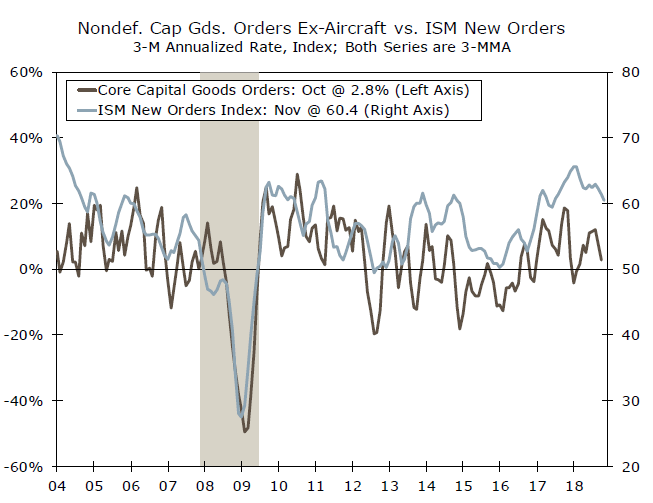
Economic growth may not be as 'strong' as the Fed believes. The strength in the U.S. economy has been narrowly focused, with the energy and technology booms accounting for a disproportionate share of economic growth. Both sectors now appear to be slowing, with the former struggling under the weight of sluggish global economic growth and lower oil prices, while the latter is facing an onslaught of government oversight concerning privacy concerns and anti-trust matters. Growth in the more cyclical parts of the economy is also slowing, with demand for home sales and capital goods flagging for the past few months.
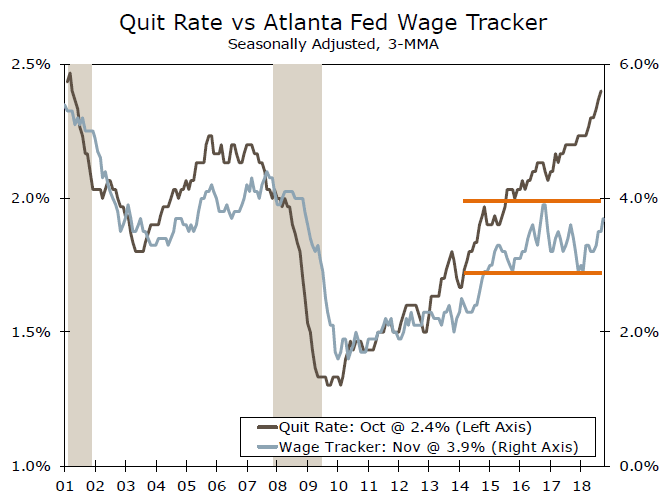
The Fed's confidence about the strength of the economy may be grounded in the satisfaction that the unemployment rate remains so low at just 3.7%. The unemployment rate is a lagging indicator, however, and monetary policy works with a long and variable lag. Moreover, the IT revolution and growth in online job search platforms have likely changed the way job seekers interact with the labor force. This may help explain why the surge in job openings has not led to a resurgence in wage increases.
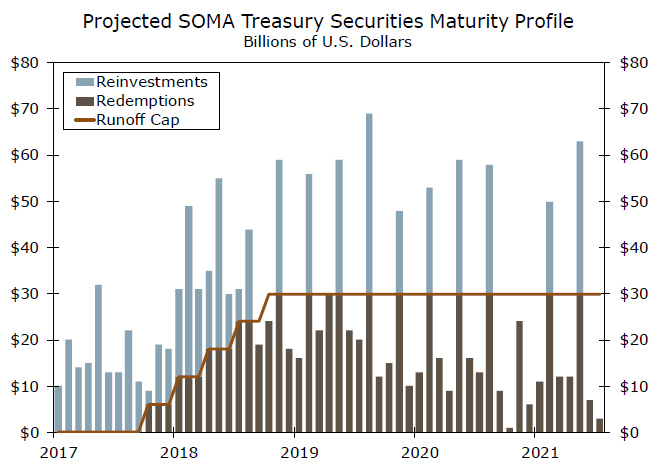
The Fed may also be underestimating the impact the drawdown of the Fed's balance sheet and continuation of enhanced forward guidance are having on global liquidity. Both policies were projected to have strong positive effects when they were implemented. Why wouldn't they have an equally strong impact now that they are headed in the other direction? Moreover, the high degree of certainty the Fed has displayed that these policies will continue, effectively on auto-pilot at a time that growth is decelerating, has sent a foggy message to the financial markets, which has likely increased uncertainty— hence the rush out of stocks and into bonds and the dollar.