Sample Category Title
USD/JPY Daily Outlook
Daily Pivots: (S1) 144.74; (P) 145.46; (R1) 146.11; More...
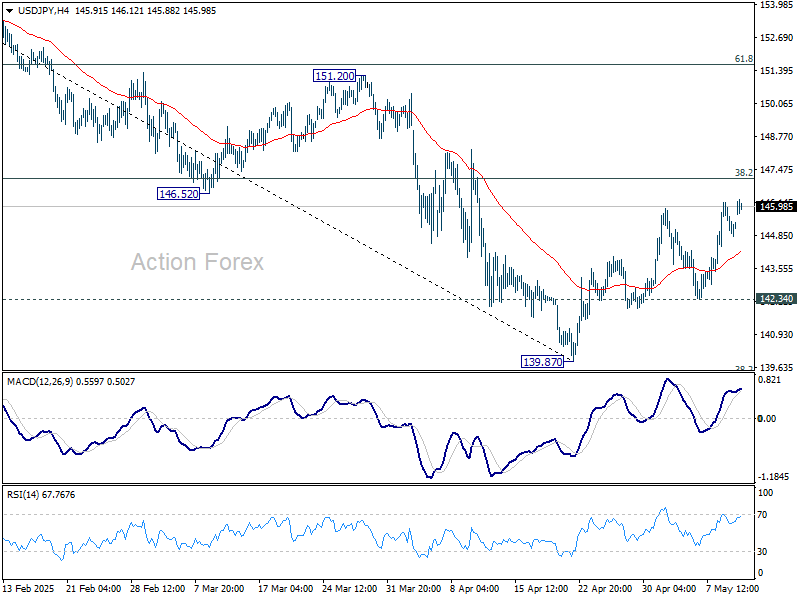
Intraday bias in USD/JPY remains mildly on the upside as rebound from 139.87 is in progress. Focus is on 38.2% retracement of 158.86 to 139.87 at 147.12. Rejection by 147.12 will retain near term bearishness. Break of 142.34 support will bring retest of 139.87. However, sustained break of 147.12 will indicate near term reversal, and target 61.8% retracement at 151.60.
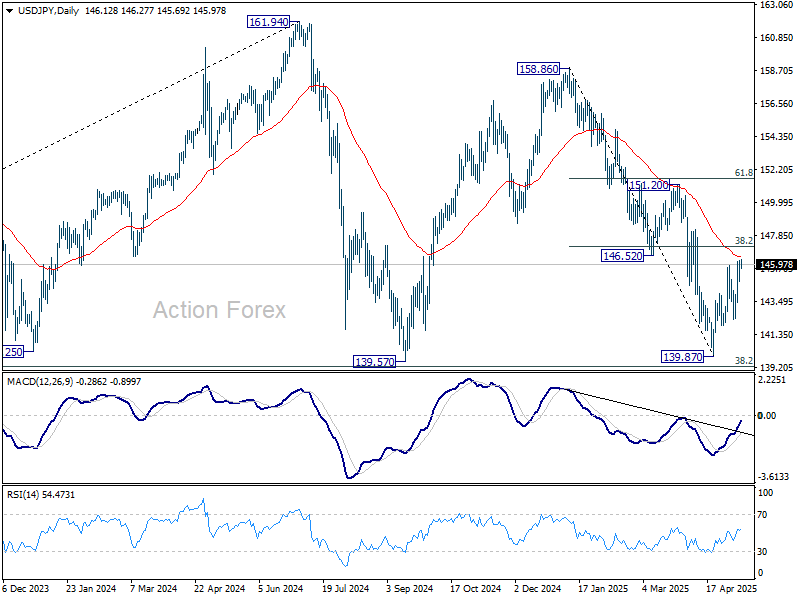
In the bigger picture, price actions from 161.94 are seen as a corrective pattern to rise from 102.58 (2021 low), with fall from 158.86 as the third leg. Strong support should be seen from 38.2% retracement of 102.58 to 161.94 at 139.26 to bring rebound. However, sustained break of 139.26 would open up deeper medium term decline to 61.8% retracement at 125.25.
USD/CHF Daily Outlook
Daily Pivots: (S1) 0.8192; (P) 0.8232; (R1) 0.8278; More….
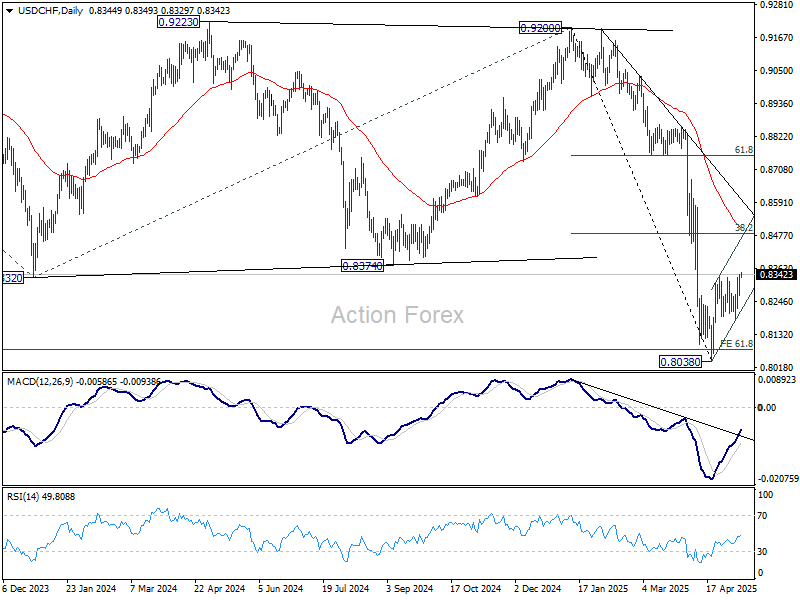
USD/CHF's breach of 0.8333 suggests that rebound from 0.8038 is resuming. Intraday bias is back on the upside for 38.2% retracement of 0.9200 to 0.8038 at 0.8482. But strong resistance should be seen there to limit upside. On the downside, firm break of 0.8184 support will argue that the corrective rise has completed, and bring retest of 0.8038.
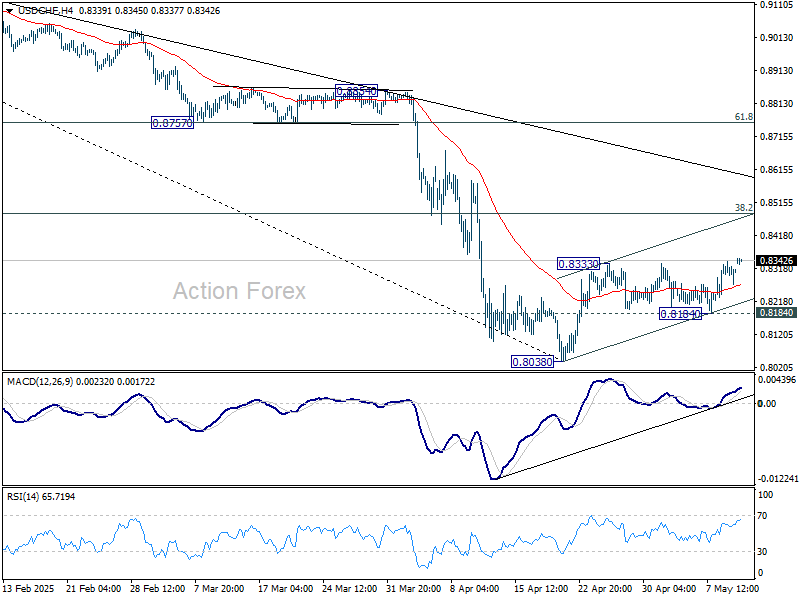
In the bigger picture, long term down trend from 1.0342 (2017 high) is still in progress and met 61.8% projection of 1.0146 (2022 high) to 0.8332 from 0.9200 at 0.8079 already. In any case, outlook will stay bearish as long as 55 W EMA (now at 0.8750) holds. Sustained break of 0.8079 will target 100% projection at 0.7382.
Markets Cautious Despite US-China Trade Progress, US Inflation and Consumer Data In Focus This Week
Markets opened the week on a subdued note despite the White House’s announcement that a trade agreement had been reached with China following negotiations in Switzerland. Despite the positive headline, investor reaction has been muted with lackluster performance in Asian stocks. Traders appear to be holding back judgment, at least until US Treasury Secretary Scott Bessent's full briefing later in the day.
In the currency markets, commodity currencies including Kiwi, Aussie and Loonie are outperforming slightly, supported by cautious optimism surrounding global trade. Meanwhile, traditional safe-haven currencies, Yen and Swiss Franc, are softening, along with Euro. Dollar and British Pound are trading mixed in the middle..
This week brings a raft of high-profile US data, with particular attention on CPI, PPI, and retail sales. These releases will offer the first real look at how the sweeping April tariffs are affecting consumer prices and spending behavior.
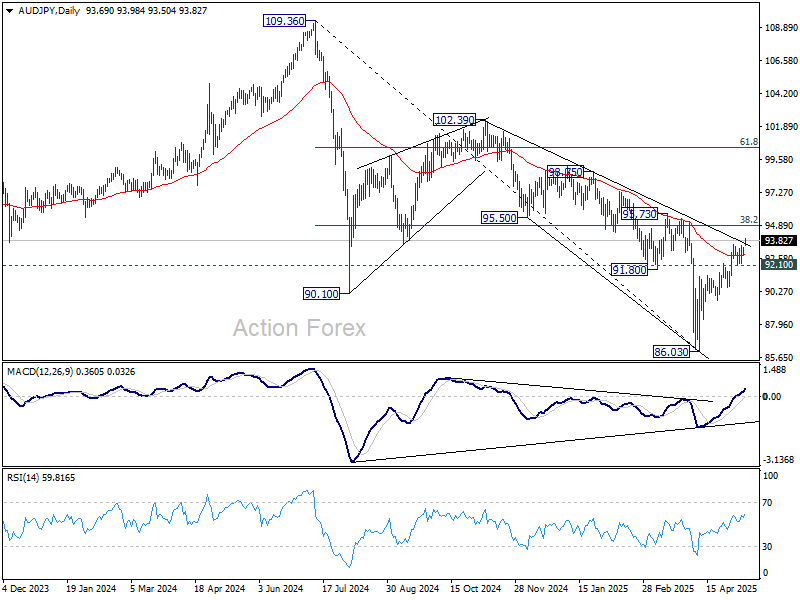
Technically, AUD/JPY is showing encouraging signs of strength as risk appetite improves. The rebound from the 86.03 low is resuming, with the pair now trading above 55 D EMA at 92.84. Sustained trading above this EMA will add to the case that correction from 109.36 (2024 high) has completed at 86.03. Next target will be 38.2% retracement of 109.36 to 86.03 at 94.94. However, break of 92.10 support will dampen this bullish view and mix up the outlook.
In Asia, at the time of writing, Nikkei is up 0.05%. Hong Kong HSI is up 0.93%. China Shanghai SSE is up 0.37%. Singapore is on holiday. Japan 10-year JGB yield is up 0.039 at 1.393.
Gold Falls as US-China Trade Deal Signals Easing Tensions
Gold opened the week on the back foot as signs of further easing global trade tensions dented demand for safe-haven assets. The White House posted a surprise announcement of a trade agreement with China after weekend negotiations in Geneva. While no details were released immediately, both sides described the outcome as positive.
US Treasury Secretary Scott Bessent called the talks a source of “substantial progress,” with a full briefing promised for Monday. US Trade Representative Jamieson Greer said the deal would help resolve the ongoing “national emergency” in trade. China’s Vice Premier He Lifeng confirmed both sides had reached “important consensus” and agreed to create a consultation mechanism for economic and trade issues.
Markets appear to be cautiously optimistic that the US-China agreement marks a turning point in the broader trade conflict, at least in tone and intent. Investors are likely waiting for concrete details before reassessing the longer-term outlook, but for now, the improved risk sentiment is weighing on Gold’s short-term appeal.
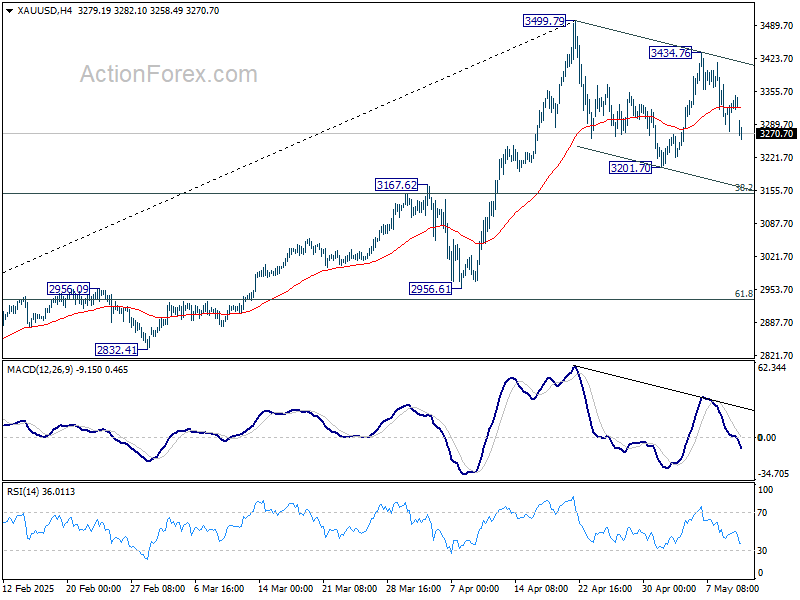
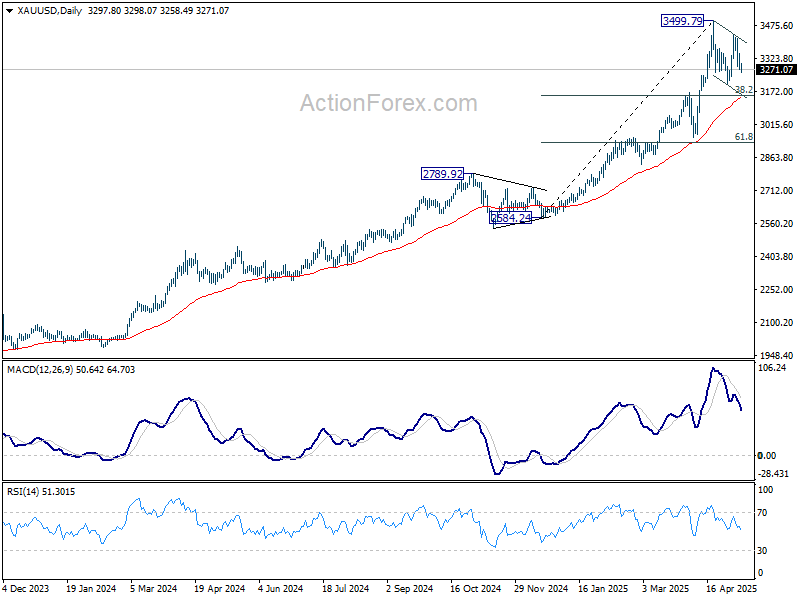
Technically, Gold's extended decline suggests that rebound from 3201.70 has completed at 3434.76. Fall from there is now seen as the third leg of the corrective pattern from 3499.79 high. Deeper fall is in favor to 3201.70 support and possibly below. Still, down side should be contained by 38.2% retracement of 2584.24 to 3499.79 at 3150.04, which is close to 55 D EMA (now at 3144.42). Larger up trend is expected to resume after the correction completes.
Bitcoin losing momentum after strong rally
Bitcoin posted a strong rally last week, driven by a combination of improved global risk sentiment and sustained institutional demand through exchange-traded funds. A key driver has been BlackRock’s spot Bitcoin ETF, which extended its inflow streak to 19 consecutive trading days, its longest run of the year. These flows have provided strong tailwinds for Bitcoin, helping push prices closer to the 109,571 record high.
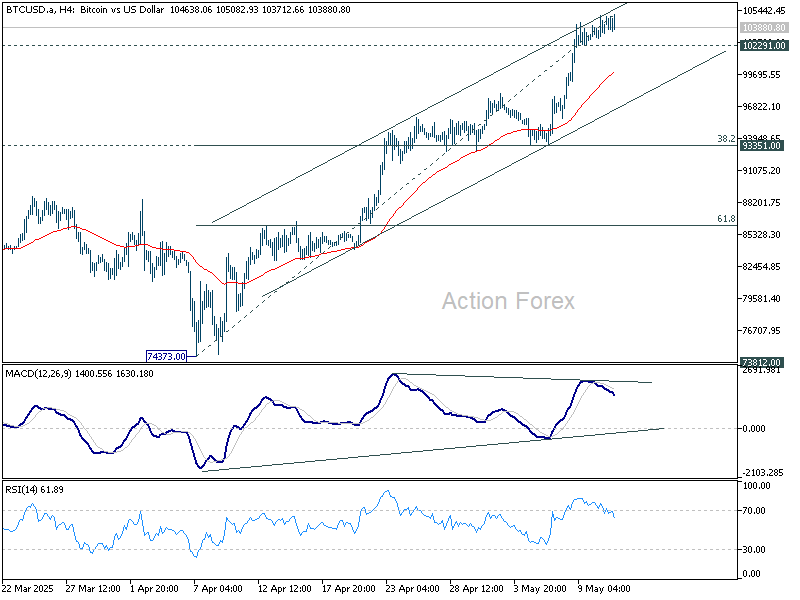
However, signs are emerging that the rally may be losing steam, as seen in 4H MACD. A break below 102,291 support level would confirm short term topping, opening the door for a deeper pullback toward the 93,351 zone.
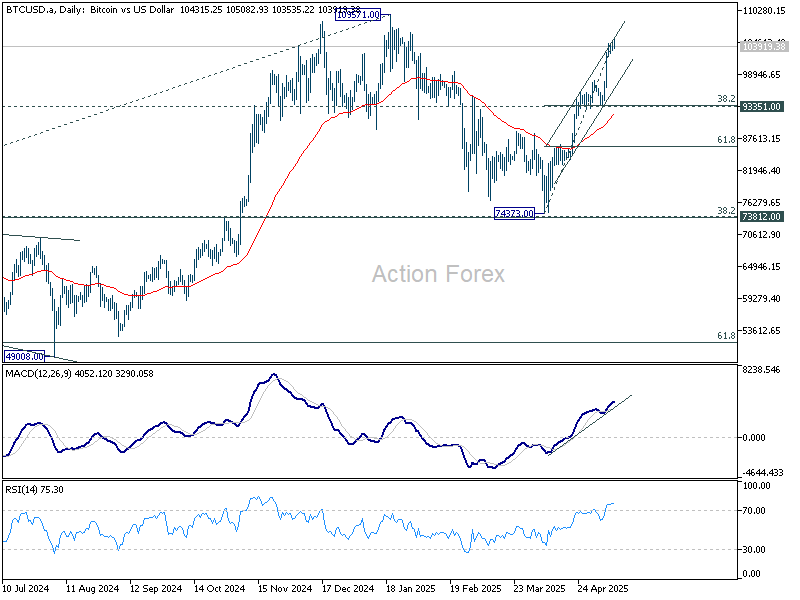
The depth and structure of the correction, if realized, will be critical in assessing whether the advance from 74,373 low marks resumption of the long-term uptrend. Or it was merely the second leg in the medium term corrective pattern from the all-time high of 109,571.
US data deluge to reveal first hints of tariff impacts
This week will be packed with key economic data from the US, Japan, the UK and Australia. In particular for the US, tariffs impacts are beginning to filter through inflation and consumption indicators.
The US April CPI and PPI reports will be the first meaningful look at how tariffs are affecting price levels. While it's likely too early to see the full pass-through, any uptick in goods inflation could point to the initial impact of the 10–145% import duties imposed last month. In this round, annual readings will remain relevant, but month-on-month changes could carry more market impact at this early stage of the tariff cycle.
Alongside inflation, April retail sales data will offer a clearer picture of how US consumers are reacting to any pricing shifts and the broader risk of higher costs on the horizon. The University of Michigan's consumer sentiment survey, including its forward-looking inflation expectations component, will also provide key insight into how tariffs are feeding further into household psychology.
In Japan, markets are increasingly convinced that BoJ will hold off on further tightening for longer, especially after it downgraded GDP forecasts. This week’s preliminary Q1 GDP data may confirm a contraction, reinforcing that view. Additionally, the BoJ’s Summary of Opinions from the latest policy meeting will give investors a sense of how concerned board members are about the rising risks from global trade disruptions and fragile domestic demand. A clear dovish tilt in the minutes could further weigh on Yen and push back rate hike expectations even further.
From the UK, GDP and employment figures are due, but these are unlikely to shift the BoE from its current path of gradual easing—one 25bps cut per quarter—unless the data contains major surprises. Attention is likely to remain on the next phase of the recently announced US-UK trade agreement. With the framework now public, markets are looking for concrete details, timelines, and sector-specific implementations that could affect investment flows and business sentiment in the months ahead.
Australia’s wage price index and job figures will also draw attention, though they are not expected to derail the current consensus for a rate cut from RBA later this month. Slowing growth, fading inflation momentum, and global uncertainty continue to dominate the domestic narrative.
Here are some highlights for the week:
- Monday: Japan current account; Eco Watcher sentiment.
- Tuesday: BoJ Summary of Opinions; Australia Westpac consumer sentiment, NAB business confidence; UK employment; Germany ZEW economic sentiment; US CPI.
- Wednesday: Japan PPI; Australia wage price index; Canada building permits.
- Thursday: Australia employment; UK GDP, trade balance; Swiss PPI; Eurozone GDP revision, industrial production; Canada housing starts, manufacturing sales, wholesale sales; US retail sales, PPI, jobless claims, Empire State manufacturing, Philly Fed manufacturing, industrial production, business inventories, NAHB housing index.
- Friday: New Zealand BNZ manufacturing, inflation expectations; Japan GDP; Eurozone trade balance; US building permits and housing starts, import prices, UoM consumer sentiment and inflation expectations.
USD/CHF Daily Outlook
Daily Pivots: (S1) 0.8192; (P) 0.8232; (R1) 0.8278; More….
USD/CHF's breach of 0.8333 suggests that rebound from 0.8038 is resuming. Intraday bias is back on the upside for 38.2% retracement of 0.9200 to 0.8038 at 0.8482. But strong resistance should be seen there to limit upside. On the downside, firm break of 0.8184 support will argue that the corrective rise has completed, and bring retest of 0.8038.
In the bigger picture, long term down trend from 1.0342 (2017 high) is still in progress and met 61.8% projection of 1.0146 (2022 high) to 0.8332 from 0.9200 at 0.8079 already. In any case, outlook will stay bearish as long as 55 W EMA (now at 0.8750) holds. Sustained break of 0.8079 will target 100% projection at 0.7382.
Bitcoin losing momentum after strong rally
Bitcoin posted a strong rally last week, driven by a combination of improved global risk sentiment and sustained institutional demand through exchange-traded funds. A key driver has been BlackRock’s spot Bitcoin ETF, which extended its inflow streak to 19 consecutive trading days, its longest run of the year. These flows have provided strong tailwinds for Bitcoin, helping push prices closer to the 109,571 record high.
However, signs are emerging that the rally may be losing steam, as seen in 4H MACD. A break below 102,291 support level would confirm short term topping, opening the door for a deeper pullback toward the 93,351 zone.
The depth and structure of the correction, if realized, will be critical in assessing whether the advance from 74,373 low marks resumption of the long-term uptrend. Or it was merely the second leg in the medium term corrective pattern from the all-time high of 109,571.
EURUSD Hits Crucial Floor: Bounce Back or Breakdown Ahead?
Key Highlights
- EUR/USD started a downside correction and traded below 1.1320.
- A connecting bearish trend line is forming with resistance at 1.1330 on the 4-hour chart.
- GBP/USD is consolidating gains and facing hurdles near the 1.3320 level.
- Gold prices are showing signs of a downside correction below $3,275.
EUR/USD Technical Analysis
The Euro failed to continue higher above 1.1420 and corrected gains against the US Dollar. EUR/USD is now trading near the key support at 1.1200.
Looking at the 4-hour chart, the pair started a fresh decline below the 1.1380 and 1.1350 levels. There was a close below the 1.1320 level and the 100 simple moving average (red, 4-hour). Finally, the pair tested the 1.1200 support zone and the 200 simple moving average (green, 4-hour).
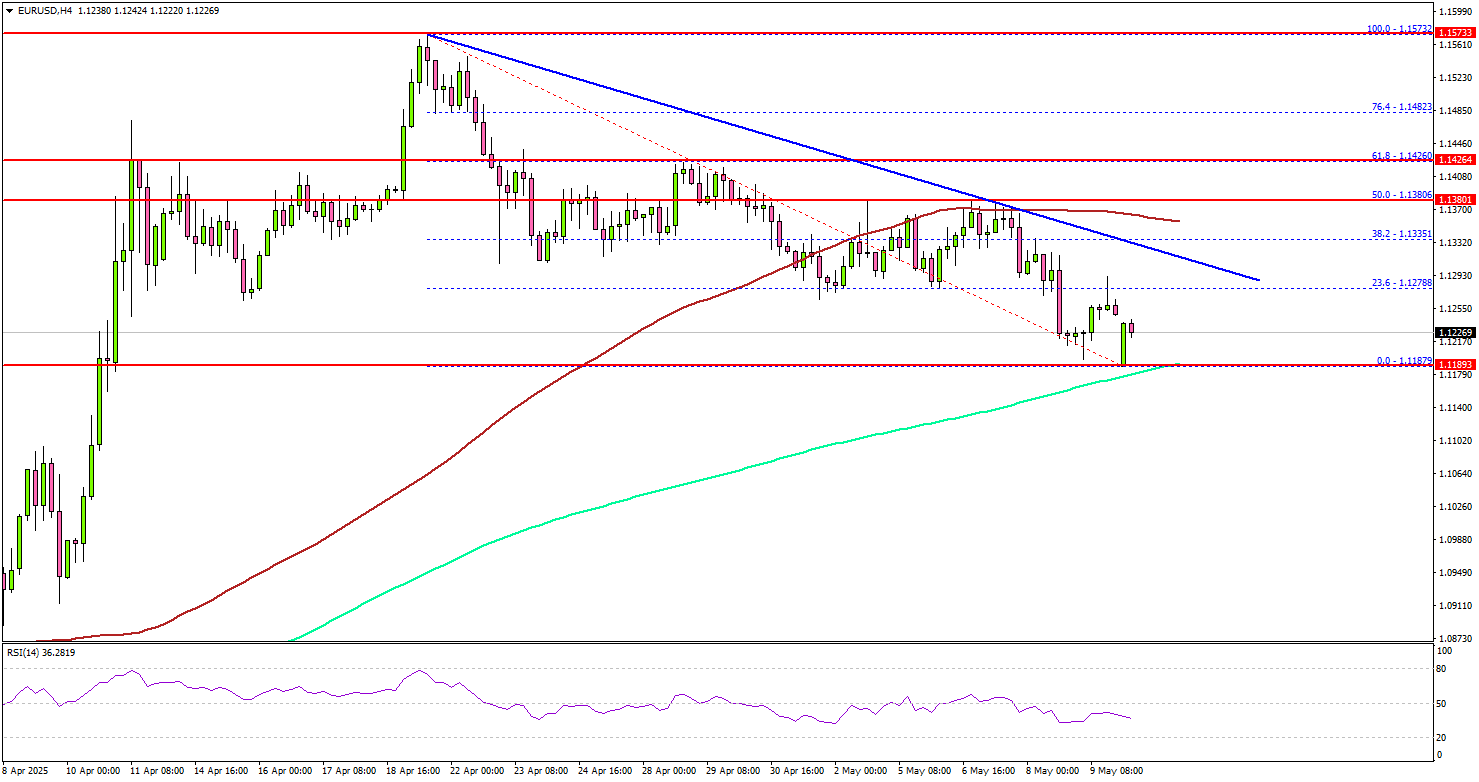
A low was formed at 1.1187 and the pair is now consolidating losses. On the upside, the pair could face resistance near the 1.1250 level. The next key resistance sits near the 1.1275 level and the 23.6% Fib retracement level of the downward move from the 1.1572 swing high to the 1.1187 low.
The first major resistance sits at 1.1320. There is also a connecting bearish trend line forming with resistance at 1.1330 on the same chart.
A close above the 1.1330 level could set the tone for another increase. In the stated case, the pair could even clear the 1.1380 resistance. The next major stop for the bulls could be near the 1.1425 level and the 61.8% Fib retracement level of the downward move from the 1.1572 swing high to the 1.1187 low.
On the downside, immediate support sits near the 1.1190 level and the 200 simple moving average (green, 4-hour). The next key support sits near the 1.1150 level. Any more losses could send the pair toward the 1.1020 level.
Looking at GBP/USD, the pair started a fresh decline and the bears were able to push the pair below the 1.3250 support.
Upcoming Economic Events:
- Fed's Kugler speech.
- USDA WASDE Report.
Gold Falls as US-China Trade Deal Signals Easing Tensions
Gold opened the week on the back foot as signs of further easing global trade tensions dented demand for safe-haven assets. The White House posted a surprise announcement of a trade agreement with China after weekend negotiations in Geneva. While no details were released immediately, both sides described the outcome as positive.
US Treasury Secretary Scott Bessent called the talks a source of “substantial progress,” with a full briefing promised for Monday. US Trade Representative Jamieson Greer said the deal would help resolve the ongoing “national emergency” in trade. China’s Vice Premier He Lifeng confirmed both sides had reached “important consensus” and agreed to create a consultation mechanism for economic and trade issues.
Markets appear to be cautiously optimistic that the US-China agreement marks a turning point in the broader trade conflict, at least in tone and intent. Investors are likely waiting for concrete details before reassessing the longer-term outlook, but for now, the improved risk sentiment is weighing on Gold’s short-term appeal.
Technically, Gold's extended decline suggests that rebound from 3201.70 has completed at 3434.76. Fall from there is now seen as the third leg of the corrective pattern from 3499.79 high. Deeper fall is in favor to 3201.70 support and possibly below. Still, down side should be contained by 38.2% retracement of 2584.24 to 3499.79 at 3150.04, which is close to 55 D EMA (now at 3144.42). Larger up trend is expected to resume after the correction completes.
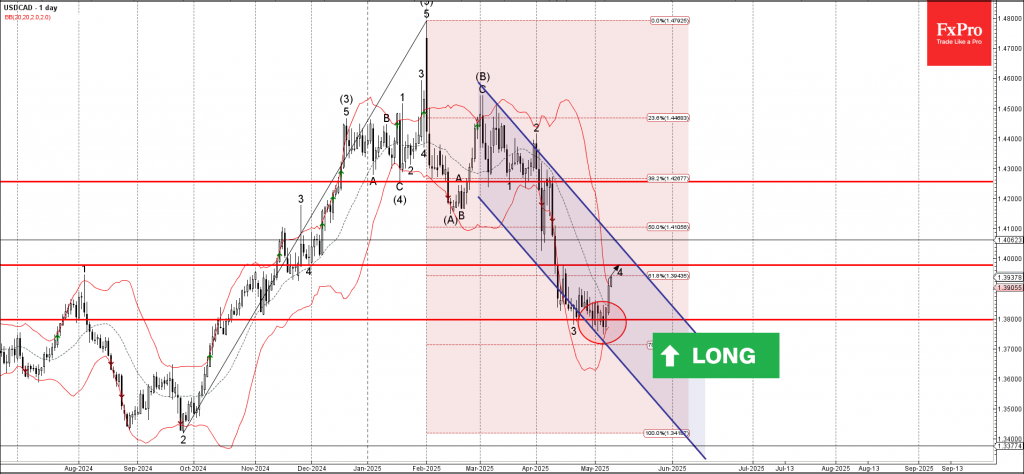
USDCAD Wave Analysis
USDCAD: ⬆️ Buy
- USDCAD reversed from support area
- Likely to rise to resistance level 1.3980
USDCAD currency pair recently reversed up from the support area between the support level 1.3800 (which has been reversing the price from April), lower daily Bollinger Band and the support trendline of the daily down channel from March.
The upward reversal from this support area started the active short-term ABC correction 4.
USDCAD can be expected to rise to the next resistance level 1.3980 (target price for the completion of the active ABC correction 4).
Dollar: A Counterattack
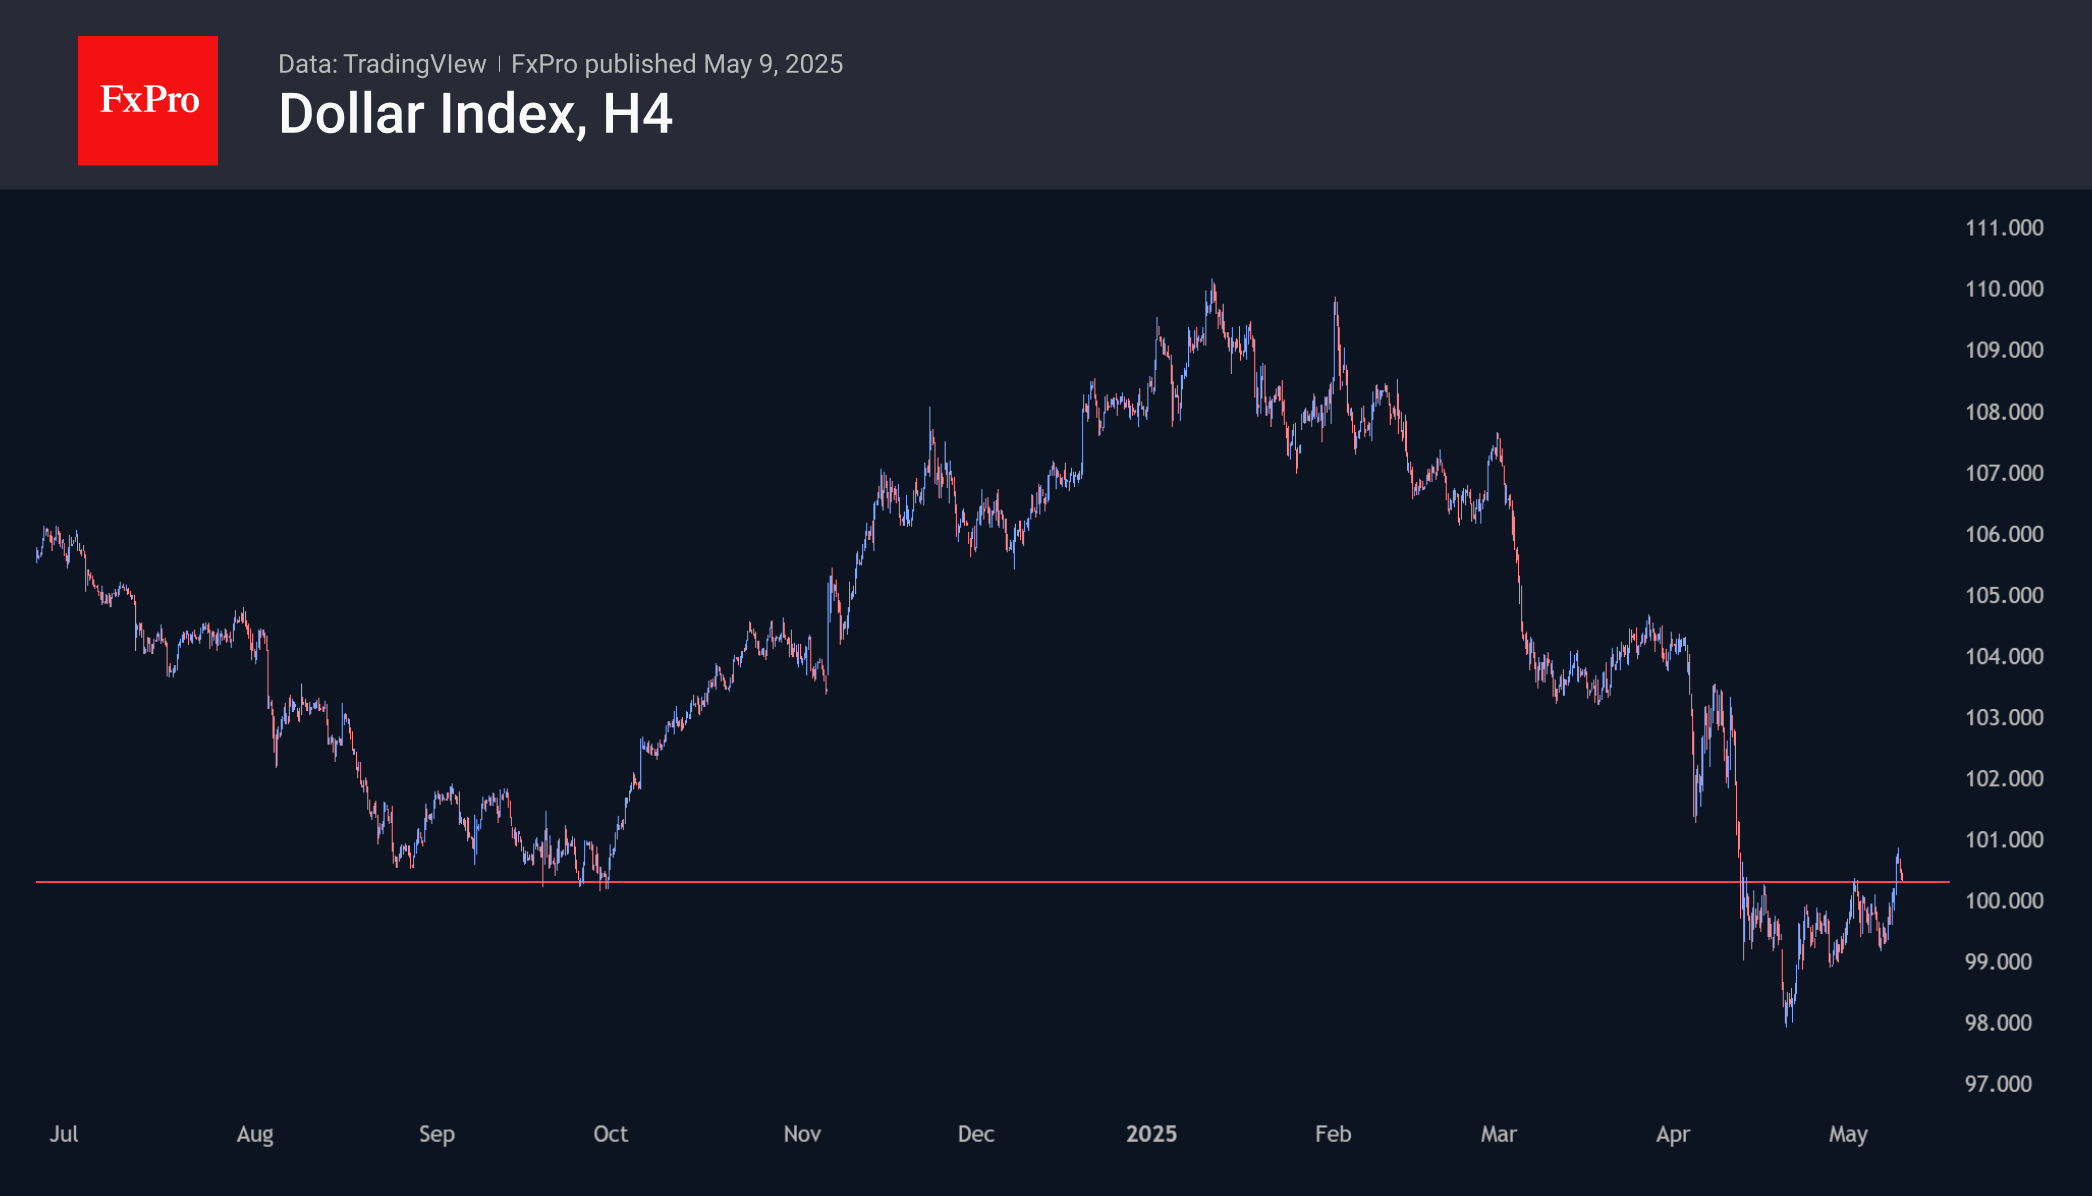
The US Dollar has gone on the counterattack thanks to the Fed’s reluctance to cut rates and support from the White House. The US and China are preparing for trade talks, and Donald Trump is announcing a deal with the UK. Rumours are circulating in the market that the President will loosen Joe Biden’s restrictions on trade in artificial intelligence chips. This allows the S&P 500 and the USD index to spread their wings.
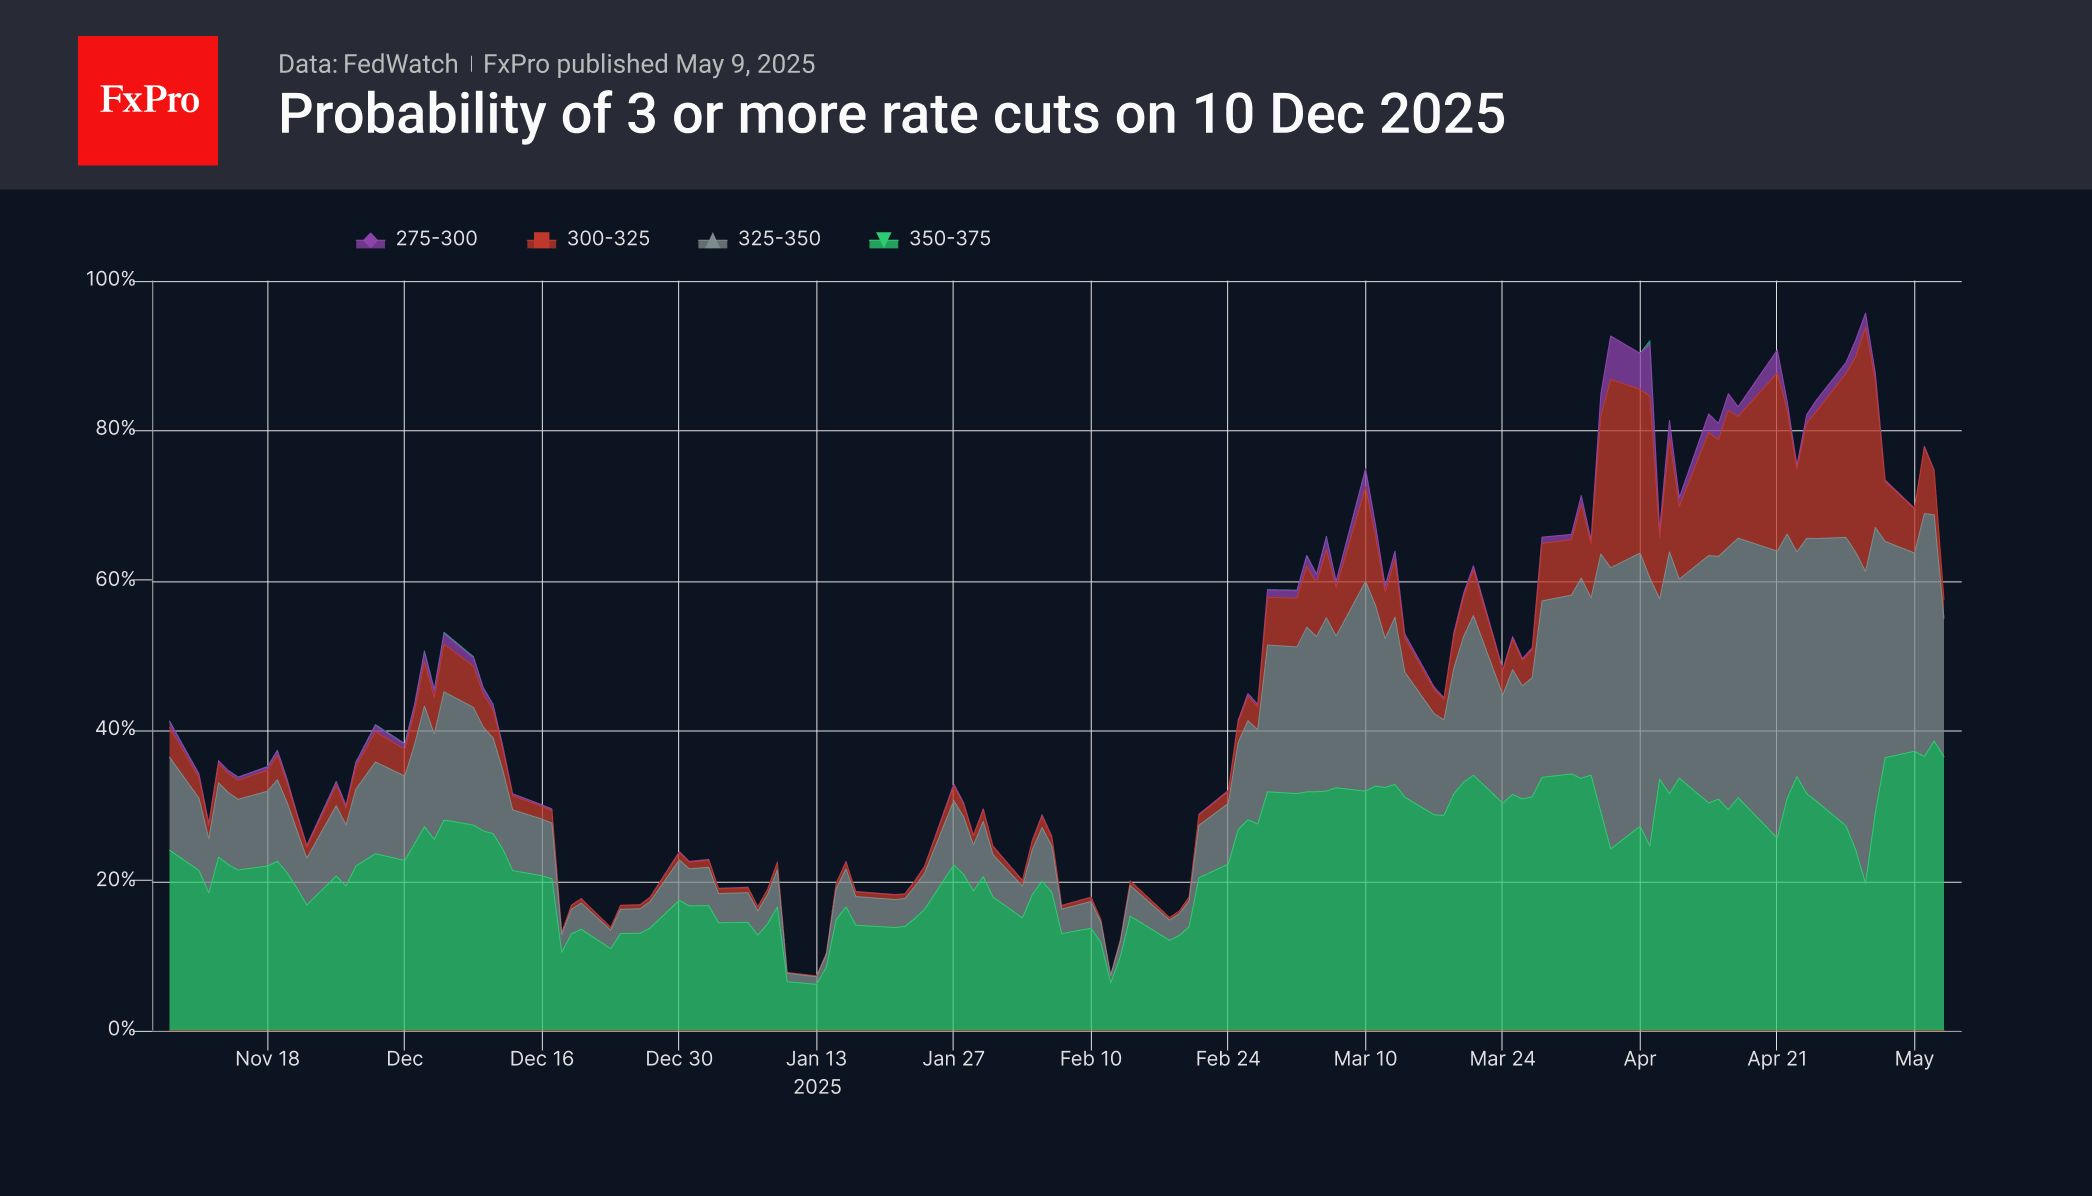
Jerome Powell argues that the US economy is strong, which gives the Fed time to keep rates in the 4.25%- 4.5% range. The central bank is worried about inflation accelerating due to the rates, while its counterparts from other countries fear slowing economic growth. They intend to cut rates, and the divergence in monetary policy plays into the hands of the US dollar.
Nevertheless, the derivatives market still expects three acts of monetary easing by the Fed before the end of 2025. The reason will likely be a cooling of the US economy, which will hit the dollar. Until the end of the initial 90-day pause before tariffs hit, the Fed had no reason to cut rates. At the same time, a break of the resistance at 100.3 will increase the risks of a pullback to the downtrend in the USD index.
Sterling and Dollar Lead as Trade Deal Grabs Attention
Last week was dominated by developments out of the US and UK, not just because of monetary policy decisions, but also the unexpected announcement of a US-UK trade deal. Fed's hold and BoE's cut were were largely overshadowed by the surprise trade breakthrough.
Importantly, the structure of the agreement offered valuable insights into the US administration’s trade strategy which could set the template for negotiations with other key partners.
Despite the significance of the agreement, market reactions were relatively restrained. Major US stock indexes and the UK’s FTSE 100 closed slightly lower. Investors remain cautious about the deal’s practical impact and the broader global developments.
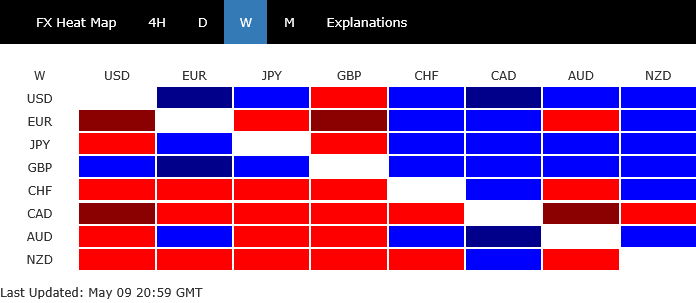
Still, the news did provide meaningful support to the currencies involved: Sterling and Dollar emerged as the week’s top performers. Japanese Yen took third place
In contrast, Loonie underperformed at the bottom. Kiwi and Swiss Franc also lagged. Euro and Aussie ended in the middle of the pack.
Historic Pact, Modest Reaction: Investors Cautious Despite US-UK Trade Breakthrough
While the US-UK trade deal marked a diplomatic milestone, the first bilateral agreement since the sweeping tariff measures enacted in April, financial markets responded with notable indifference. Equities initially rallied on Thursday following the announcement, but the enthusiasm quickly faded. All three major US indexes reversed earlier gains and ended the week in the red, with S&P 500 falling -0.5%, NASDAQ down -0.3%, the DOW slipping -0.2%.
The structure of the agreement reveals much about the current US approach to trade. The UK, given its trade surplus with the US and its unparalleled security ties, likely received the most favorable terms Washington is willing to offer. If this is the best-case scenario, expectations for more comprehensive or lenient agreements, even with regions like the EU or Japan, may need to be tempered.
A 10% blanket tariff remains on virtually all UK exports to the US. That is likely the floor for future negotiations with other partners. This baseline may not only serve as a protective measure but also as a consistent revenue stream to fund Trump’s domestic agenda, including tax cuts. Though minor exemptions may be granted, such as on UK automobiles and metals, they are expected to be case-specific rather than systemic.
What sets this agreement apart is the emphasis on expanding market access for US companies in the UK, particularly in agriculture and industries. It suggests that future trade arrangements will be designed less to eliminate tariffs wholesale and more to create bilateral corridors of opportunity favoring U.S. exporters, negotiated country by country.
In that context, the muted market response becomes clearer. Investors recognize that this agreement doesn’t signify a return to pre-tariff global trade norms. With 90 days remaining in the current tariff truce, the road ahead includes complex negotiations not only with China and the EU but also within supply chains deeply impacted by the new tariff regime. Optimism about progress must be balanced against the reality that a systemic overhaul is still underway, and clarity will be slow to emerge.
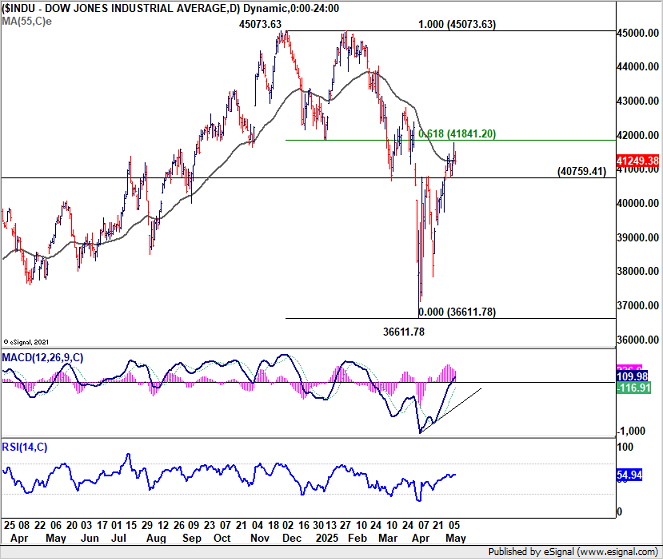
Technically, DOW's rebound from 36611.78 is seen as the second leg of the corrective pattern from 45073.63 high. Further rise is in favor as long as 40759.41 support holds. However, DOW could start to lose momentum more apparently above 61.8% retracement of 45073.63 to 36611.78 at 41841.20. Break of 40759.41 will indicate short term topping, and bring pullback first.
June Fed Cut Going Off the Radar, July Doubtful, Dollar Extends Modest Rise
Fed held its benchmark interest rate unchanged at 4.25–4.50% last week, as widely anticipated. The key message from Fed Chair Jerome Powell was one of restraint: rate cuts are not imminent. Powell emphasized that with the current level of uncertainty surrounding US trade policy and tariffs, “it’s not a situation where we can be preemptive.” He reiterated that if the current size and scale of tariffs remain in place, the US could face the dual challenge of rising inflation and unemployment.
Cleveland Fed President Beth Hammack's comments from an interview published on Friday is worth a mention. She noted that the breadth of tariff measures already discussed and implemented raises “real questions” about their ultimate economic impact. As such, she suggested it may take longer before Fed can confidently begin to ease rates.
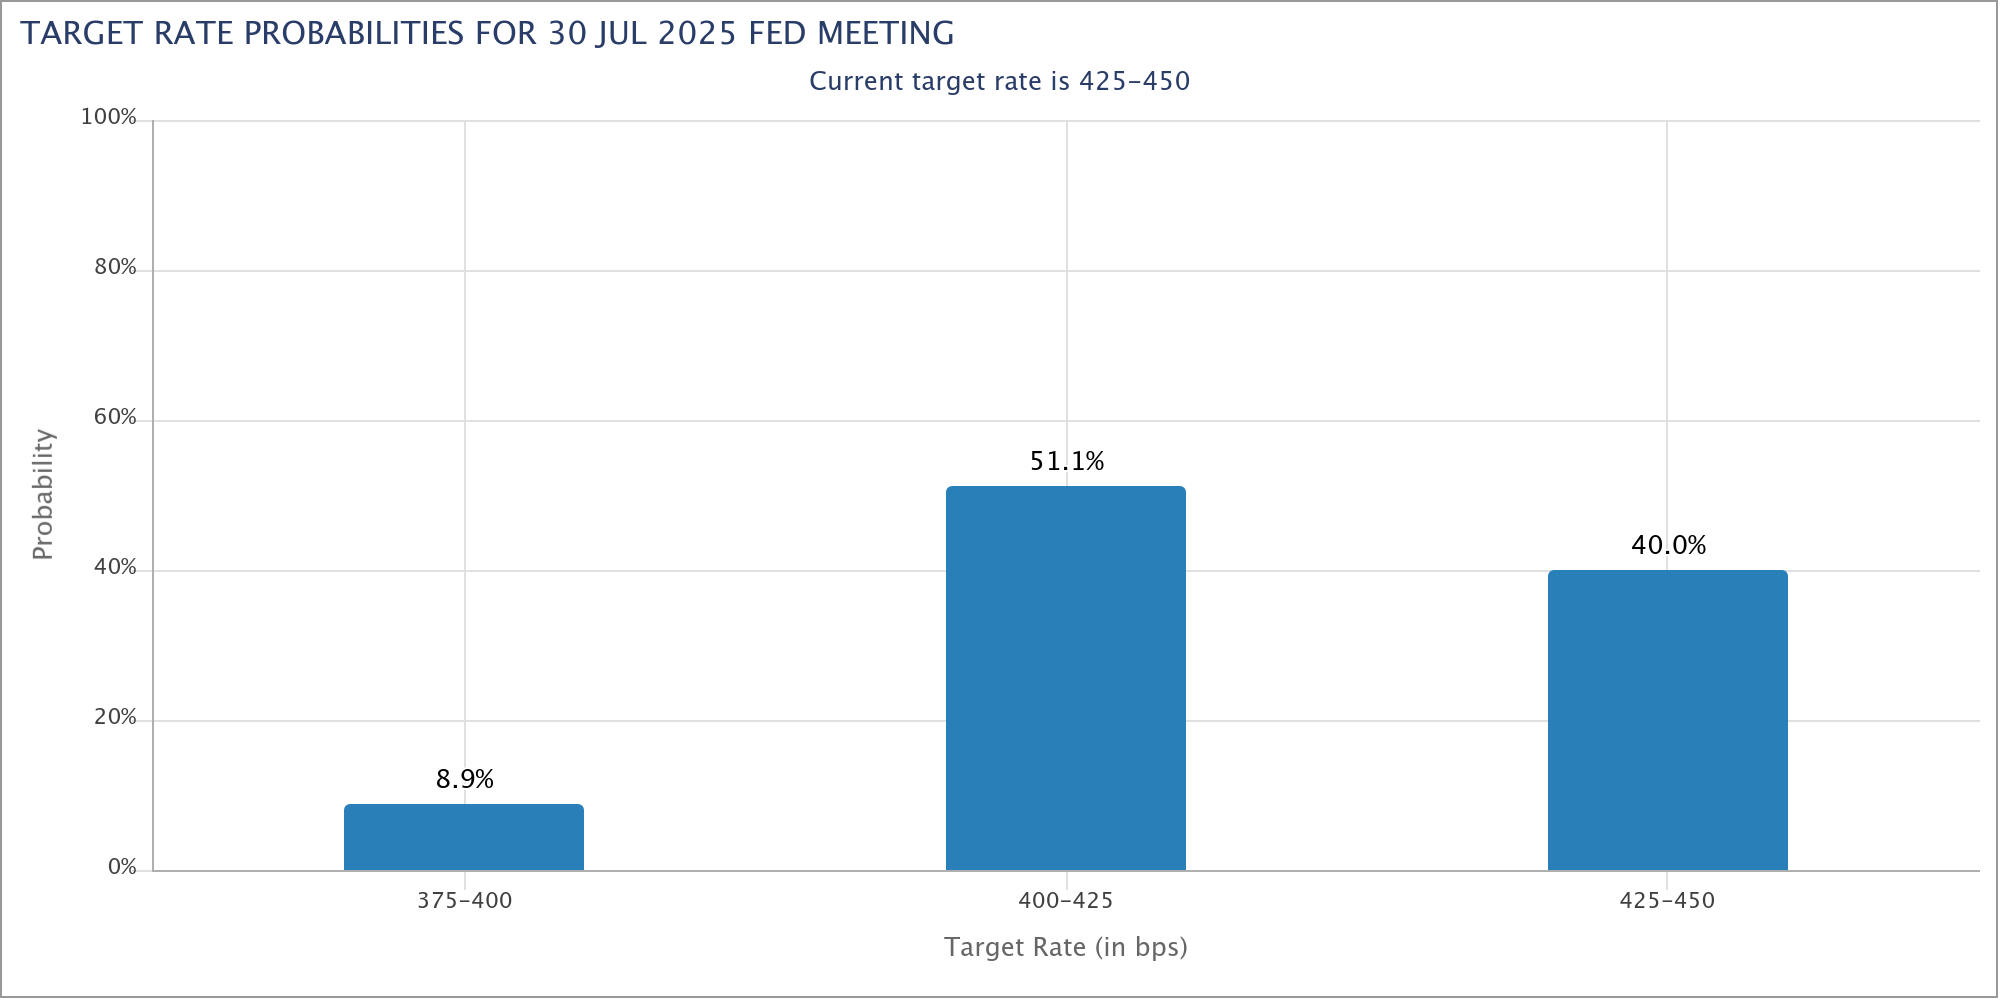
Crucially, Hammack pointed out that there won’t be much new data between now and the next FOMC meeting in June, limiting the Fed’s ability to reassess the situation. Her comments align with current market pricing, which assigns just a 17.2% probability to a June rate cut.
Looking ahead, July is now the more likely inflection point, though conviction is still weak. Market-implied odds for a 25bps cut in July stand at around 60%. Investors remain far from convinced a rate move is locked in.
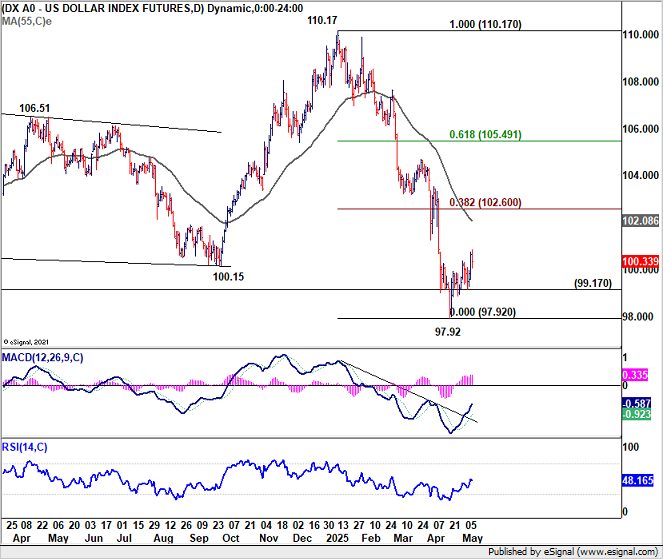
Dollar Index gyrated higher last week, partly supported by expectations that Fed interest rate will stay high for longer, and partly support by improved appetite on US assets as trade negotiations made progress.
Technically, corrective rise from 97.92 could extend higher towards 55 D EMA (now at 102.08). But strong resistance should be seen from 38.2% retracement of 110.17 to 97.92 at 102.60 limit upside. On the downside, break of 99.17 support would argue that the corrective recovery has completed earlier than expected, and bring retest of 97.92 low next.
BoE Vote Split Surprises, Top Mover GBP/CAD's Rally Limited
BoE delivered a 25bps rate cut to 4.25% as widely anticipated, but the composition of the vote took markets by surprise. The Monetary Policy Committee split three ways: five members supported the cut, two hawkish voices—Catherine Mann and Chief Economist Huw Pill—voted for no change, while Swati Dhingra and Alan Taylor pushed for a deeper 50bps reduction. The presence of two hawkish hold votes gave the overall decision a more cautious tone than markets had anticipated Market expectations for a gradual 25bps-per-quarter path remain intact.
BoE Governor Andrew Bailey addressed the impact of global trade tensions in a speech following the decision, and raised an interesting perspective. He highlighted how different global tariff scenarios could affect the UK economy in divergent ways. Most notably, Bailey stressed that a demand-driven downside—where both inflation and activity fall—would require a stronger monetary response compared to a supply-driven upside shock, where inflation rises but growth slows. The key distinction lies in the trade-off: when inflation and activity move in opposite directions, policy decisions become more complex and risk-laden, requiring a more delicate balance.
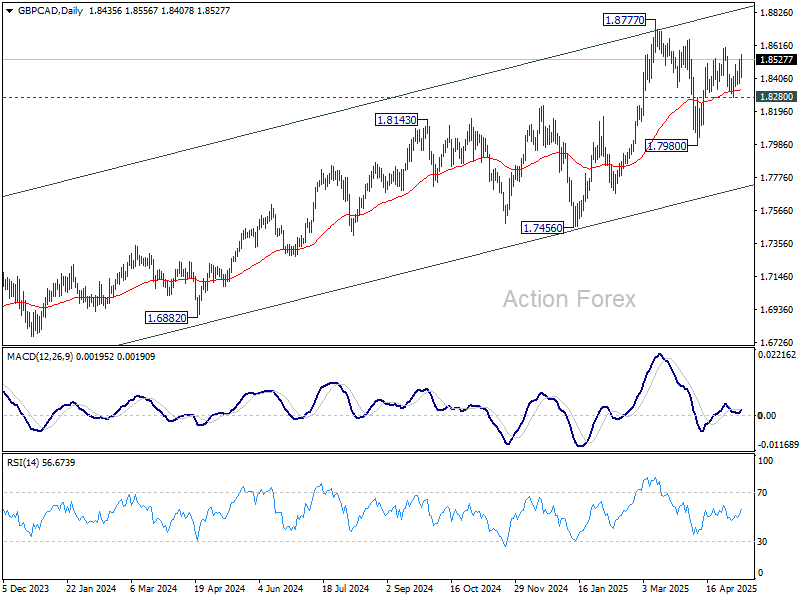
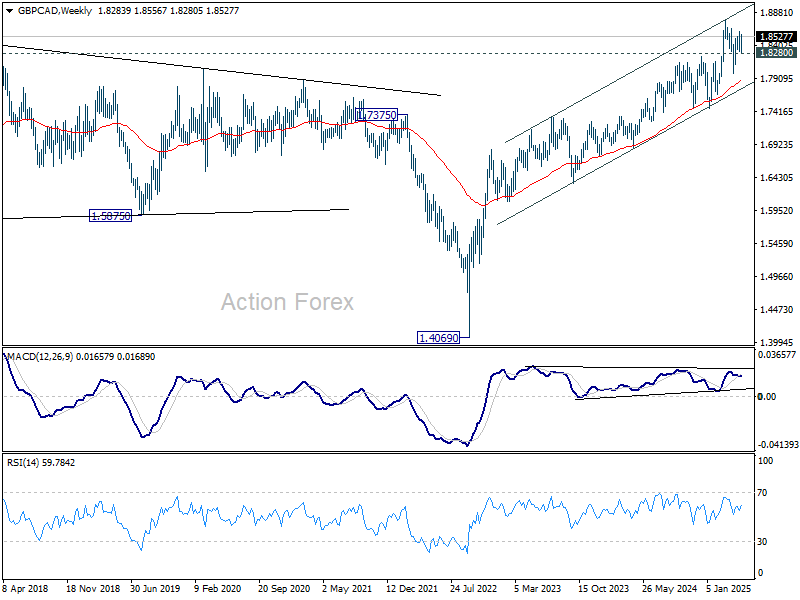
British Pound ended the week as the strongest major currency. GBP/CAD was the top mover, rising 1.13%. Still, price action in GBP/CAD doesn’t show clear strength. The bounce even failed to break the prior week’s high of 1.8598.
Technically, GBP/CAD is seen as in consolidation pattern from 1.8777, with current rise from 1.7980 as the second leg. Further rally might be seen but upside should be limited by 1.8777.
On the downside, break of 1.8280 support will argue that the third has started. Deeper fall should then follow to 1.7980, or even to channel support at around 1.7700.
AUD/USD Weekly Report
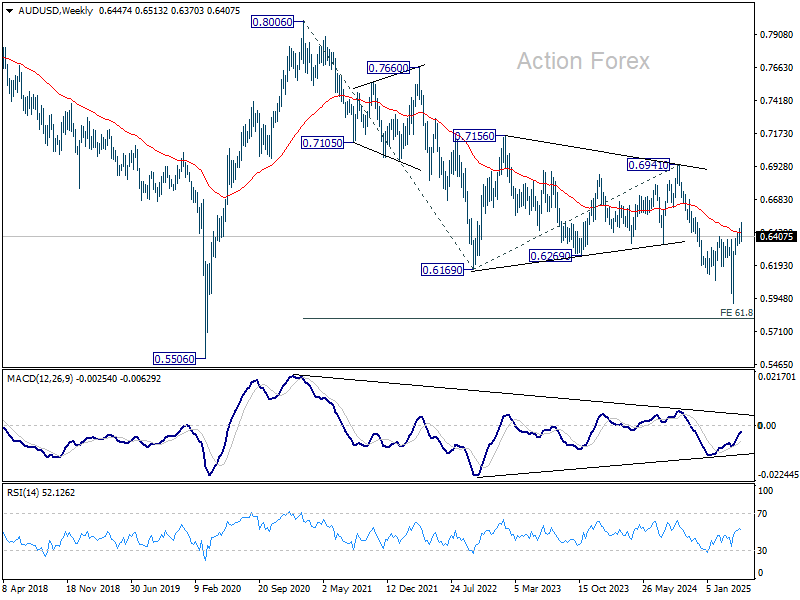
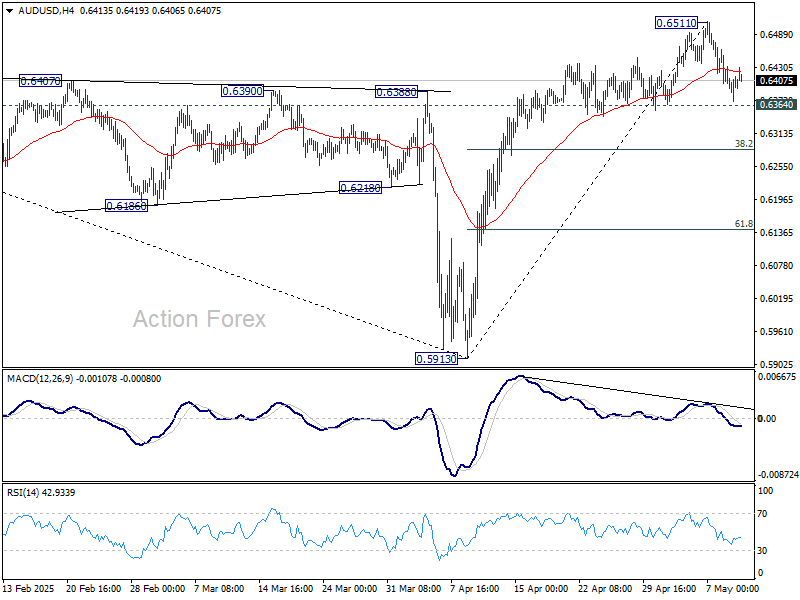
AUD/USD retreated after edging higher to 0.6511 last week, but downside is contained above 0.6364 support so far. Initial bias stays neutral this week first. On the upside, break of 0.6511 will resume the rally from 0.5913 to 61.8% retracement of 0.6941 to 0.5913 at 0.6548. However, considering bearish divergence condition in 4H MACD, break of 0.6364 support should confirm short term topping. Intraday bias will be turned back to the downside for 38.2% retracement of 0.5913 to 0.6511 at 0.6283.
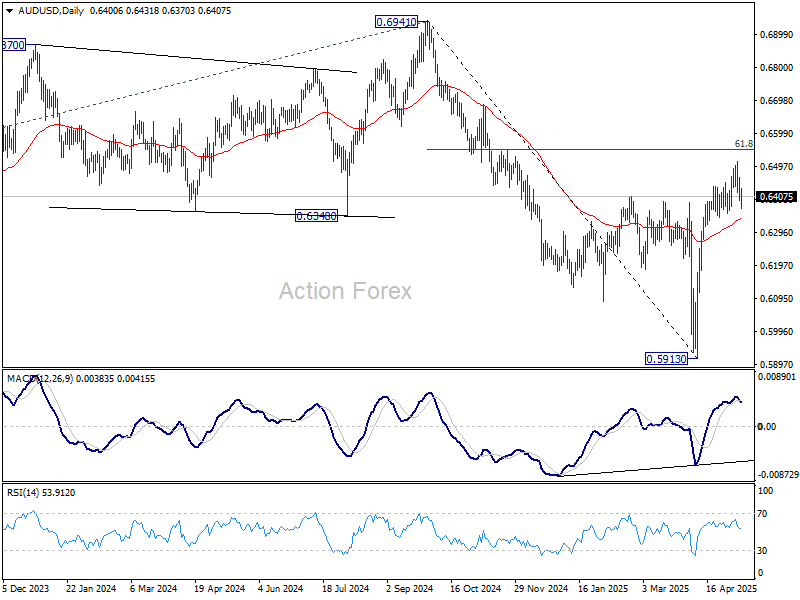
In the bigger picture, as long as 55 W EMA (now at 0.6443) holds, down trend from 0.8006 (2021 high) should resume later to 61.8% projection of 0.8006 to 0.6169 from 0.6941 at 0.5806. However, sustained trading above 55 W EMA will argue that a medium term bottom was already formed, and set up further rebound to 0.6941 resistance instead.
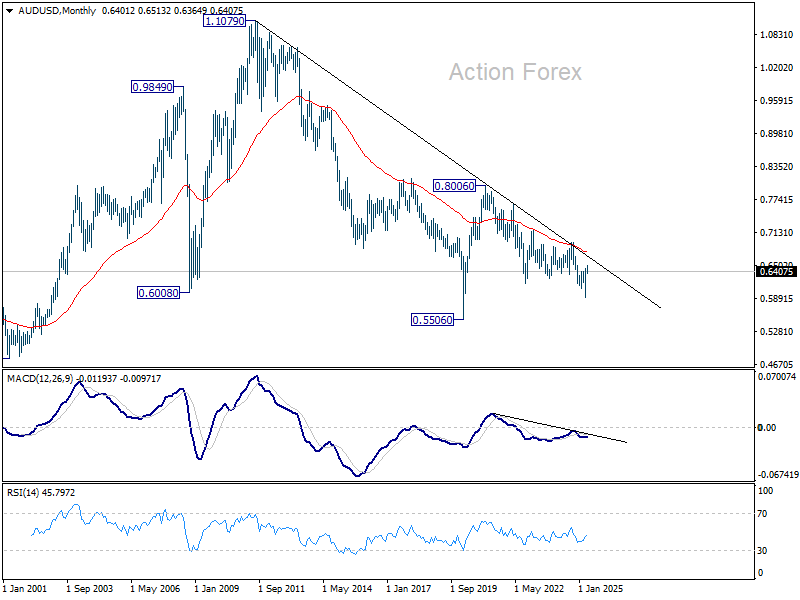
In the long term picture, prior rejection by 55 M EMA (now at 0.6764) is taken as a bearish signal. But for now, fall from 0.8006 is still seen as the second leg of the corrective pattern from 0.5506 long term bottom (2020 low). Hence, in case of deeper decline, strong support should emerge above 0.5506 to contain downside to bring reversal.