Sample Category Title
Japanese Yen Gains Ground as Japanese Retail Sales Jump
The Japanese yen has posted gains in the Thursday session. In North American trade, USD/JPY is trading at 113.30, down 0.34% on the day. On the release front, Japanese retail sales jumped 3.5%, its highest level since December 2017. Later in the day, Japan releases Tokyo Core CPI. In the U.S., the Core PCE Price Index dropped to 0.1%, shy of the estimate of 0.2%. Personal Spending improved to 0.6%, above the estimate of 0.4%. On the labor front, unemployment claims jumped to 234 thousand, well above the estimate of 221 thousand. This was the highest level since May. Later in the day, the Federal Reserve releases the minutes of its November policy meeting. On Friday, the U.S. releases Chicago PMI and Japan publishes consumer confidence. As well, the G-20 begins a two-day summit in Argentina.
The G-20 summit commences on Friday, and the highlight of the show promises to be an expected meeting between President Trump and Chinese President Xi Jinping. An exchange of tariffs between the U.S. and China has taken a bite out of the economies of both and could dampen global economic activity. President Trump has taken a tough line on China ahead of the summit, threatening to raise the tariffs from 10 percent to 25 percent on $250 billion worth of Chinese goods. Given Trump’s unpredictability, it remains unclear if he plans to carry out his threat, or is the sharp rhetoric simply grandstanding ahead of his crucial meeting with Xi.
The Bank of Japan is committed to its target of just below 2 percent, but that goal remains elusive. BoJ Core CPI, the preferred inflation indicator of the bank, edged up to 1.3%, its highest level in 2018 (the indicator posted an identical gain in August). Inflation could face further headwinds, as the slowdown in China and the ongoing global trade war takes a bite out of the country’s export sector. As well, the recent drop in oil prices is also likely to hamper inflation. There is little reason to expect that inflation will gather any upward momentum and some analysts are forecasting that inflation in 2018 will fall below the 1 percent level. Weak inflation means that the BoJ has little incentive to alter its ultra-accommodative monetary policy.
Elliott Wave Analysis: S&P500 and 10 Year US Notes
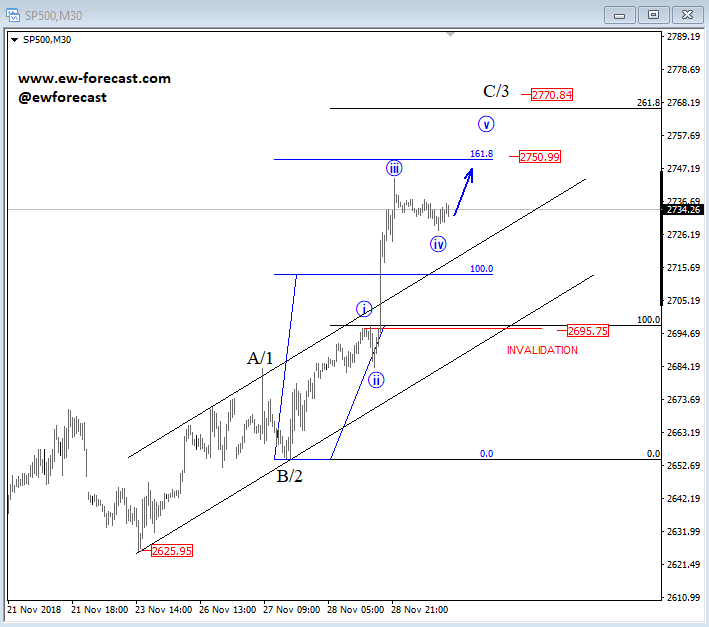
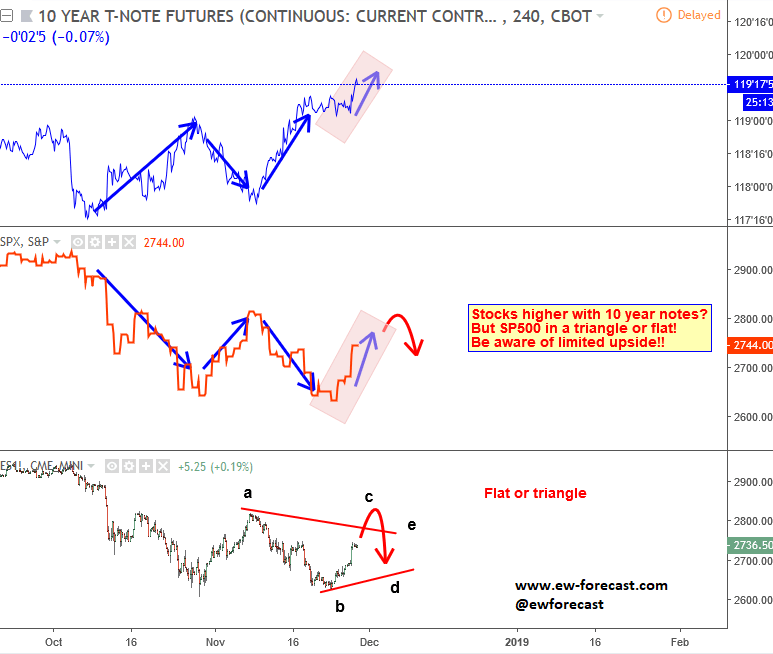
S&P500 made an impulsive rally yesterday due to a Powell's speech, so seems like it's heading higher within wave C/3, which should be made by five sub-waves, where we see room towards 2750-2770. But, we should be careful at this stage with bullish looking stocks for wave 3, because we see 10year US notes also trading bullish in positive correlation with S&P500 which is not exactly normal and this means that US stocks can see limited upside only for a wave C.
S&P500, 30Min
10Y US Notes vs. S&P500 Futures, 4h
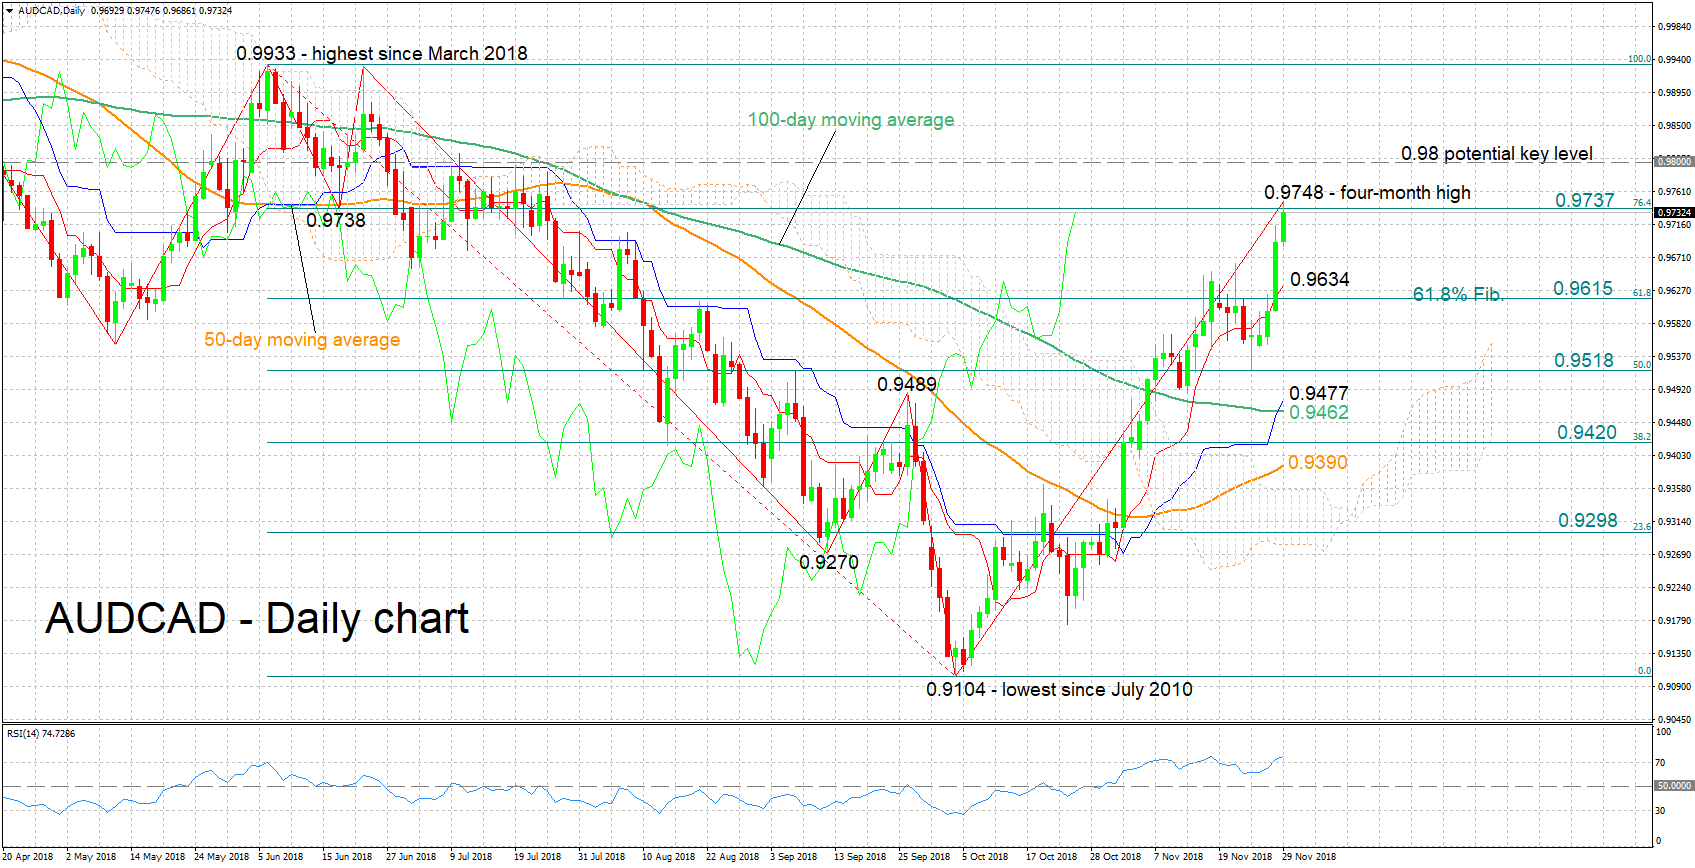
AUDCAD Hits 4-month High; Medium-Term Structure Tilts Bullish
AUDCAD staged a strong rebound after falling to 0.9104 in early October, this being its lowest since July 2010. Earlier on Thursday, it touched a four-month high of 0.9748.
The positively aligned Tenkan and Kijun-sen lines, as well as the rising RSI, are attesting to the bullish short-term bias that is in place. The RSI has entered overbought territory though. This implies that the late rally may be overstretched, which in turn translates into increased odds for a near-term pullback.
The area around 0.9737, which was momentarily broken earlier in the day, may be acting as a first line of resistance to further gains; the aforementioned point is the 76.4% Fibonacci retracement level of the downleg from 0.9933 to 0.9104. Higher, a barrier could come around the 0.98 handle, with the region around it being somewhat congested earlier in the year. Higher still, the 0.9933 peak would increasingly come into scope.
On the downside, support could come around 0.9615, the 61.8% Fibonacci mark; the zone around this level also captures the current level of the Tenkan-sen at 0.9634. Steeper losses would increasingly eye the 50% Fibonacci at 0.9518.
In terms of the medium-term picture, the move above 0.9489, which violated the downtrend condition of lower highs and lower lows that was previously in place, has definitively shifted the outlook towards a more bullish direction. Another bullish medium-term signal is that trading activity is taking place above the 50- and 100-day moving average lines, as well as above the Ichimoku cloud.
To conclude, the short-term outlook is bullish, though there are signs of an overextended advance. Meanwhile, the medium-term picture has assumed a bullish tilt in recent weeks.
Brent Futures Pare Losses after Reaching 13-month Trough
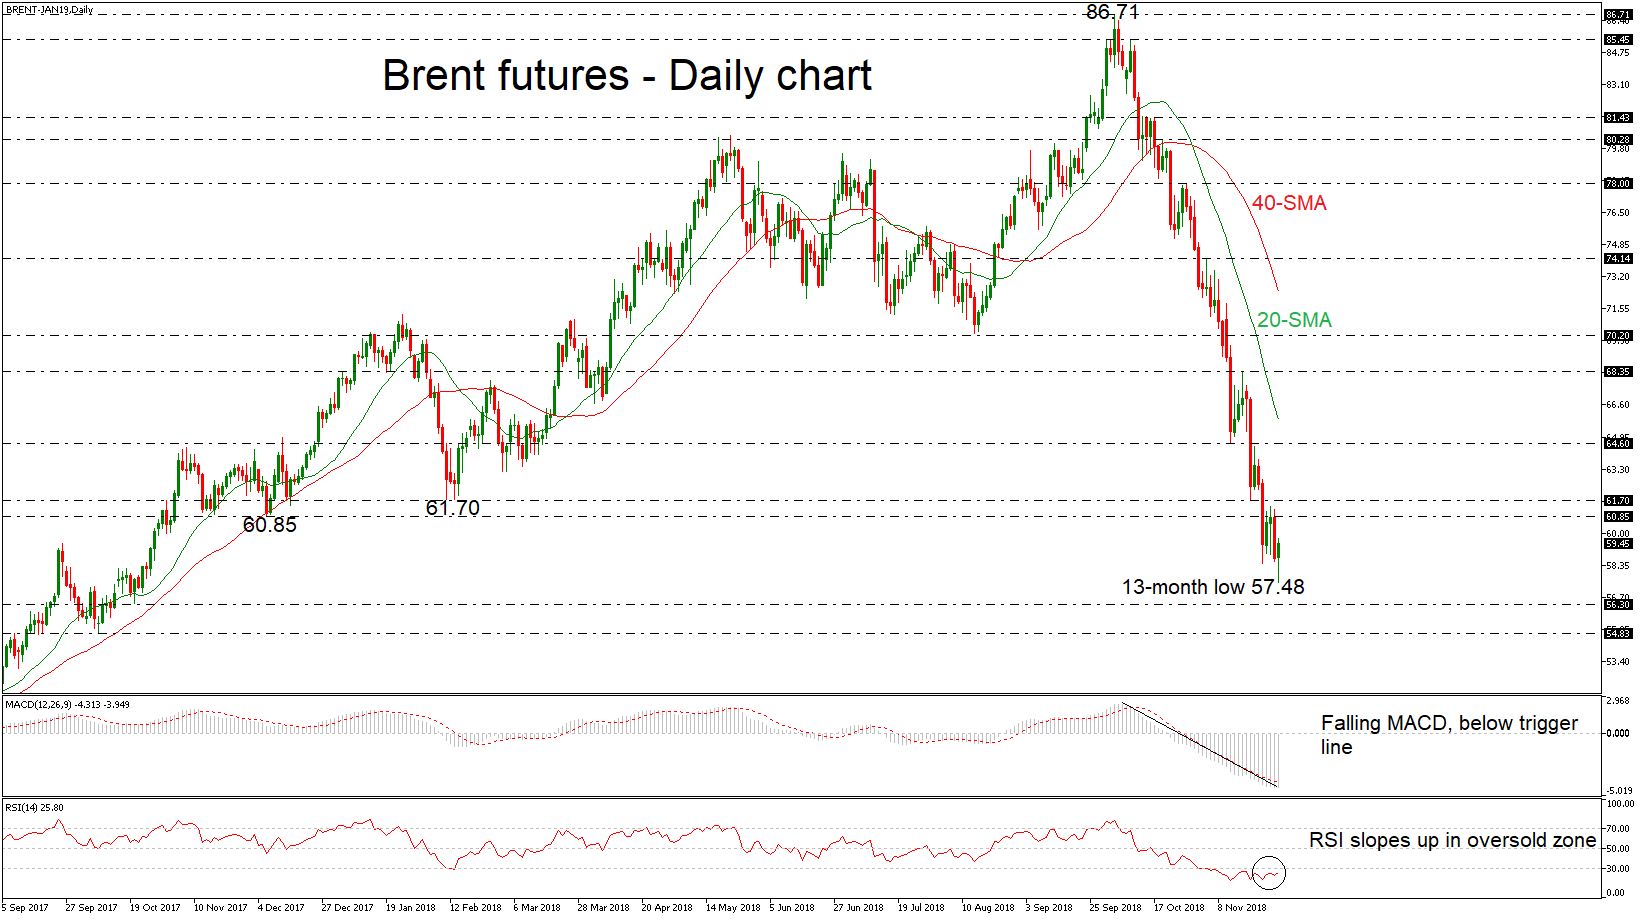
Brent crude oil futures with delivery in January 2019 tumbled to a new 13-month low of 57.48 earlier today, but quickly pared the losses. The price is set to complete the seventh straight negative week, while the technical indicators continue to hold in bearish zones. The MACD oscillator is strengthening its negative bias, while the RSI is pointing marginally up in the oversold region.
In case of a slide below the multi-month low, the next support would come from the 56.30 level, taken from the low in October 2017. Should prices decline further, the focus shifts to 54.83, where it bottomed in October 2017 as well, increasing chances for a new strong bearish tendency.
On the opposite, if the price continues the weak upside movement, it would challenge again the 60.35 – 61.70 resistance zone, before being able to re-touch the 64.60 barrier. A significant leg above these levels could push prices towards the 20-day simple moving average (SMA), which stands around 65.85.
Overall, Brent seems to be strongly bearish over the last almost two months following the pullback on the 86.71 high.
Sunset Market Commentary
Markets
Global core bonds record gains in a daily perspective, but they mainly occurred during Asian trading (US Treasuries) or in the European opening (German Bund). Fed chair Powell’s comments were all over the place, but we warned about over interpreting them. We merely think of them as a correction to his out-of-line October declaration that the policy rate was still way out of neutral levels. Current market positioning, discounting only 1 additional hike in 2019, is too soft. Core bonds couldn’t build on those starting gains despite lower than expected German (CPI) and US (PCE) inflation numbers. US yields lose between 0.6 bps (2-yr) and 3.3 bps (10-yr) on a daily basis. German yields trade 0.9 bps (2-yr) to 2.2 bps (10-yr) lower. 10-yr yield spread changes vs Germany are slightly narrower with Greece outperforming (-4 bps).
Global (FX) investors tried to make up their mind today on yesterday’s presumed ‘change in guidance’ from Fed-chairman Powell. The EUR/USD cross rate is looking for a new equilibrium in the upper half of the 1.13 big figure. The pair came close to the 1.14 barrier this morning, but the euro lost temporarily ground (tentatively below consensus German CPI?). The US currency came again under pressure and revisited the 1.14 big figure after the publication of the US spending in income data. Spending and income growth were above consensus in October. However, the core PCE deflator was slightly softer than expected at 1.8% (1.9% was expected). The soft inflation figure, at the margin, can be considered as reinforcing the case of the Fed slowing the pace of policy normalization. Interest rate differentials also narrowed slightly further in the disadvantage of the dollar. EUR/USD is changing hands in the 1.1375 area. This is a loss of one big figure for the dollar compared to yesterday. However in an intraday perspective, the US currency didn’t lose that much interest rate support anymore. USD/JPY also drifted further south and settled in the 112.20/40 area.
Sterling also remained under pressure both against the euro and the dollar. The positive global risk sentiment in the wake of the Powell comments this time didn’t help sterling. Over the previous days, sterling entered some kind of wait-and-see pattern as even as markets were well aware that that an approval of the Brexit deal in the UK Parliament would be very difficult. The UK currency lost further ground today, as UK PM May warned members of a committee of Parliament that voting down her deal on December 11 contains the risk of no deal at all. EUR/GBP jumped north of 0.89, but trades currently again near this big figure. Cable dropped back below the 1.28 mark, despite broad underlying USD weakness.
News Headlines
The Swedish economy contracted unexpectedly in Q3. The economy shrank -0.2% QoQ while markets expected a 0.2% expansion. Q2 growth has also been revised downwardly (from 0.8% to 0.5% QoQ). Growth slowed to 1.6% (2.2% expected) on an annual basis, down from an upwardly revised 2.7% YoY.
After signaling the possibility of early repayments already in October this year, the Portuguese government plans to pay back all of its 4.6b debt to the IMF by the end of 2018. The prime minister Costa praised his government’s fiscal approach that made the repayment possible while still supporting growth.
Inflation data fell short of expectations. German HICP experienced an oil driven fall from 2.4% to 2.2% YoY while markets expected a softer landing at 2.3% YoY. US PCE core inflation ebbed from a downwardly revised 1.9% to 1.8% YoY (vs. 1.9% expected). The Fed’s favorite inflation gauge (PCE deflator) stabilized at 2.0% YoY while a small uptick was expected. On a brighter note, US income and spending data topped expectations while EMU economic confidence fell a little less (109.5) than anticipated (109.1).
EUR/USD Mid-Day Outlook
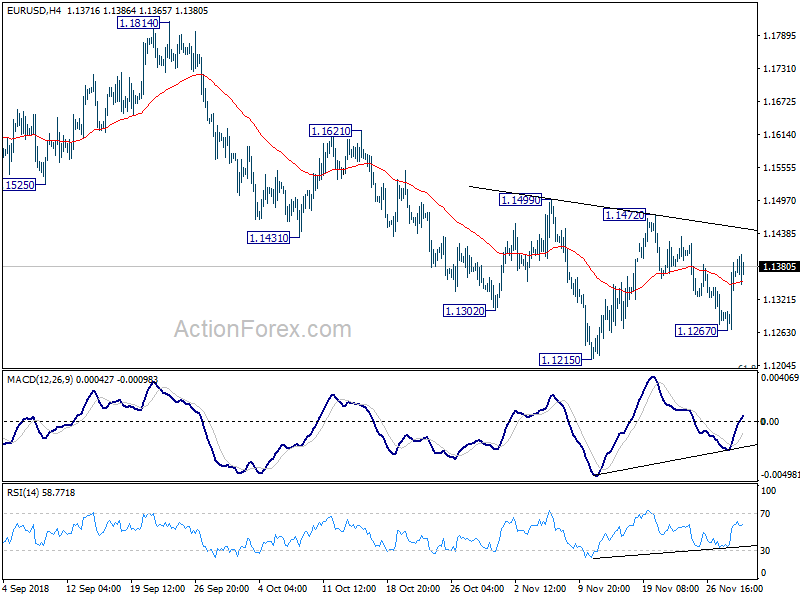
Daily Pivots: (S1) 1.1290; (P) 1.1341; (R1) 1.1417; More.....
Intraday bias in EUR/USD remains neutral first. And, focus is now on 1.1472 resistance. Decisive break there will complete a head and shoulder bottom pattern (ls: 1.1302; h: 1.1215; rs: 1.1267). That will indicate near term reversal and bring stronger rise back to 1.1814 resistance. On the downside, below 1.1267 will turn bias back to the downside for 1.1215 low.
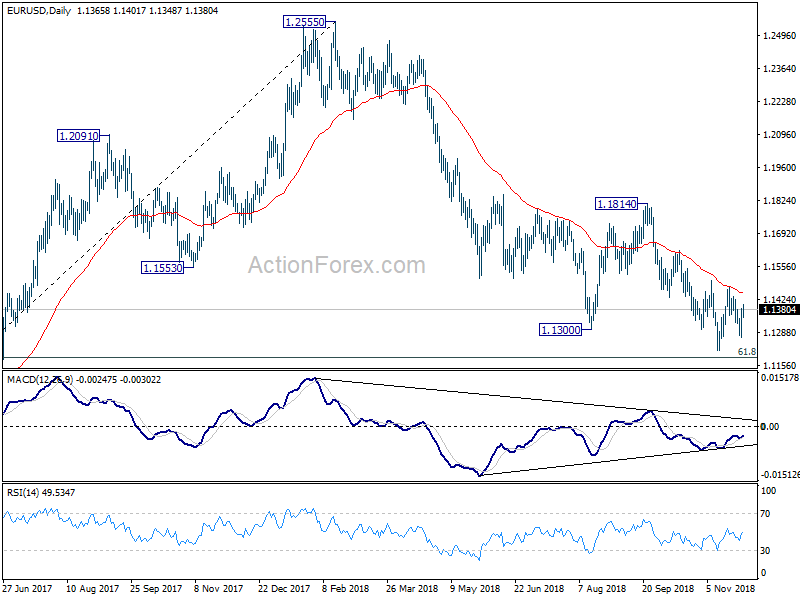
In the bigger picture, down trend from 1.2555 medium term top is still in progress and should target 61.8% retracement of 1.0339 (2017 low) to 1.2555 at 1.1186 next. Sustained break there will pave the way to retest 1.0339. On the upside, break of 1.1814 resistance is now needed to confirm medium term bottoming. Otherwise, outlook will stay bearish in case of strong rebound.
GBP/USD Mid-Day Outlook
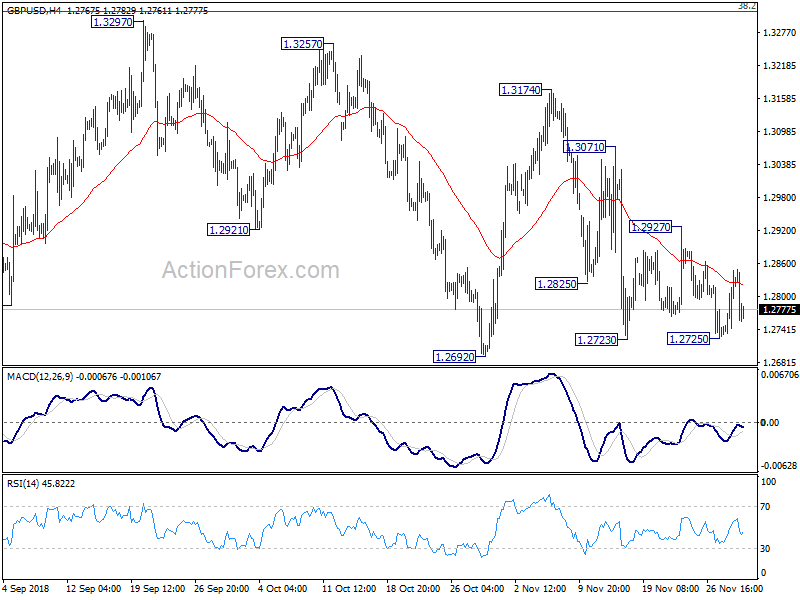
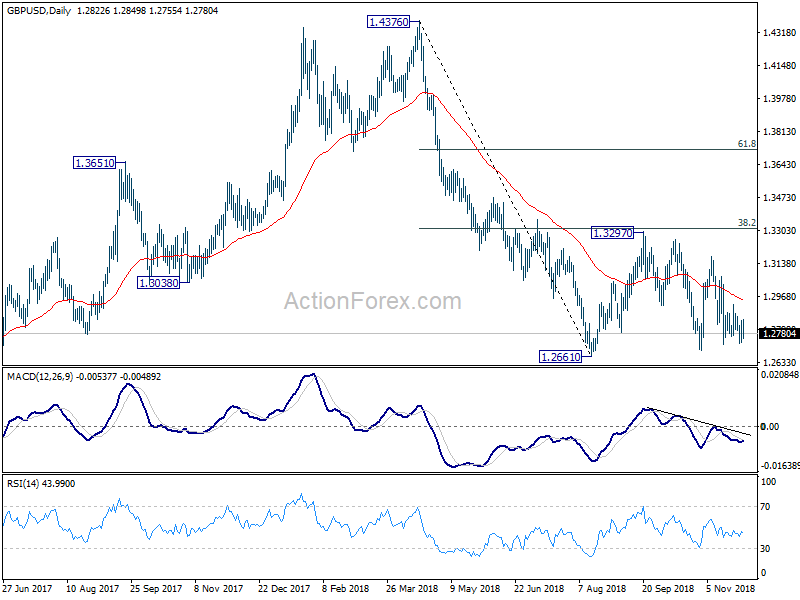
Daily Pivots: (S1) 1.2744; (P) 1.2795; (R1) 1.2876; More...
GBP/USD is staying in tight range and intraday bias remains neutral for the moment On the upside, above 1.2927 resistance will bring stronger rebound to 1.3071 and possibly above. On the downside, break of 1.2725 should extend recent fall to retest 1.2661 key support. After all, price actions from 1.2661 are viewed as a consolidation pattern. Even in case of strong rebound, upside should be limited by 1.3316 fibonacci level to bring down trend resumption eventually.
In the bigger picture, whole medium term rebound from 1.1946 (2016 low) should have completed at 1.4376 already, after rejection from 55 month EMA. The structure and momentum of the fall from 1.4376 argues that it's resuming long term down trend. And this will be the preferred case as long as 38.2% retracement of 1.4376 to 1.2661 at 1.3316 holds. However, firm break of 1.3316 would bring stronger rebound to 61.8% retracement at 1.3721. And, the eventual depth of the fall from 1.4376, and the chance of hitting 1.1946 low, will depend on the strength of the interim corrective rebound from 1.2661.
USD/JPY Mid-Day Outlook
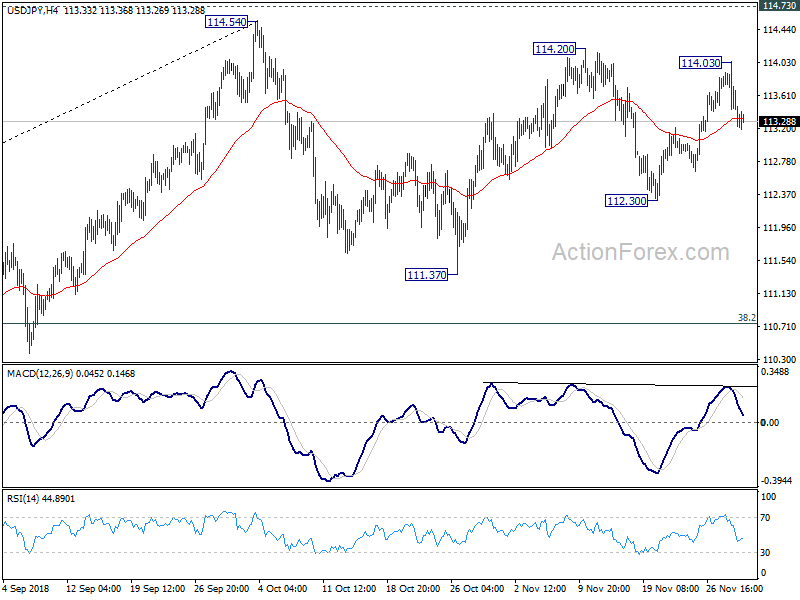
Daily Pivots: (S1) 113.41; (P) 113.73; (R1) 114.00; More..
Intraday bias in USD/JPY remains on the downside at this point. Rebound from 112.30 should have completed at 114.03. Deeper decline would be seen back to 112.30 first. Break there will target 111.37 and possibly below. On the upside, above 114.03 will target a test on 114.54/73 key resistance zone. Overall, price actions from 114.54 are seen as a consolidation pattern. Hence, even in case of deep decline, downside should be contained by 38.2% retracement of 104.62 to 114.54 at 110.75 to bring rebound.
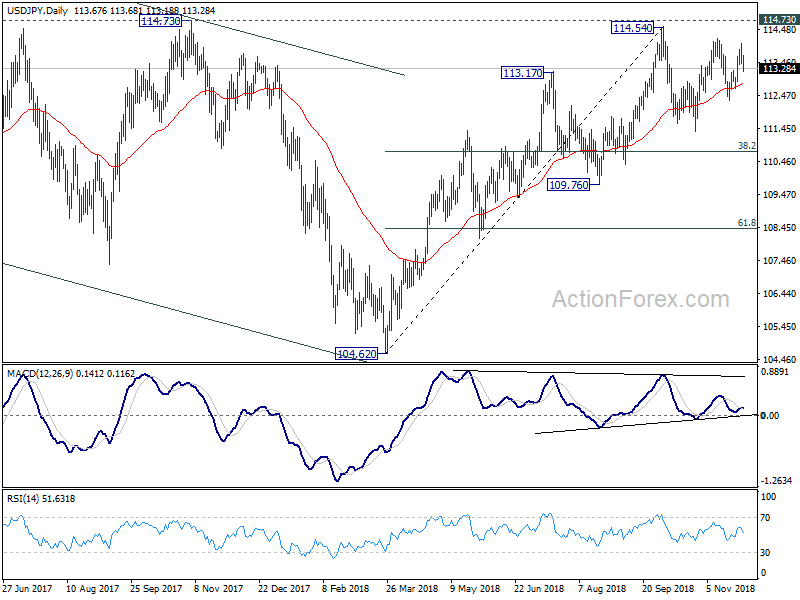
In the bigger picture, corrective fall from 118.65 (2016 high) should have completed with three waves down to 104.62. Decisive break of 114.73 resistance will likely resume whole rally from 98.97 (2016 low) to 100% projection of 98.97 to 118.65 from 104.62 at 124.30, which is reasonably close to 125.85 (2015 high). This will stay as the preferred case as long as 109.76 support holds. However, decisive break of 109.76 will dampen this bullish view and turns outlook mixed again.
US: Solid Spending Growth and Limited Inflation – What’s Not to Like?
Personal income rose 0.5% in October (month-on-month), beating the consensus forecast for 0.4%. Personal spending was up a robust 0.6%, also above expectations.
Prices were up 0.2% month-on-month and 2.0% year-on-year. Core prices (excluding food and energy) rose 0.1%, but decelerated on a year-on-year basis to 1.8% (from a downwardly revised 1.9% in September).
Removing price growth, real spending was up 0.4% in October (but from a downwardly revised 0.1% in September). Strength in spending was widespread with services leading the way (+0.5%), followed by durable goods (+0.4%), and non-durables (+0.3%).
The personal saving rate edged down to 6.2% (from an upwardly revised 6.3% in September).
Key Implications
Downward revisions to previous months soften the profile a bit, but October's strong growth leaves consumer spending in good stead for another 3% or more outturn in the fourth quarter of the year. The fall in gasoline prices will leave more in the tank for consumers to spend this holiday season, even as volatility in financial markets tempers some of this cheer.
The inflation reading in today's report is just as important as the spending and income data. Inflation has done a whole lot of nothing over the past several months and October was no exception. After much hurrah about the core rate hitting the Fed's 2% target, it has since slipped off it and it looks to spend the next several months below it. Indeed, core price growth is averaging just 1.2% on a three-month-moving average basis. This should give the Federal Reserve pause. While it is likely not sufficient to stall a December rate hike, it certainly puts downside risks to the number of hikes in 2019.
USD/CHF Mid-Day Outlook
Daily Pivots: (S1) 0.9905; (P) 0.9956; (R1) 0.9986; More...
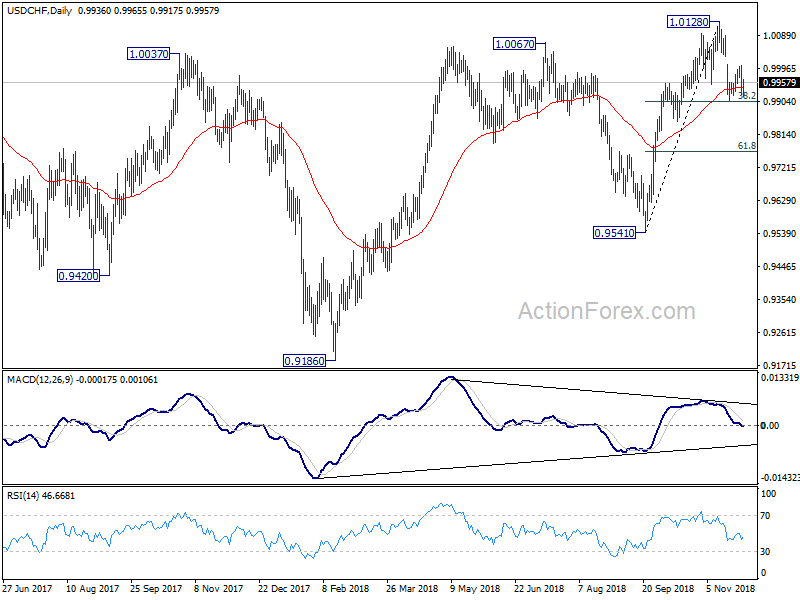
USD/CHF recovers ahead of 0.9908 support and intraday bias remains neutral at this point. On the downside, break of 38.2% retracement of 0.9541 to 1.0128 at 0.9904 will resume the fall from 1.0128 to 0.9848 key support level. Break there will indicate near term reversal and target 61.8% at 0.9765. On the upside, break of 1.0006 will argue that the pull back from 1.0128 has completed. Intraday bias will be turned back to the upside for retesting 1.1028.
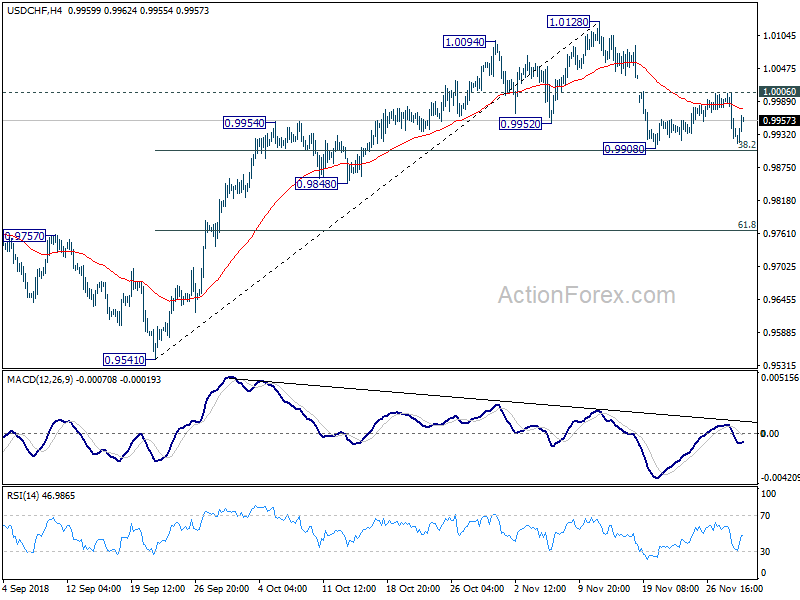
In the bigger picture, rise from 0.9541 could have topped at 1.0128. But as long as 0.9541 support holds, we'd still expect rise from 0.9186 to resume at a later stage. Break of 1.0128 will target 1.0342 key resistance. However, break of 0.9514 will pave the way back to 0.9186 low.