Sample Category Title
GBPUSD Intraday Analysis
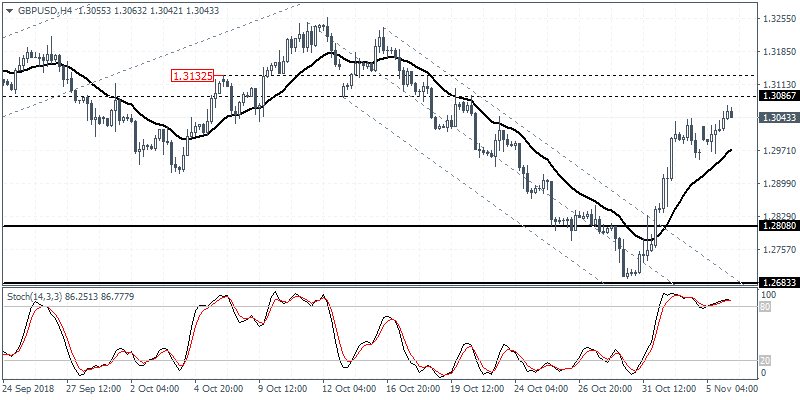
GBPUSD (1.3043): The British pound was seen maintaining the gains after opening on Monday gapping higher. After a quick fill of the gap, prices resumed the upside moment. The GBPUSD is now seen trading close to the previously breached support area of 1.3086. A retest of these level as resistance could establish a wide sideways range. A close above 1.3086 is required for the GBPUSD to seek further gains
EURUSD Intraday Analysis
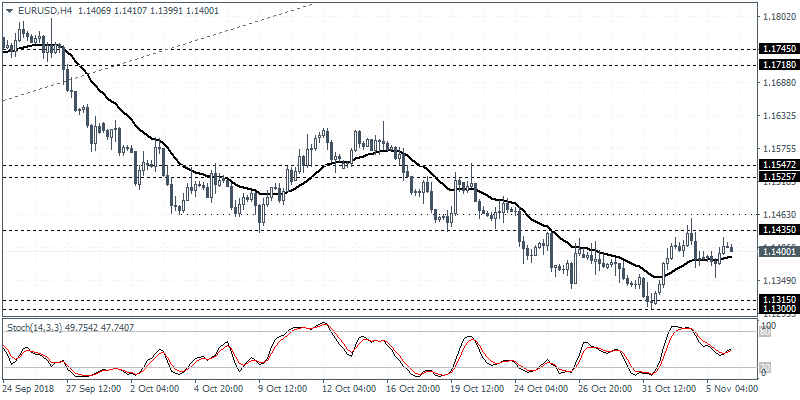
EURUSD (1.1400): The EURUSD currency pair was seen trading subdued on Monday. Price action attempted to rally back to the previous resistance area of 1.1435 region before currently pulling back lower. The 20-period EMA is seen offering dynamic support for the moment. However, a close below the 20-period EMA could keep the EURUSD biased to the downside.
U.S. Congressional Elections Due Today
The markets were seen trading a bit subdued on Monday as investors brace for the U.S. mid-term elections due today. On the economic front, China's Caixin services PMI was seen easing to 50.1 which missed estimates and was slower than 53.1 registered the month before.
In the Eurozone, the Sentix investor confidence index eased to 8.8 below estimates of 9.9. The services activity in the UK measured by Markit was also weaker at 52.2 for October.
The NY trading session saw the ISM non-manufacturing PMI easing to 60.3 which was higher than expected. However, the October's print was a tad weaker from 61.6 measured the month before.
The RBA held its monetary policy meeting earlier today. As widely expected, the central bank left interest rates unchanged at 1.50%. The central bank is expected to leave its monetary policy unchanged at least into the first half of next year.
The European trading session kicks off with the German factory orders report. Data is expected to show that German factory orders fell 0.4% on the month following a 2.0% surge previously.
Markit's final services PMI will be coming out later in the day. The Eurozone services PMI is expected to remain steady at 53.3.
The U.S. will be heading to the polls today for the mid-term Congressional elections. This is expected to bring some volatility to the markets.
Later in the evening, the overnight session will see the release of the quarterly employment report from New Zealand.
GBPUSD Strongly Bullish Above 1.3040
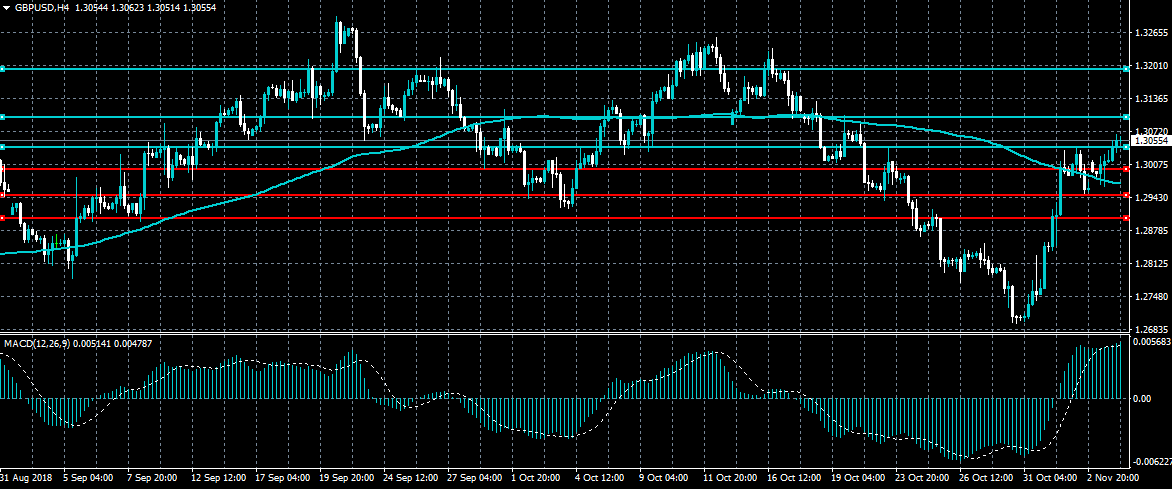
The British pound has moved to a fresh two-week trading high against the US dollar, with buyers breaking above the important 1.3040 level. The GBPUSD pair is strongly bullish while trading above the 1.3040 level and is increasingly likely to challenge the 1.3100 resistance level. Technical indicators are still rising across the one and four-hour time frames, supporting bullish momentum.
The GBPUSD pair is strongly bullish while trading above the 1.3040 level, key resistance is now found at the 1.3100 and 1.3200 levels.
If the GBPUSD pair moves below the 1.3040 level, sellers may test towards the 1.3000 and 1.2965 support levels.
US Dollar Pauses Ahead Of US Mid-Term Elections
The US dollar index was little moved in the Asian session ahead of the US mid-term elections. These elections have been referred to by commentators as the most important in modern times. This is because a loss by the President’s party is likely to have a significant impact on the country and the financial market. For example, Democratic leaders have pledged to reverse the tax cuts that were passed by the Trump administration.
The Japanese yen weakened slightly against the USD after government data showed falling household spending. In October, spending fell by minus 1.6%. This was the lowest level since June this year when spending declined by an annualized rate of minus 3.9%. On a MoM basis, spending declined by minus 4.5%, which was worse than the minus 1.8% that traders were expecting. While the Japanese economy is doing well, policymakers have found it difficult to stimulate consumer spending and inflation.
The Australian dollar was little moved against the USD after the RBA made its interest rates decision. The bank left interest rates unchanged at 1.5%. In the accompanying statement, RBA Governor Philip Rowe, said that the economy was doing well with the unemployment rate being at the lowest level in 6 years. In the third quarter, the economy expanded by 3.4%. The bank also revised the forecast for the economy for 2019 and 2020. It expects the economy to grow by 3.5% in 2019 and then to slow slightly the following year. Regarding interest rates, the bank said the following:
The low level of interest rates is continuing to support the Australian economy. Further progress in reducing unemployment and having inflation return to target is expected, although this progress is likely to be gradual. Taking account of the available information, the Board judged that holding the stance of monetary policy unchanged at this meeting would be consistent with sustainable growth in the economy and achieving the inflation target over time.
EUR/USD
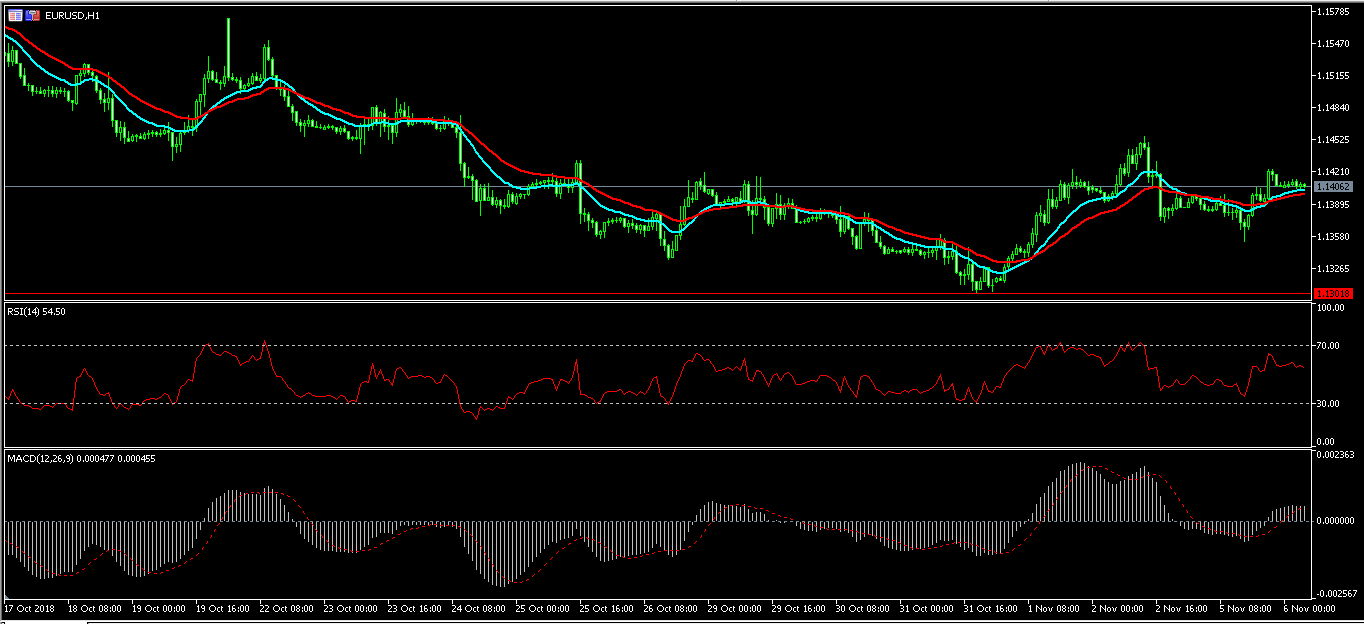
The EUR/USD pair was unchanged in the Asian session ahead of the mid-terms and the Fed decision. The pair is currently trading at 1.1407, which is slightly higher than yesterday’s low of 1.1352. The 15-day and 30-day EMA are neutral, which is an indication that the pair could move in either direction. This is also proven by the RSI which is currently at 54 and the MACD as shown below. This means that the pair could breakout in either direction.
AUD/USD
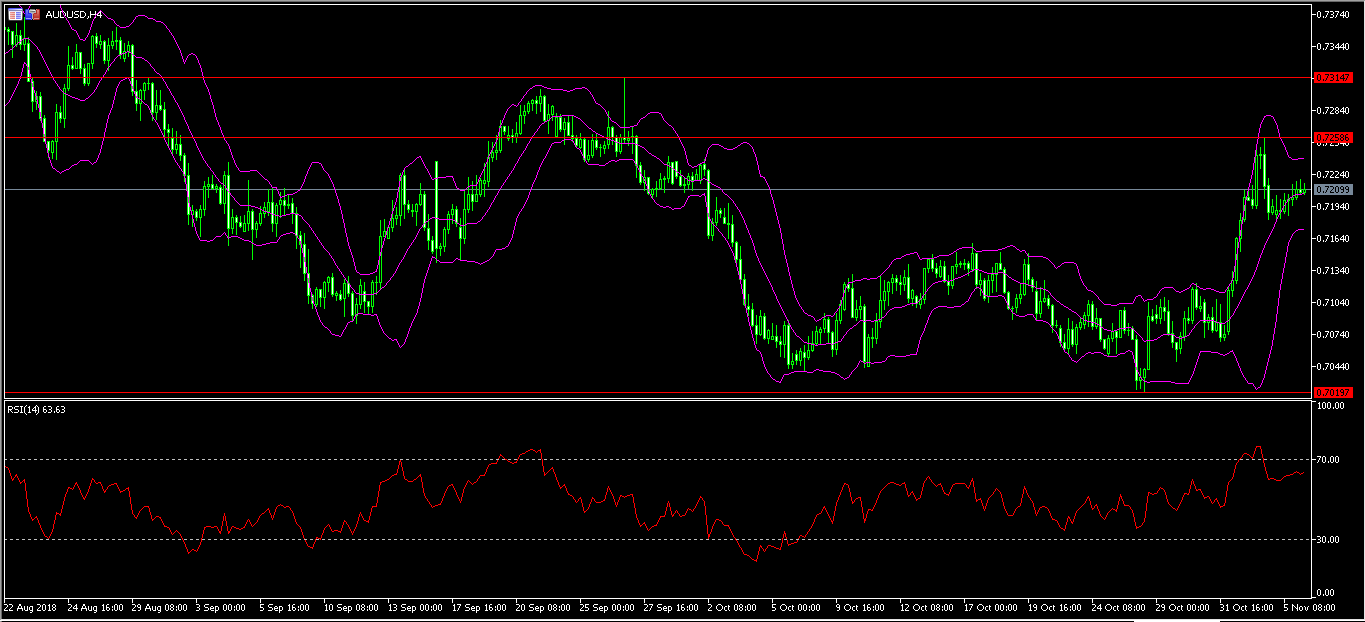
This month, the AUD/USD pair has moved from 0.7065 to a month-to-date high of 0.7260. This is a 2.7% gain. Today, the pair moved up slightly after the RBA left interest rates unchanged as expected. It is now trading at 0.7210. This level is along the middle band of the Bollinger Bands as shown below. On the four-hour chart, the RSI has moved from 72 to the current 63. The next major movements will likely happen overnight today as results from the US mid-term elections start to stream in.
GBP/USD
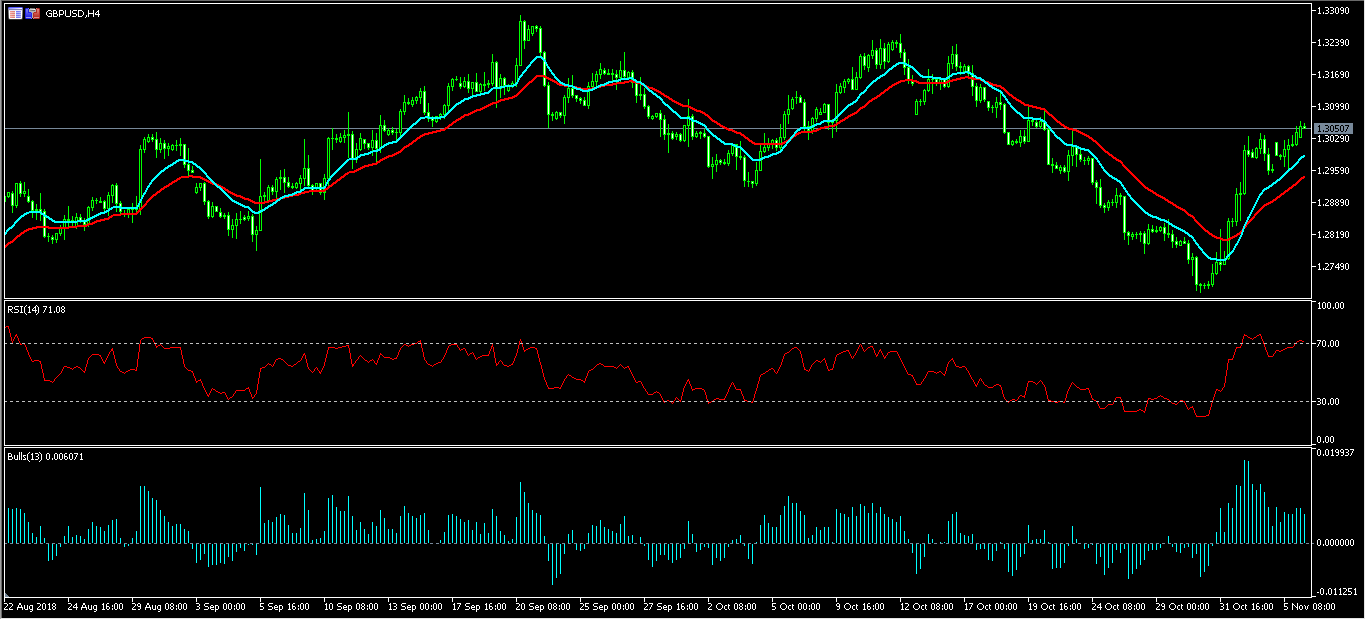
The GBP/USD pair rose in the Asian session after data from the British Retail Consortium (BRC) showed an improvement in retail sales. It reached an intraday high of 1.3067, which was the highest level since October 24. The double EMA shows that the pair will likely continue the upward momentum. The RSI has risen to above 70. However, the strength of the Bulls Power has weakened signaling that the upward trend will likely not be as strong going forward.
GBPUSD Still Runs Higher Finding Resistance At 23.6% Fibonacci
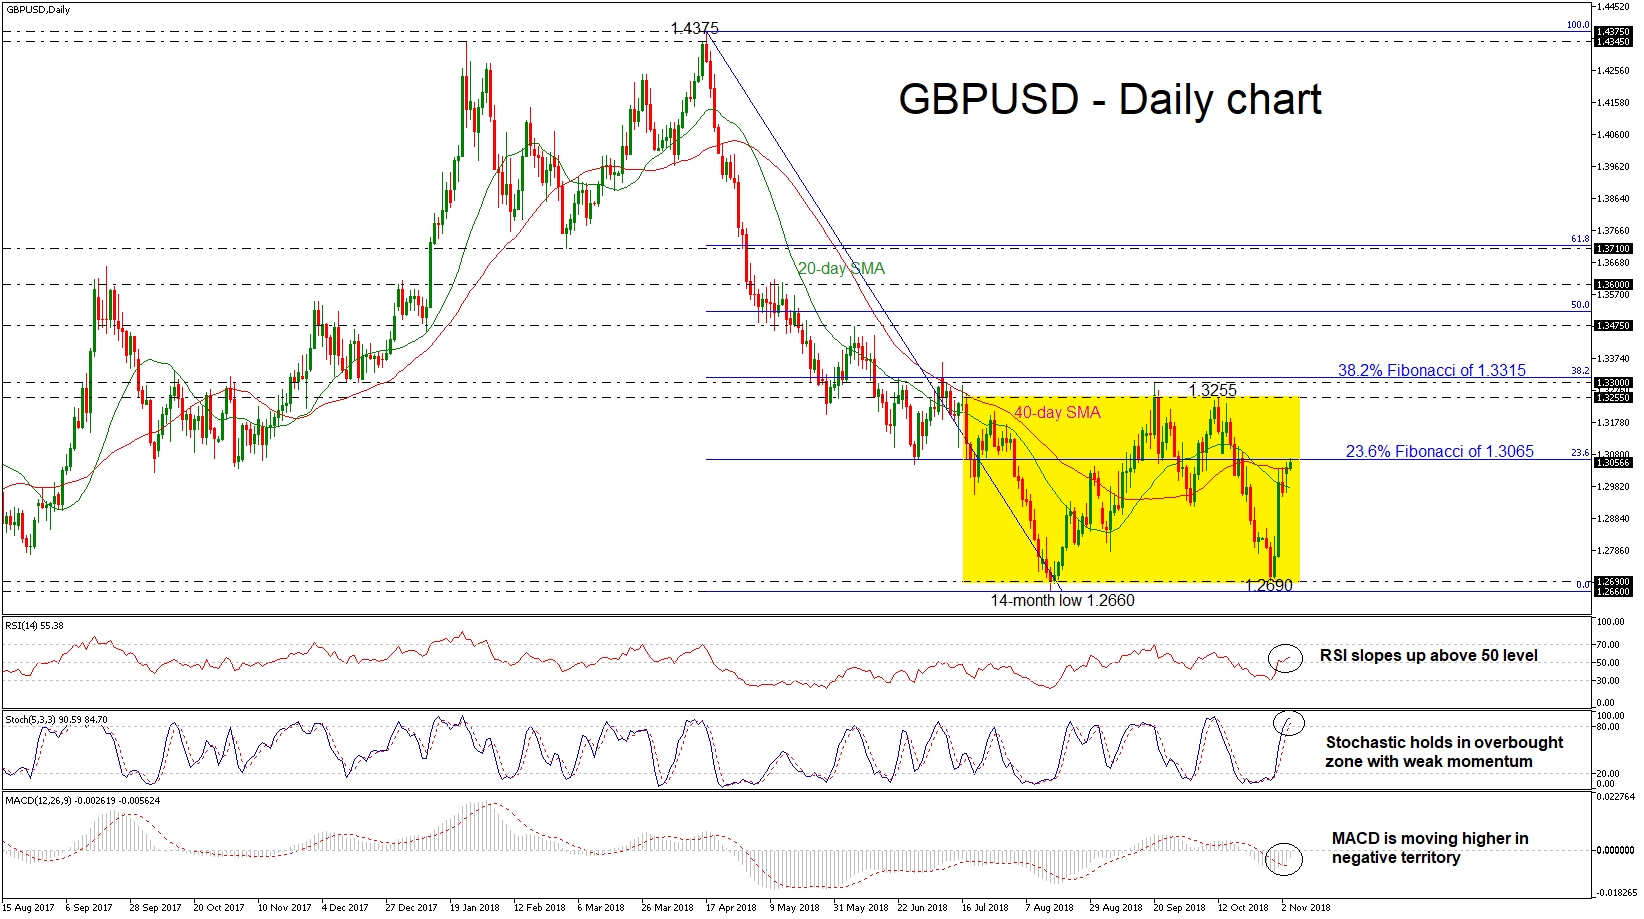
GBPUSD had an impressive bullish rally in the preceding week, while it continues the run, touching the 23.6% Fibonacci retracement level of the downleg from 1.4375 to 1.2690, near 1.3065, earlier today. Also, cable surpassed the 20- and 40-simple moving averages (SMAs) in the daily timeframe, confirming the recent upside movement.
Momentum indicators are pointing to a positive bias in the short term with the RSI heading upwards above the threshold of 50 and the MACD strengthening its upside momentum in the negative territory. However, the stochastic oscillator holds in the overbought zone but with weak momentum as its turning slightly to the downside.
In the event of further improvement above the 23.6% Fibonacci mark, the way could open towards the 1.3255 resistance level, taken from the latest highs on October 12. A break above this level would re-challenge the 1.3300 – 1.3315 zone, identified by the peak on September 20 and the 38.2% Fibonacci region.
Should prices stop around the 23.6% Fibonacci and reverse lower, immediate support could come from the 20-SMA of 1.2975. Below that, the 1.2690 is the next major barrier for the bears, where any violation would shift bias back to negative. Slightly below this level, the price could slip until the 14-month low of 1.2660, achieved on August 15.
Having a look at the longer picture, GBPUSD creates a descending structure, however, in the short-term the price is in consolidation almost four months, with upper boundary the 1.3255 resistance and lower boundary the 1.2690 support level.
USD/JPY Last High In Rising Wedge Reversal Pattern
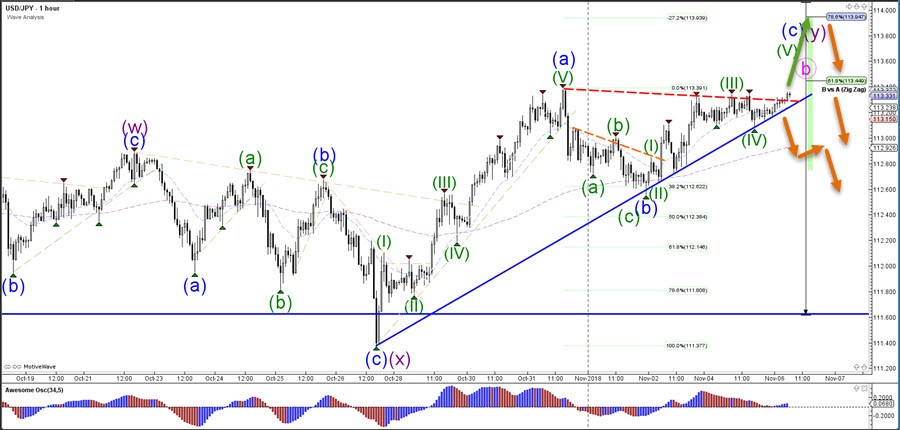
The USD/JPY is building a rising wedge reversal chart pattern but a break above the resistance trend line could still see a move up towards the 78.6% Fibonacciretracement level whereas a push below the support line (blue) could indicate a bearish breakout.
The USD/JPY wave pattern is indicating that the bullish price action will soon turn bearish as part of a larger ABC (pink) correction.
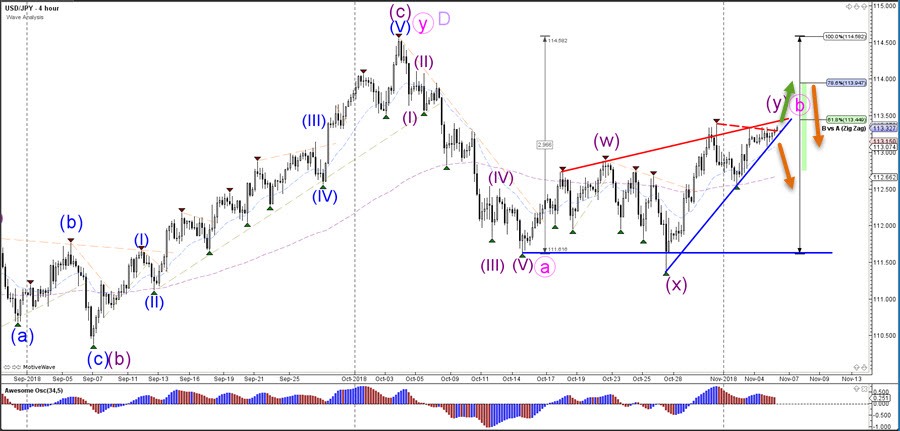 The USD/JPY bullish breakout could indicate a potential push towards the Fibonacci targets. A break below the support trend line could indicate an immediate reversal but a bear flag pattern after the break is important.
Cautious Mood Ahead Of U.S. Midterm Elections
Investors across the globe are keeping a close eye on today’s most expensive U.S. mid-term election on record. In less than 24 hours, American voters will have their say on how well they think President Trump has handled running the country. The three possible scenarios are a red wall, a blue wave, or a gridlock. But what markets have priced in so far is for Democrats to take control of the House of Representatives while Republicans to remain holding the Senate.
The combination of a Republican President and a split Congress have produced an average return of 15.7% on the S&P 500 in the 12months following every mid-term election since 1950. These strong returns suggest that investors prefer a gridlock, a situation when different political parties control the two legislative houses. While such anomalies are difficult to explain, investors may find that a gridlock produces more predictable political outcomes to model and value equities against. In the case of a gridlock, Democrats cannot roll back recent tax cuts, neither they can tighten the Dodd-Frank banking rules. It may just mean that Trump will facemore difficulties in passing new laws.
However, in the current tense environment it seems Wall Street will prefer Republicans to retain both legislative houses. That’s simply because a new tax cut will be expected to take place, further deregulation, and probably additional fiscal stimulus. While such measures are not necessarily good for the longer run as deficit and debt may get out of control, many investors will take advantage of these policies in the shorter run. Given that the polling industry got it wrong in 2016 and Trump became President, history may repeat itself this time again.
It would be more surprising if Democrats managed to win both houses. This will be a nightmare for Wall Street, as the Trump impeachment threat will become more real, but still, this would require help from some Republicans. Even if he doesn’t get impeached, the President will no longer have the power to pass bills and probably lead to pulling back some of his deregulatory actions, which definitely is not liked by corporate America.
USD/JPY Daily Outlook
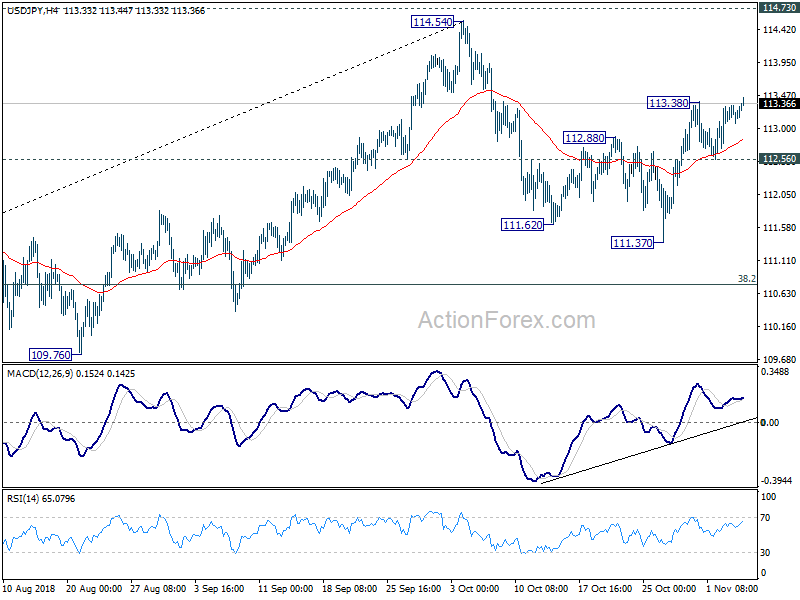
Daily Pivots: (S1) 113.07; (P) 113.20; (R1) 113.34; More..
Breach of 113.38 suggests USD/JPY's rebound from 111.37 is resuming. Intraday bias is back on the upside for 114.54/73 key resistance zone next. On the downside, break of 112.56 minor support will argue the the rebound has completed. And, in that case, the corrective pattern from 114.54 could have started the third leg for 111.37 support and possibly below.
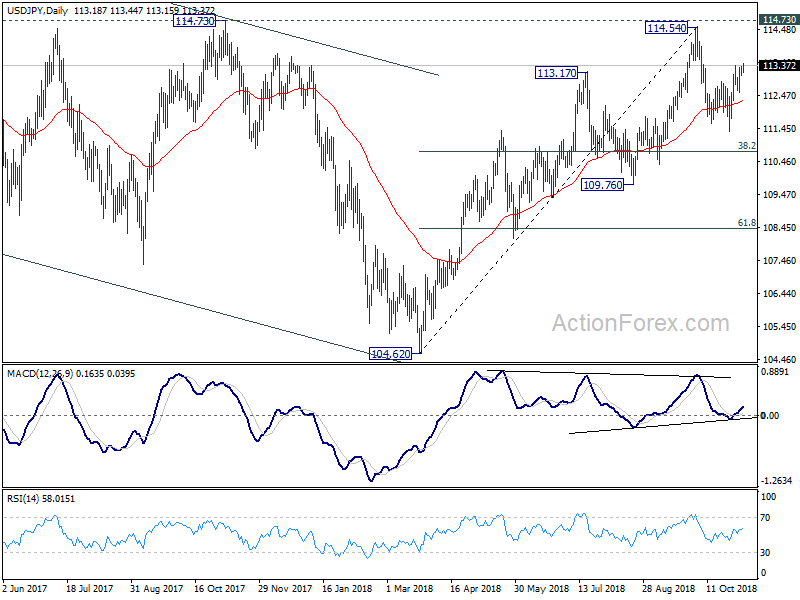
In the bigger picture, corrective fall from 118.65 (2016 high) should have completed with three waves down to 104.62. Decisive break of 114.73 resistance will likely resume whole rally from 98.97 (2016 low) to 100% projection of 98.97 to 118.65 from 104.62 at 124.30, which is reasonably close to 125.85 (2015 high). This will stay as the preferred case as long as 109.76 support holds. However, decisive break of 109.76 will dampen this bullish view and turns outlook mixed again.
EUR/USD Daily Outlook
Daily Pivots: (S1) 1.1368; (P) 1.1396; (R1) 1.1436; More....
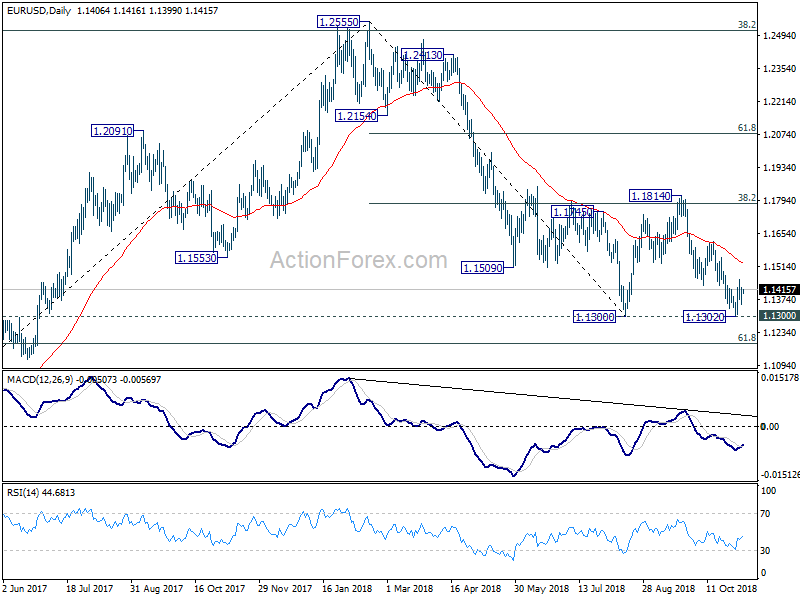
Intraday bias in EUR/USD remains neutral as it's still bounded in range of 1.1302/1455. On the upside, above 1.1455 will reaffirm that consolidation pattern from 1.1300 has started the third, rising leg. Further rise should be seen to 1.1621 resistance and above. But upside should be limited by 1.1814 to bring down trend resumption eventually. On the downside, break of 1.300 will resume whole down trend from 1.2555 and target 1.1186 fibonacci level next.
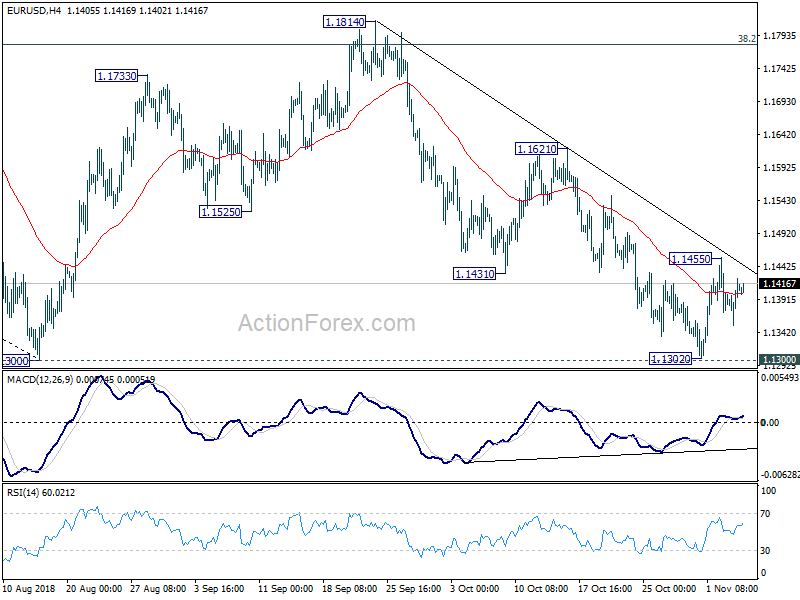
In the bigger picture, price actions from 1.1300 is seen as a corrective pattern. Decisive break of 1.1300 will resume the down trend from 1.2555 to 61.8% retracement of 1.0339 (2017 low) to 1.2555 at 1.1186 next. Sustained break there will pave the way to retest 1.0339. In case the consolidation from 1.1300 extends, upside should be limited by 1.1814 and 38.2% retracement of 1.2555 to 1.1300 at 1.1779. to bring down trend resumption eventually.