

Sample Category Title
AUDUSD Outlook: Sentiment Remains Positive Despite Unchanged RBA, Fresh Advance Faces Headwinds From Falling Daily Cloud
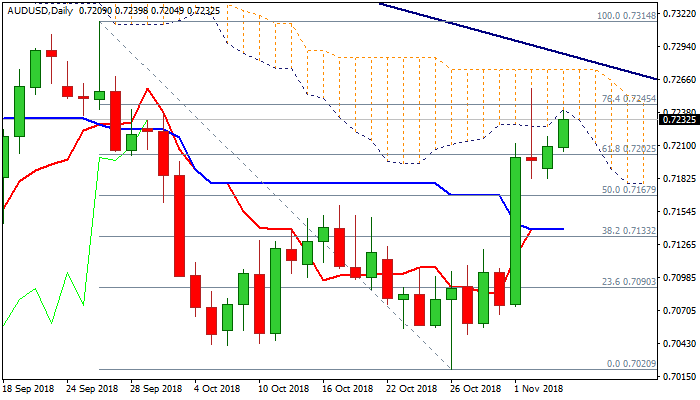
The Australian dollar stands at the front foot and attacks daily cloud base (0.7241) in extension of Monday's rally.
Bulls regained traction in European session after mild reaction on RBA in Asian trading, when the pair traded within 15-pips span after release.
The central bank kept interest rates unchanged at 1.5%, as expected, with the following statement showing no significant changes from the one in October.
Slightly improved RBA's growth forecast, boosted the sentiment, which resulted in acceleration towards cloud base, where the pair faces strong headwinds after last Friday's strong upside rejection.
Daily techs maintain strong bullish momentum and support the advance, which requires penetration of daily cloud and extension through falling 100SMA (0.7265) for fresh bullish signal, with lift and close above cloud top (0.7274) and trendline resistance (0.7285), needed to confirm bullish scenario.
On the other side, repeated rejection under falling daily cloud would weaken the sentiment, with return below broken falling 55SMA (0.7174), to shift near-term focus lower. Reaction on results of the US midterm election could be pair's key driver today.
Res: 0.7241, 0.7258, 0.7265, 0.7274
Sup: 0.7204, 0.7174, 0.7159, 0.7128
USDJPY Outlook: Bulls Continue To Face Strong Headwinds From Key 113.33 Barrier
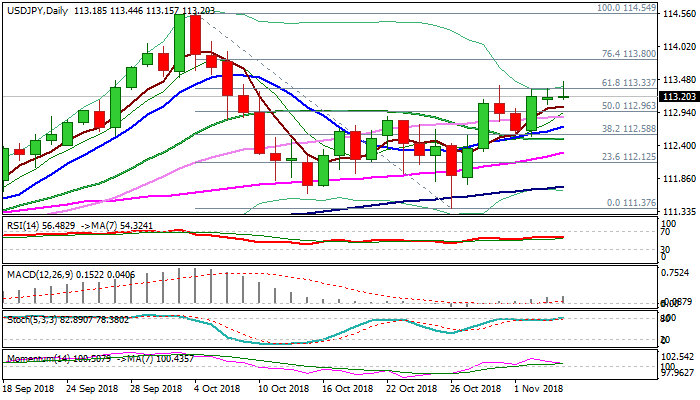
The pair holds positive tone and attacked again key barrier at 113.33 Fibo (61.8% of 114.54/111.37), following repeated failure here.
Fresh attempt higher posted new one-month high at 113.44 in early European trading on Tuesday (similar to the action in past two days), but lacks momentum for sustained break higher.
Recent action was supported by rising daily cloud, with long bullish weekly candle of the previous week, underpinning, but bulls continue to face strong headwinds at 113.33 barrier.
Multiple rejections could result in pullback, as momentum is weakening on daily chart and slow stochastic is overbought, but lack of firmer negative signals keeps scenario on hold for now.
Extended dips could be described as corrective and positioning for fresh upside while contained above daily cloud top (112.63).
Break and close within daily cloud would provide fresh bearish signal, which requires confirmation on sustained break below 20SMA (112.51).
On the other side, firm break above 113.33 pivot would signal bullish continuation and expose barriers at 113.80 (Fibo 76.4% of 114.54/111.37) and 114.10 (05 Oct high).
Results of US midterm elections are expected to provide fresh direction signals.
Res: 113.33, 113.44, 113.80, 114.10
Sup: 113.10, 112.86, 112.63, 112.51
Elliott Wave Analysis: Apple (AAPL) Close To Ending Correction
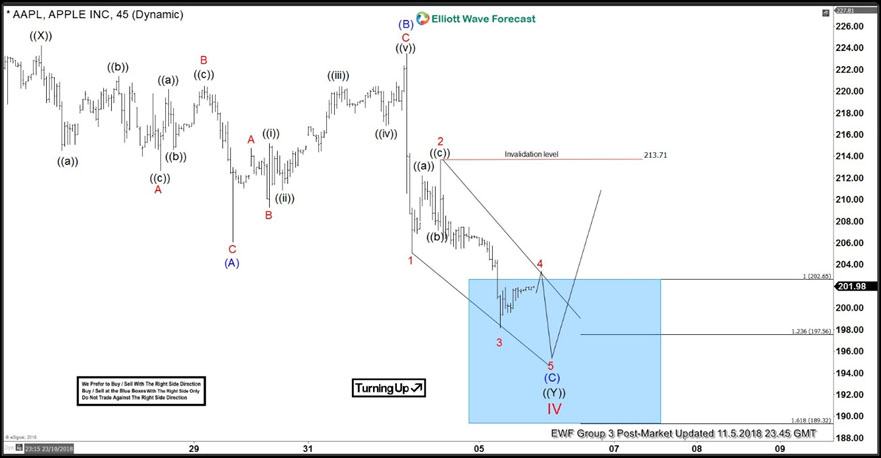
Apple (AAPL) short-term Elliott wave analysis suggests that the decline from $224.23 high, i.e. Primary wave ((X)), is unfolding as a Flat Elliot Wave structure. Down from $224.23, Intermediate wave (A) ended at $206.09, Intermediate wave (B) ended at $223.49, and Intermediate wave (C) is currently in progress.
Internal of Intermediate wave (C) is unfolding as a 5 waves diagonal. Down from $223.49, Minor wave 1 ended at $205.16, Minor wave 2 ended at $213.71, and Minor wave 3 ended at $198.17. Expect Apple to bounce in Minor wave 4 then extend lower 1 more leg in Minor wave 5 towards $189.32 – $197.56 to end a 5 waves down from $223.49 as a diagonal.
Once Apple ends the 5 waves down, it can also end Cycle degree wave IV and complete cycle from Oct 3 peak ($233.47). Afterwards, expect Apple to either rally to new high or at least bounce in larger degree 3 waves to correct the decline from Oct 3 peak. We don’t like selling Apple as it has reached the extreme area from Oct 3, as indicated in the blue box.
AAPL 1 Hour Elliott Wave Chart
The Analytical Overview Of The Main Currency Pairs
The EUR/USD currency pair
Technical indicators of the currency pair:
Prev Open: 1.13861
Open: 1.14066
% chg. over the last day: +0.09
Day's range: 1.13990 – 1.14246
52 wk range: 1.1299 – 1.2557
There is an ambiguous technical pattern on the EUR/USD currency pair. At the moment, the EUR/USD quotes are consolidating. Local levels of support and resistance are 1.14000 and 1.14250, respectively. Investors took a wait-and-see attitude before the midterm elections in the United States and the Fed's meeting. We recommend opening positions from key levels.
The news feed on 06.11.2018:
At 17:00 (GMT+2:00) the data on the number of open jobs in the JOLTS labor market will be published.
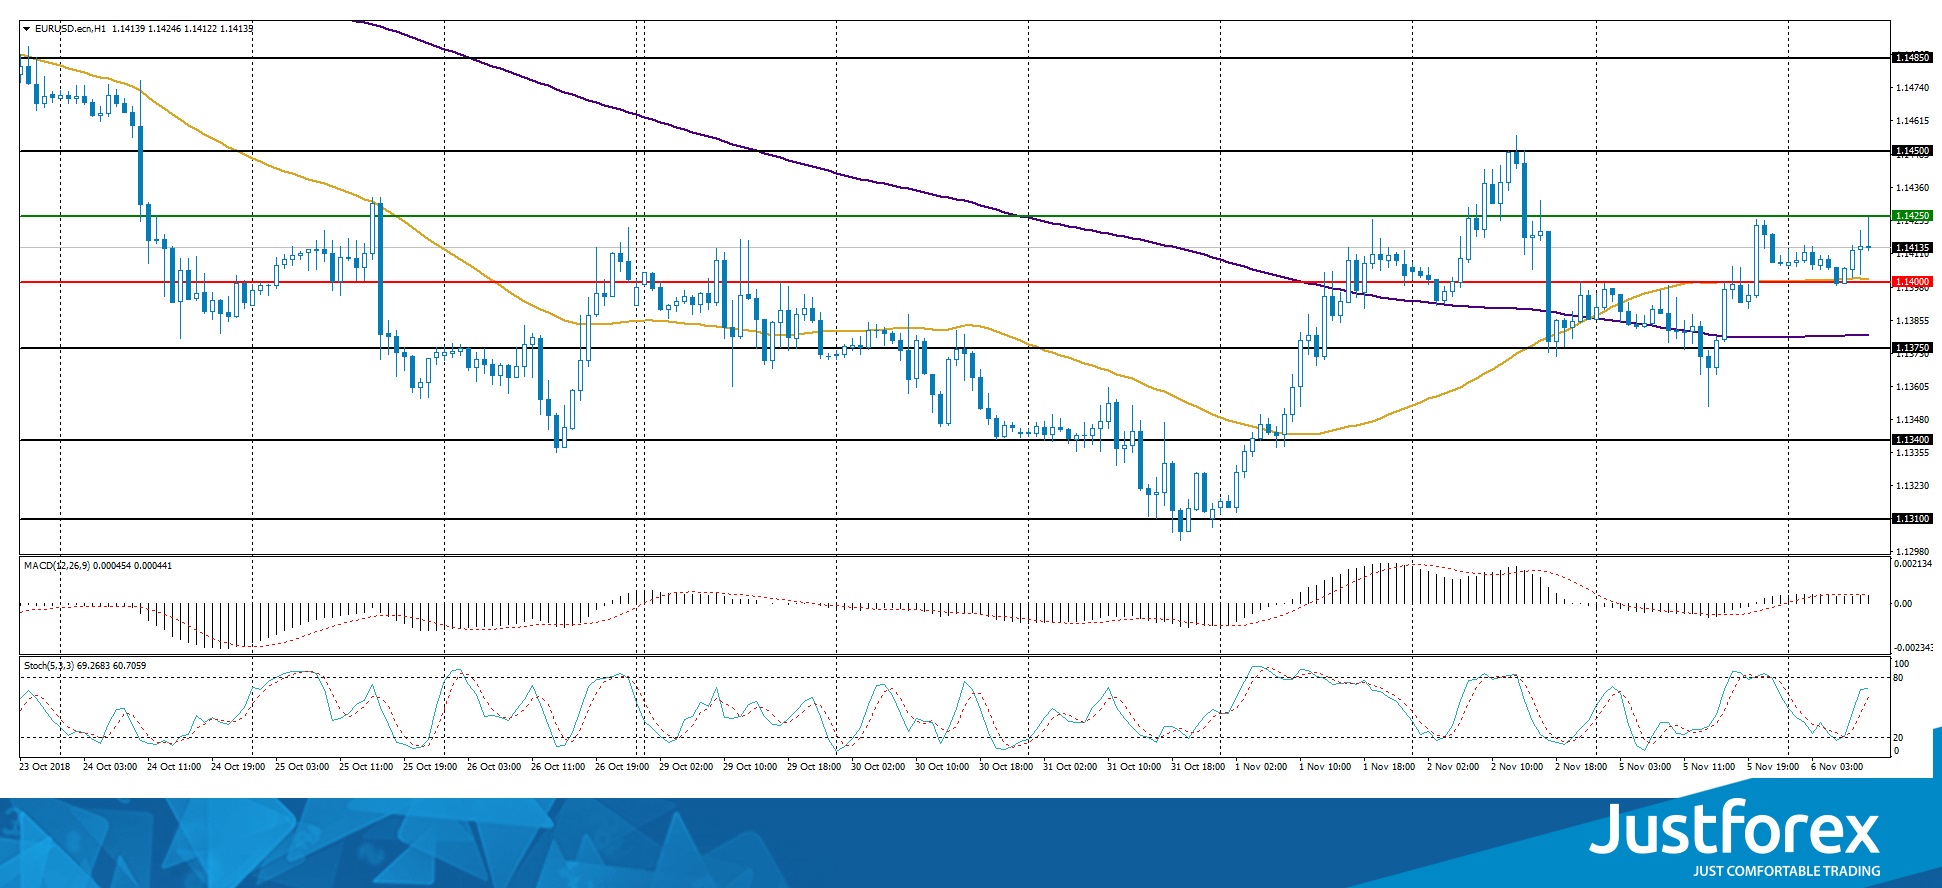
Indicators point to the power of buyers: the price has fixed above 50 MA and 200 MA.
The MACD histogram is in the positive zone, but below the signal line, which gives a weak signal to buy EUR/USD.
Stochastic Oscillator is in the neutral zone, the %K line is above the %D line, which indicates the bullish sentiment.
Trading recommendations
Support levels: 1.14000, 1.13750, 1.13400
Resistance levels: 1.14250, 1.14500, 1.14850
If the price fixes above the resistance level of 1.14250, the EUR/USD currency pair is expected to grow. The movement is tending to 1.14500-1.14800.
Alternative option. If the price fixes below 1.14000, you need to look for entry points to the market in order to open short positions. The movement is tending to 1.13750-1.13500.
The GBP/USD currency pair
Technical indicators of the currency pair:
Prev Open: 1.30215
Open: 1.30330
% chg. over the last day: +0.40
Day's range: 1.30289 - 1.30851
52 wk range: 1.2662 – 1.4378
The GBP/USD currency pair continues to show a positive trend. During yesterday's and today's trading, the growth of quotations exceeded 70 points. At the moment, the pound is testing a local resistance of 1.30800. The mark of 1.30300 is already a “mirror” support. Positive news about Brexit supports the demand on pound. Trading instrument is tending to grow.
The news feed on the UK economy is calm.
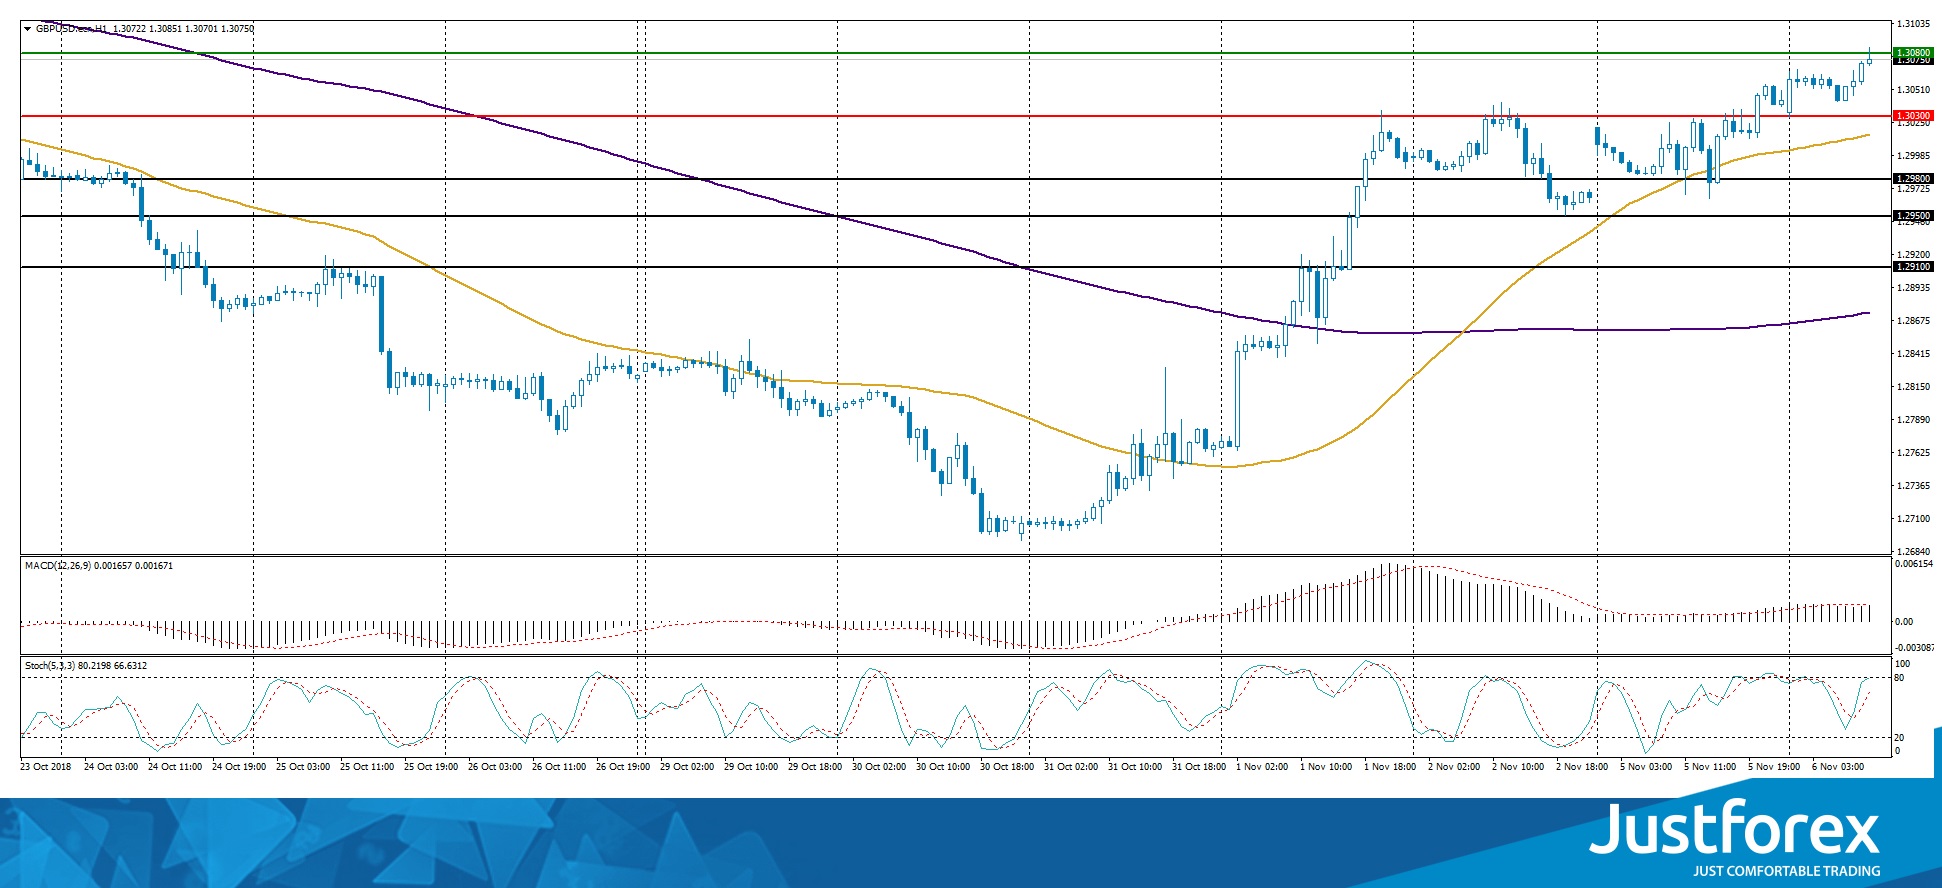
Indicators point to the power of buyers: the price has fixed above 50 MA and 200 MA.
The MACD histogram is in the positive zone and continues to rise, which gives a strong signal to buy GBP/USD
Stochastic Oscillator is in the neutral zone, the %K line is above the %D line, which indicates the bullish sentiment.
Trading recommendations
Support levels: 1.30300, 1.29800, 1.29500
Resistance levels: 1.30800, 1.31400
If the price fixes above the resistance level of 1.30800, further growth of the GBP/USD currency pair is expected. The movement is tending to 1.31200-1.31400.
An alternative could be a drop in the GBP/USD quotes to the level of 1.30000-1.29800.
The USD/CAD currency pair
Technical indicators of the currency pair:
Prev Open: 1.30879
Open: 1.31087
% chg. over the last day: +0.08
Day's range: 1.30943 - 1.31160
52 wk range: 1.2248 – 1.3387
The USD/CAD currency pair is still being traded in the flat. The technical pattern is ambiguous. The USD/CAD quotes are testing local support and resistance levels: 1.30850 and 1.31200, respectively. Positions must be opened from these marks. Investors expect additional drivers. We recommend paying attention to the news feed from the United States.
At 15:30 (GMT+2:00) data on building permits in Canada will be published.
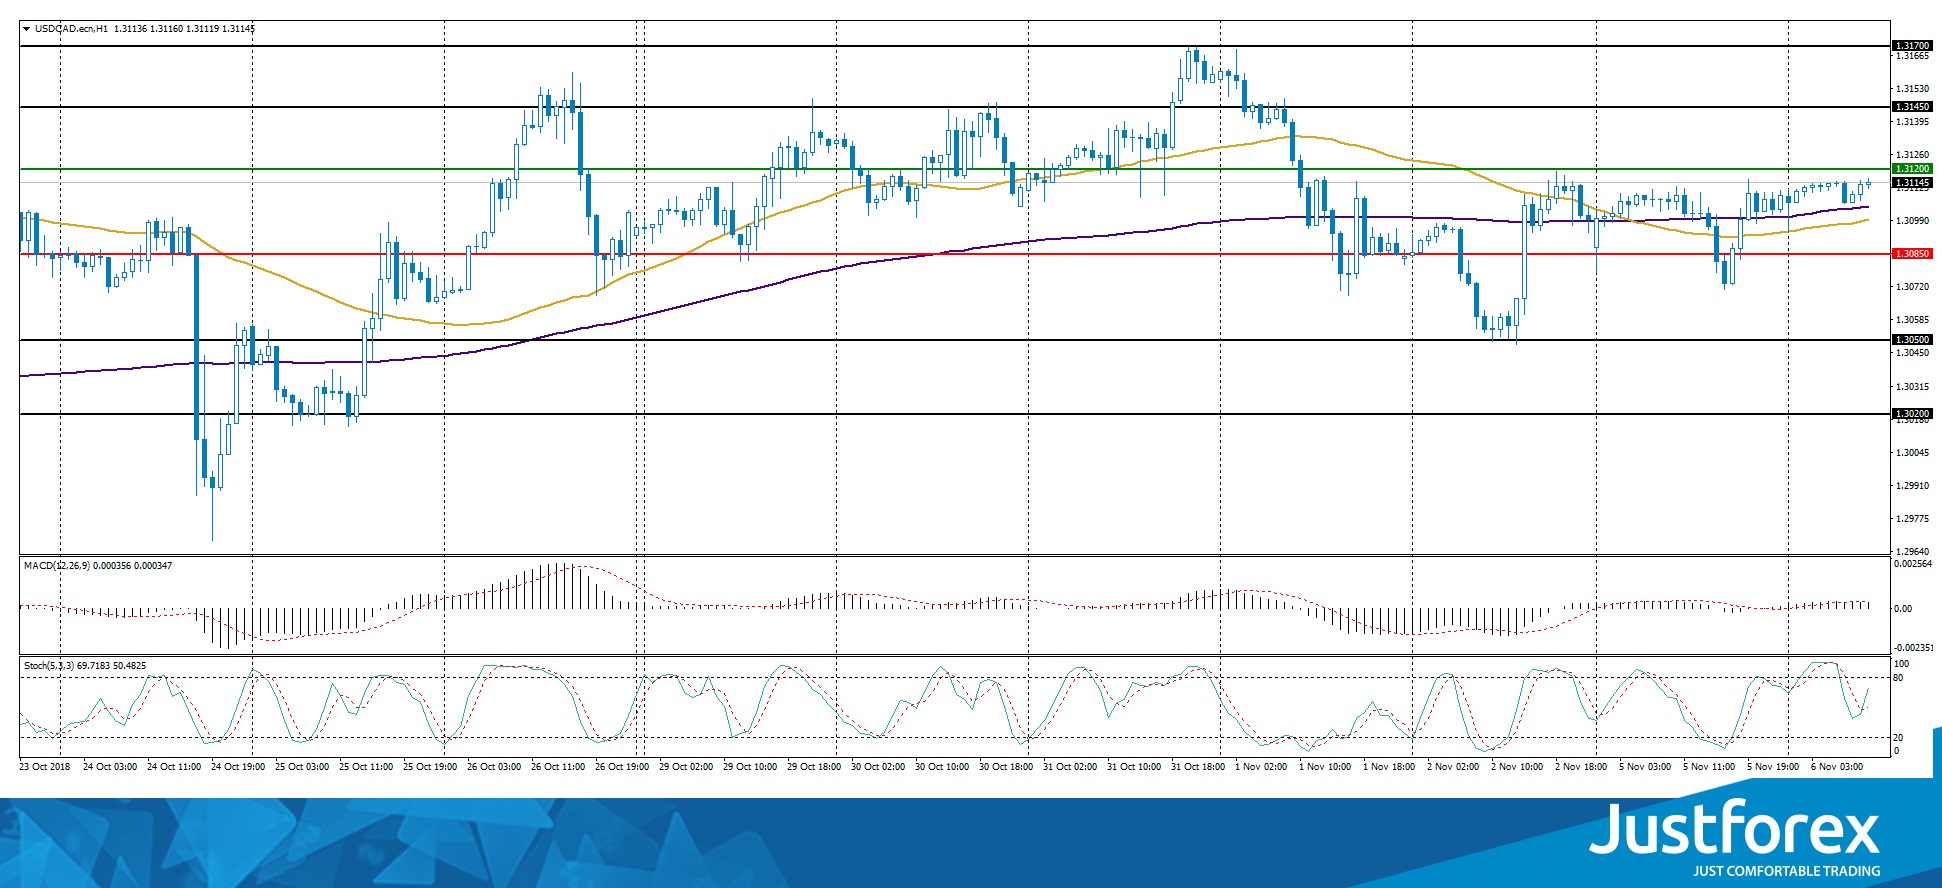
Indicators do not send accurate signals: 50 MA has crossed 200 MA.
The MACD histogram is in the positive zone, but below the signal line, which gives a weak signal to buy USD/CAD.
Stochastic Oscillator is in the neutral zone, the %K line has crossed the %D line. There are no signals at the moment.
Trading recommendations
Support levels: 1.30850, 1.30500, 1.30200
Resistance levels: 1.31200, 1.31450, 1.31700
If the price fixes below the support of 1.30850, the USD/CAD quotes are expected to fall. The movement is tending to 1.30500-1.30300.
An alternative could be the growth of the USD/CAD currency pair to the level of 1.31450-1.31700.
The USD/JPY currency pair
Technical indicators of the currency pair:
Prev Open: 113.148
Open: 113.192
% chg. over the last day: +0.12
Day's range: 113.161 - 113.446
52 wk range: 104.56 – 114.74
The USD/JPY currency pair is still in the flat. Unidirectional trend is not observed. Currently, the local support and resistance levels are: 113.100 and 113.400, respectively. Financial market participants expect additional drivers. We recommend paying attention to the news feed and the dynamics of US government bonds. Positions must be opened from key levels.
The news feed on the economy of Japan is quite calm.
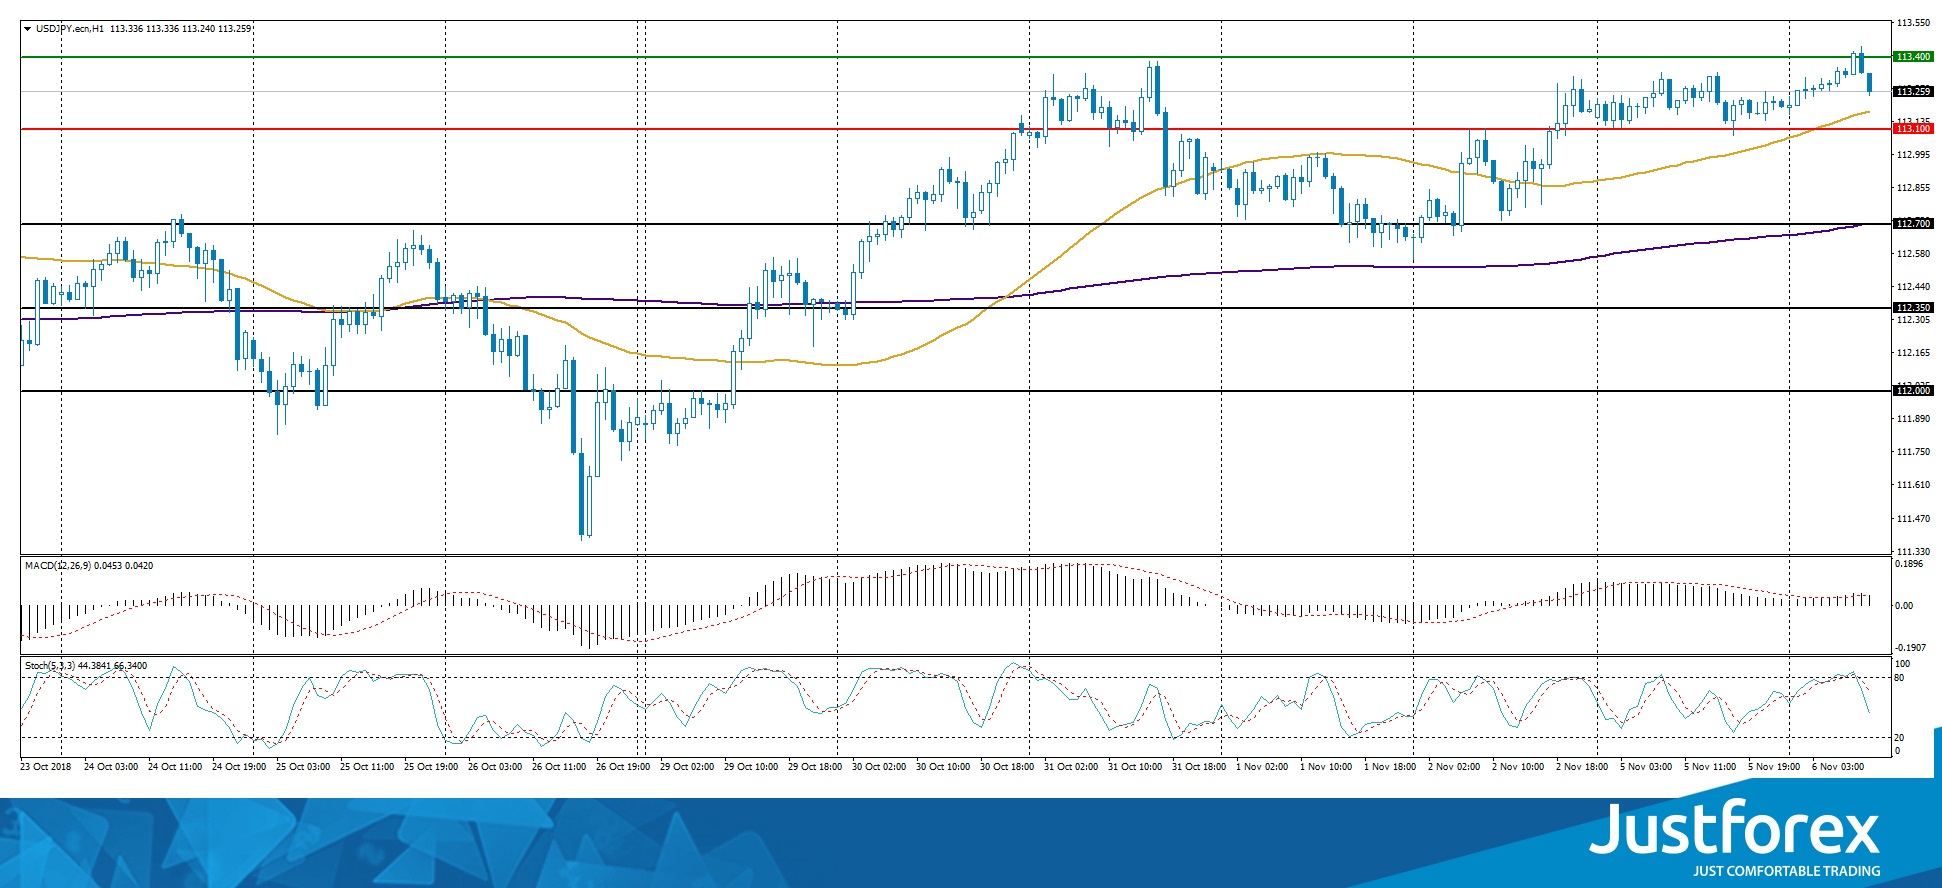
The price has fixed above 50 MA and 200 MA, which indicates the power of buyers.
The MACD histogram is in the positive zone, but below the signal line, which gives a weak signal to buy USD/JPY.
Stochastic Oscillator is in the neutral zone, the %K line is below the %D line, which indicates the bearish sentiment.
Trading recommendations
Support levels: 113.000, 112.650, 112.350
Resistance levels: 113.400, 113.700, 114.000
If the price fixes above the resistance level of 113.400, the growth of the USD/JPY quotes is expected. The movement is tending to 113.700-114.000.
An alternative could be a decrease in the USD/JPY currency pair to 112.700-112.500.
The USD Index Is In The Red
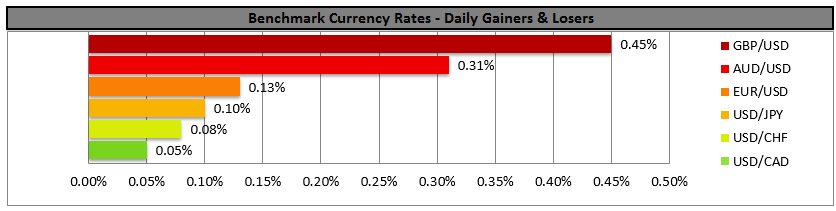
During yesterday's trading, the USD weakened against the basket of the major currencies despite the strong economic data. For example, the Purchasing Managers' Index by ISM for October reached 60.3 while the experts predicted only 59.3. The investors are waiting for the Congress election results. The USD index (#DX) closed in the red (-0.27%).
The British pound strengthened against the USD despite the weak economic stats from Great Britain. The Purchasing Managers' Index in GB for October lowered to 52.2 instead of the expected 53.3. Still, the financial market participants are positive regarding the GBP, since Great Britain and the EU might reach a Brexit agreement soon.
During the Asian trading session, the Reserve Bank of Australia reached a decision regarding the key interest rate. Just as the expert predicted, it remained at 1.50%. The regulator plans to keep the current monetary policy course.
The prices on oil are consolidating. Right now, the WTI futures are trading at 62.85 USD/barrel. At 23:30 we expect an API Weekly Crude Oil Stock report.
Market Indicators
The major US stock indices show mixed results: #SPY (+0,55%), #DIA (+0,80%), #QQQ (-0,25%).
The 10-year US government bonds yield is 3,20-3,21%.
The Economic News Feed for 06.11.2018:
JOLTS Job Openings report for September (US) – 17:00 (GMT+2:00);
Various reports on the state of the Labour market (NZ) – 23:45 (GMT+2:00).
AUD Has As Little Reaction On RBA’s Interest Rate Decision
RBA remained on hold at +1.50% as was widely expected with little change to the accompanying statement in comparison to last month. Main highlights that could be mentioned would be the progress on unemployment and that inflation acceleration is expected to be gradual. Also as for growth rates, the GDP was revised up a little for 2018 and 2019 (to average 3.5%), before slowing in 2020. We haven’t seen any intentions for changes by the bank and hence we continue to see the Aussie as being driven by the US-Sino trade war, as well as any Australian financial releases.
AUD/USD rose breaking the 0.7200 (S1) resistance line (now turned to support). We could see the pair trading in a sideways manner today however it might prove sensitive to any headlines regarding the US-Sino trade relationships, as well as the US midterm elections. Should the bulls continue to dictate the pair’s direction, we could see it breaking the 0.7240 (R1) resistance line and aim for higher grounds. Should on the other hand, the bears take over we could see it breaking the 0.7200 (S1) support line and aim for the 0.7160 (S2) support area.
USD braces for midterm elections
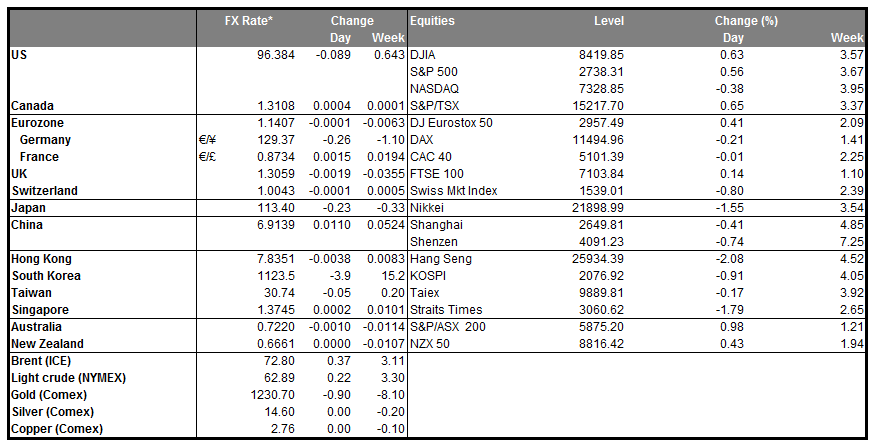
The USD remained in rather narrow ranges as the midterm elections are to take place in the US. The stakes are high, as a possible win of the Democrats in either of the two houses could curtail US President Trump’s powers substantially. Currently, opinions of analysts seem to converge that probably the Democrats may be winning over the House of Representatives while the Republicans maintain the majority in the Senate. It should be noted though, that analysts also point out that the market may be increasingly pricing in the possibility of a victory for the Republicans. Should there be a clear republican victory in both Houses, USD could be boosted, as US treasury yields could rise substantially. Volatility could be expected for the USD during and right after the elections as uncertainty may rise.
EUR/USD rose yesterday, clearly breaking the 1.1385 (S1) resistance line (now turned to support) and stabilised during the Asian session. We could see the pair continuing trading in a sideways manner today, however the pair may have a noticeable reaction to today’s financial releases and also prove sensitive to any headlines regarding the US midterm elections. Should the pair come under the market’s selling interest, we could see it breaking the 1.1385 (S1) support line, while if it finds fresh buying orders along its path we could see it breaking the 1.1430 (R1) resistance line and aim for the 1.1480 (R2) resistance hurdle.
In today’s other economic highlights:
In the European session today, we get Germany’s industrial orders growth rate for September, Eurozone’s final release of the PMIs for October, as well as the PPI rate for September. During the American session, we get New Zealand’s milk auctions figure and Canada’s building permits growth rate for September. Late in the American session we get New Zealand’s employment data for Q3 and from the US, the API weekly crude oil inventories figure. Should the API weekly crude oil inventories figure indicate another substantial slack in the US oil market we could see oil prices weakening even further. Should you be interested in more fundamentals about oil, please refer to our oil weekly outlook.
AUD/USD H4
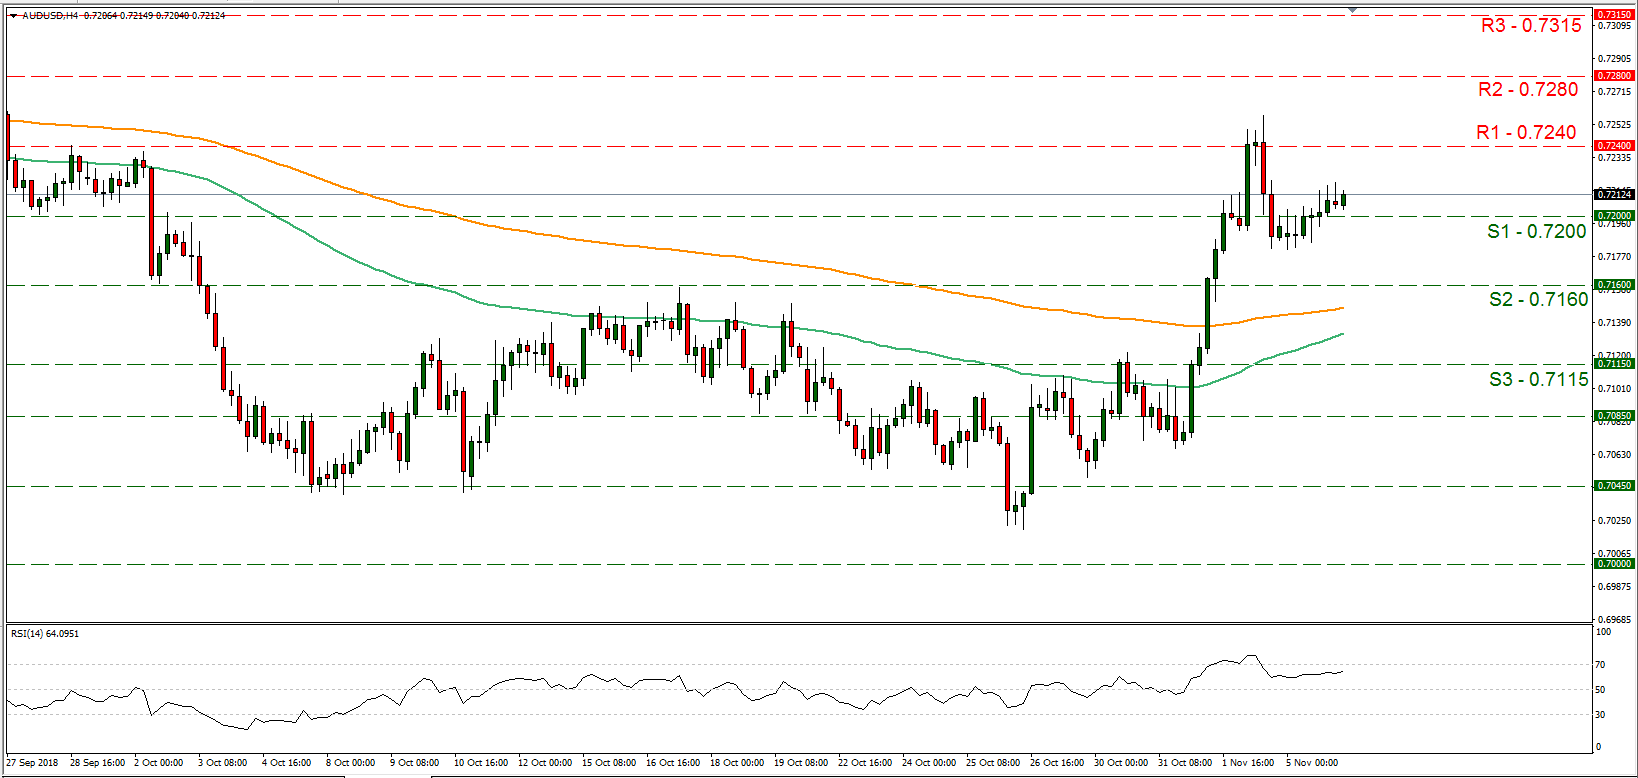
Support: 0.7200 (S1), 0.7160 (S2), 0.7115 (S3)
Resistance: 0.7240 (R1), 0.7280 (R2), 0.7315 (R3)
EUR/USD 4H
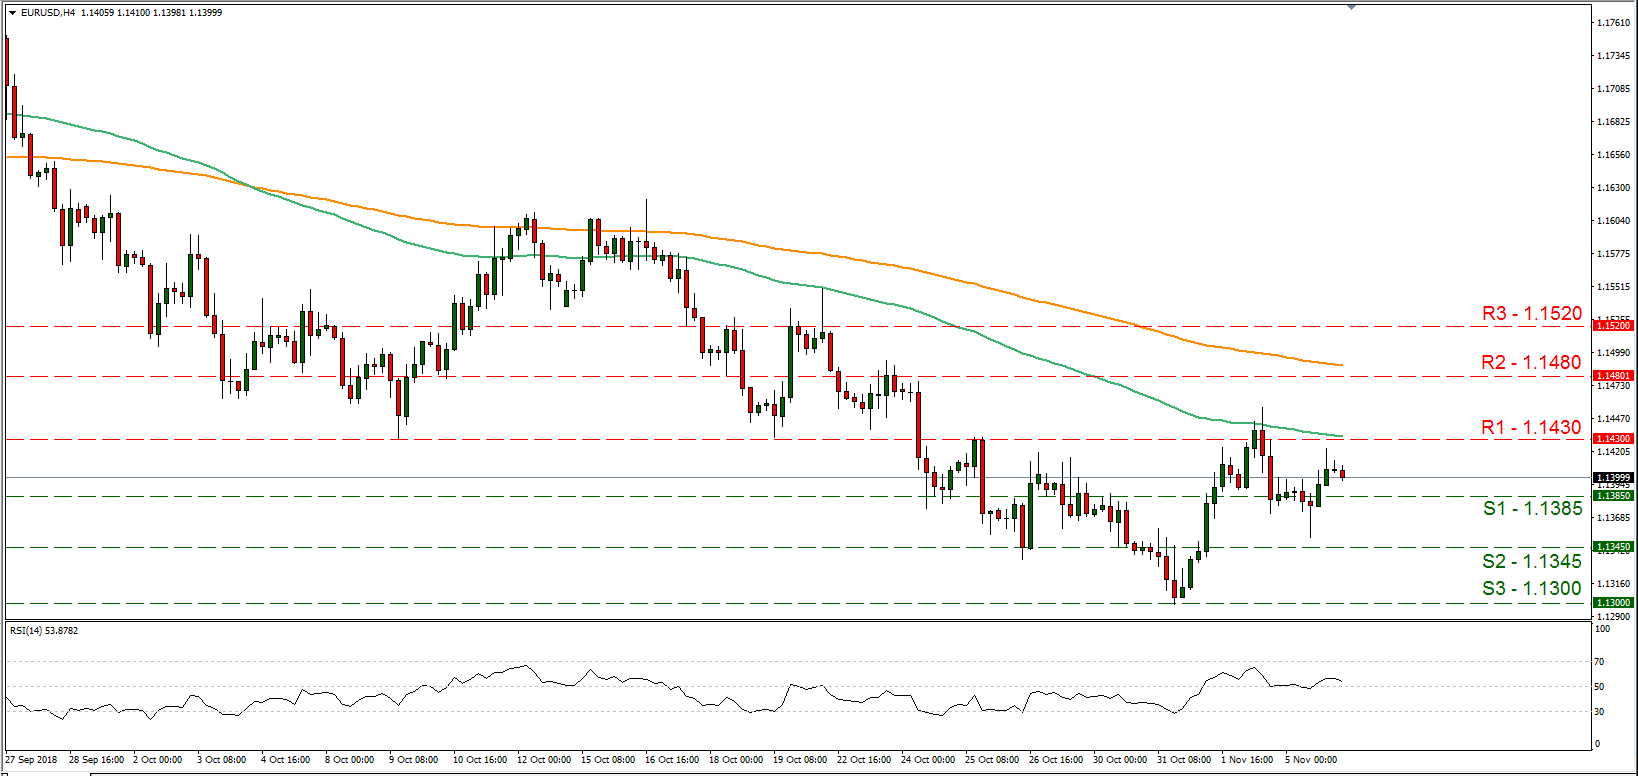
Support: 1.1385 (S1), 1.1345 (S2), 1.1300 (S3)
Resistance: 1.1430 (R1), 1.1480 (R2), 1.1520 (R3)
GBPUSD Outlook: Bulls Return To Power On Renewed Brexit Optimism And Look For Break Above Daily Cloud
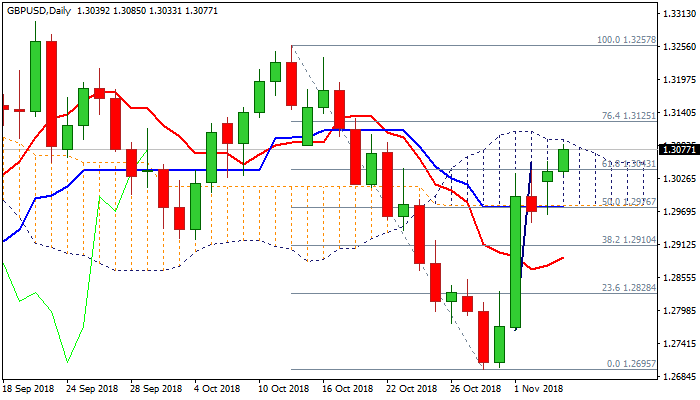
Cable rallied in early Tuesday’s trading and hit new two-week high at 1.3085, on rising optimism for Brexit deal, after media report showed that the EU is preparing to offer compromise proposal on Irish border, which proved to be the major obstacle on Brexit negotiations.
Fresh strength pressures daily cloud top (1.3095) after eventual break above strong Fibo barrier at 1.3043 (61.8% of 1.3257/1.2695), where upside attempts in past three days were repeatedly rejected.
Monday’s long-tailed daily candle signaled strong downside rejection at daily cloud base (dented on Friday’s close below) and signaled an end of brief consolidation, returning near-term picture into full bullish mode on return above a cluster of daily MA’s at 1.2996/1.3037 zone.
Strong bullish signals could be expected on close above 1.3043 Fibo barrier and above daily cloud top, which would open way for further advance.
Broken Fibo barrier and session low mark initial supports at 1.3043/33, followed by converged 30/55SMA’s (1.3017/12) and psychological 1.30 support (reinforced by 20SMA), which guard lower pivot at 1.2980 (daily cloud base).
Res: 1.3095, 1.3125, 1.3192, 1.3235
Sup: 1.3043, 1.3017, 1.3000, 1.2980
EURUSD Outlook: Repeated Upside Rejections Keep The Downside At Risk, EU Data And US Midterm Elections In Focus For...
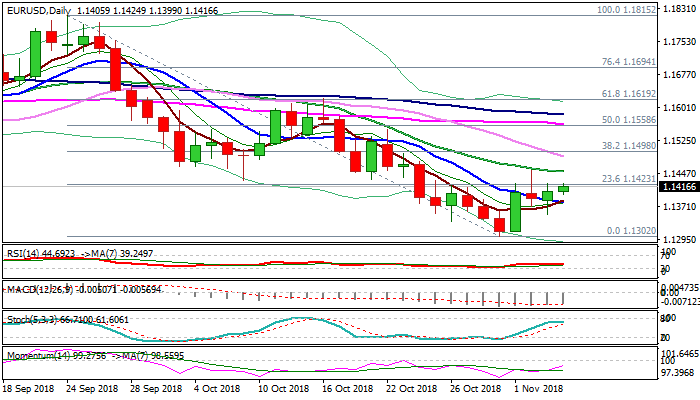
The Euro stands at the front foot and attacks again double-Fibo barrier at 1.1423 (23.6% of 1.1815/1.1302 and 38.2% of 1.1621/1.1302), after triple failure to close above here. Monday's bullish outside day, along with strong downside rejection, is bullish signal, supported by north-heading 14-d momentum and formation of 5/10SMA bull-cross. But on the other side, strong upside rejection on Friday weighs, accompanied flat RSI / slow stochastic and pressured by falling 20SMA (1.1451) partially offsets positive signals. The single currency is looking for a catalyst which would provide direction signal, with focus on economic indicators. German factory orders rose well above expectations in Sep, with focus on series of services PMI data from the EU, which could provide fresh signals. Negative releases would confirm existing bearish bias following multiple failures at 1.1423 and Friday's bull-trap pattern that could attract fresh weakness. Return below Monday's low at 1.1353 would further weaken near-term structure and risk retest of key 1.13 supports. Bullish scenario requires sustained break above 1.1423 Fibo barrier and falling 20SMA to generate stronger signal for extension of recovery from 1.1302 (31 Oct low). US midterm election, due later today, is also in focus for fresh signals. The dollar could strengthen if Republicans win in both chambers – the House of Representatives and the Senate, but wide expectations for split results, where Democrats would win control of the House of representatives while Republicans would keep the Senate.
Res: 1.1423, 1.1452, 1.1461, 1.1498
Sup: 1.1399, 1.1386, 1.1353, 1.1335
EURAUD And S&P500 Intra-Day Developments With Elliott Wave Theory
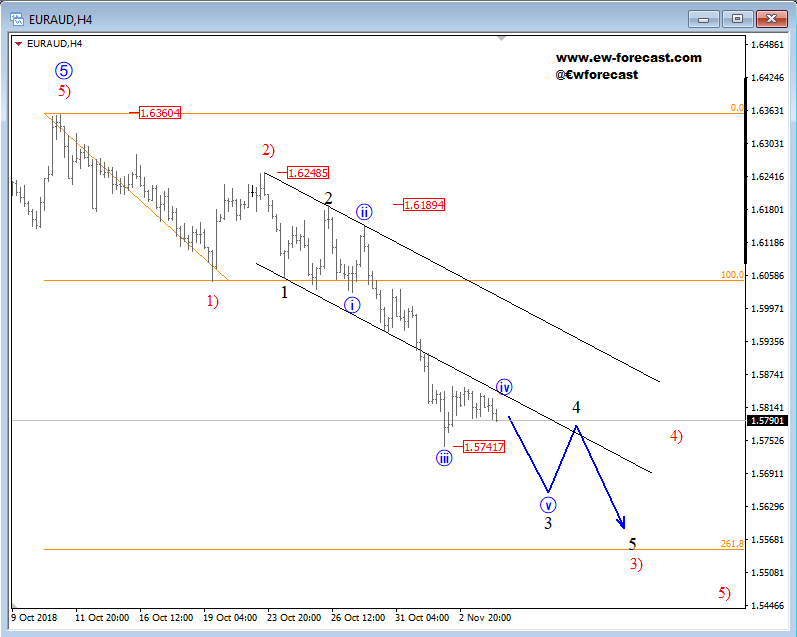
EURAUD can be trading in a bigger, bearish reversal, down from 1.6360 level. We specifically see price unfolding a minor five-wave drop from 1.619 level that is part of impulsive wave 3 of 3). Some pullback may join the downtrend, and first one can be minor wave iv, that can look for resistance at the lower channel line visible on the chart. A drop below the 1.573 level would already suggest more weakness.
EURAUD, 4h
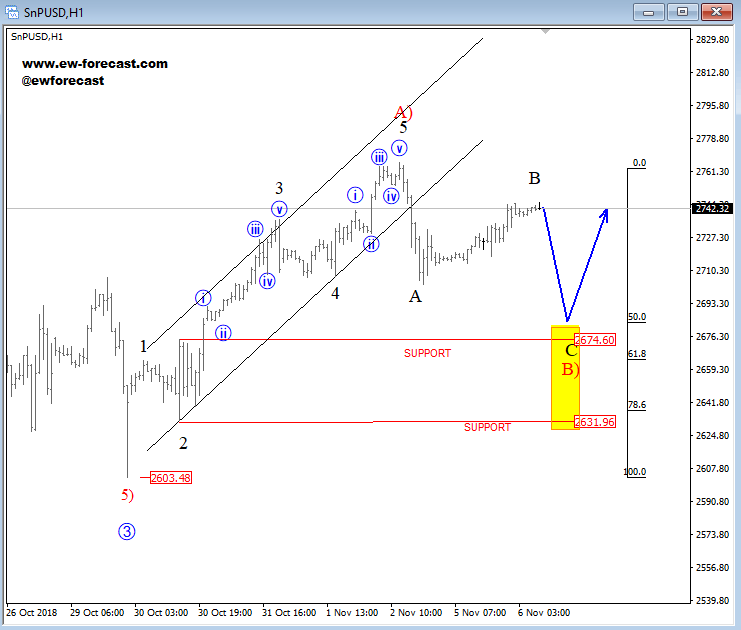
S&P500 made a five-wave rally from the 2603 lows, which was later reversed by a temporary three-wave retracement. We can see an A-B-C pullback in play of a higher degree wave B), which can in sessions ahead look for support and a bounce near the 2674/2631 level, levels of former swing highs and lows.
S&P500, 1h
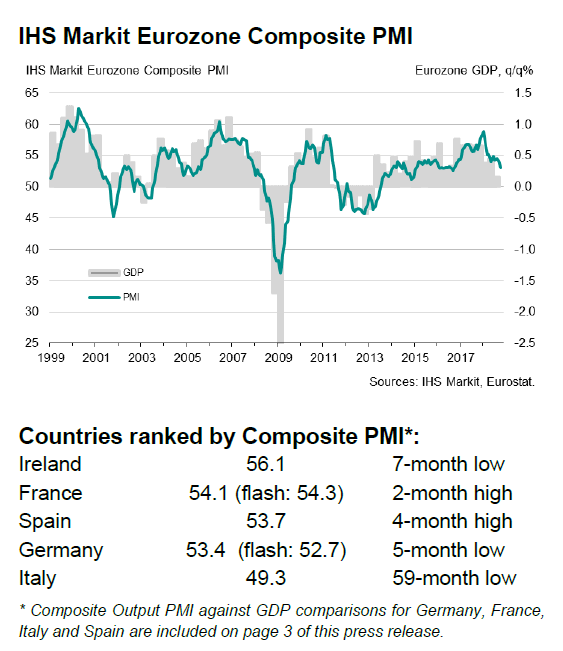
Eurozone PMI composite finalized at 53.1, notable slowdown in Italy
Eurozone PMI services was finalized at 53.7 in October, down from prior month's 54.7. PMI composite was finalized at 53.1, down from September's 54.1. Among the countries, Italy PMI composite dropped to 49.3, a 59-month low. German PMI composite also dropped to 5-month low at 53.4.
Chris Williamson, Chief Business Economist at IHS Markit said:
"Eurozone companies reported a disappointing start to the fourth quarter. Business activity is growing at its slowest rate for over two years and expectations have slumped to the bleakest since the end of 2014.
"An export-led slowdown, linked to growing trade tensions and tariffs, has been exacerbated by rising political uncertainty, growing risk aversion and tightening financial conditions. The slowdown has consequently become more broad-based to increasingly envelop the services economy.
"While the PMI numbers hint at an upward revision to the 0.2% flash estimate of third quarter GDP growth, it's clear that the economy has slowed and that the weakness has intensified into the fourth quarter.
"Italy has recorded an especially noticeable slowdown, slipping into decline during October, whilst Germany has also seen a worrying easing of growth, with both countries affected by rising political uncertainty. France and Spain, in contrast, have seen more resilient business conditions, though both are registering much slower growth than earlier in the year."