Sample Category Title
EUR/GBP Mid-Day Outlook
Daily Pivots: (S1) 0.8887; (P) 0.8915; (R1) 0.8954; More...
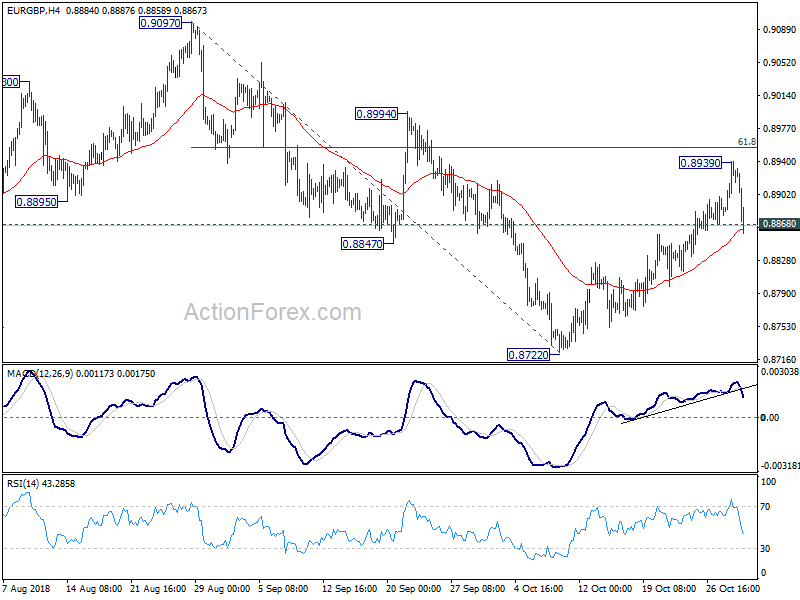
EUR/GBP's sharp decline and break of 0.8868 minor support argues that rebound from 0.8722 has possibly completed at 0.8939. That came just ahead of 61.8% retracement of 0.9097 to 0.8722 at 0.8954. Intraday bias is turned back to the downside for 0.8722 low first. On the upside, though, above 0.8939 will extend the rebound through 0.8954 to 0.8994 resistance next.
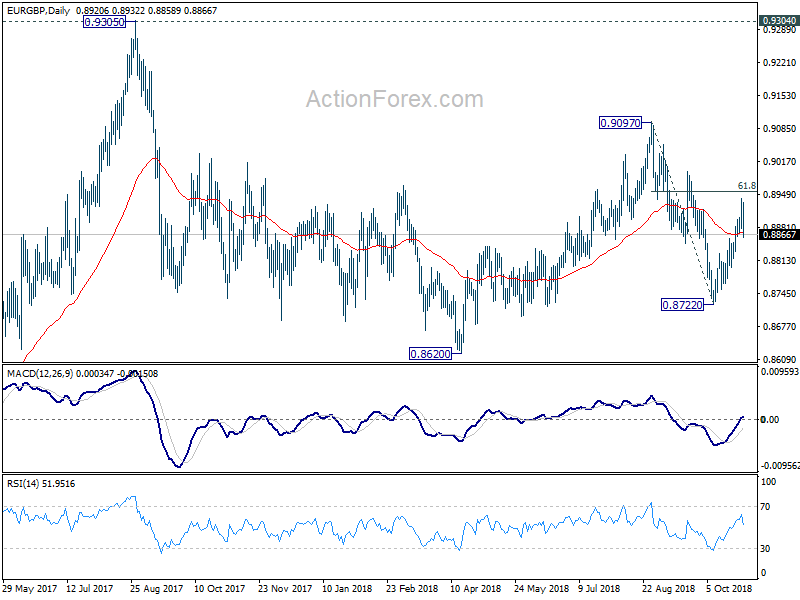
In the bigger picture, EUR/GBP is seen as staying in long term range pattern started at 0.9304 (2016 high). On the downside, break of 0.8722 will extend the falling leg through 0.8620 support. On the upside, break of 0.9097 will target 0.9304 resistance instead.
How to Master Technical Analysis?
One of the best ways to forecast future price movements on the Forex market is to apply technical analysis. Using technical analysis, traders monitor the price fluctuations and determine its possible rise or fall.
What is a trend and how to define it?
The sentiment of market participants determines the direction of movement. Prices on Forex do not move in one direction, they grow or fall. If the direction of the price movement persists for some time, a trend is formed.
A trend is a directional price movement that is observed over a specific period. Price moves through highs and lows. There are three types of trend directions:
- Uptrend shows the rise in prices in a certain period. On the chart, it looks like a series of rising lows and highs. The uptrend is often called the bullish trend.
- Downtrend indicates a fall in prices. Each subsequent low and high is below the previous one. The downtrend is often called the bearish trend.
- The absence of a pronounced trend characterizes a sideways trend. Series of highs and lows located on the same level. Traders usually take into account the rule that any sideways trend sooner or later can be replaced by a strong movement.
Mostly, a trader should identify the current trend in time), determine its nature and open an order in the direction of the trend.
There should be at least two highs/lows on the chart to draw a trend line. If the price changes in the opposite direction to the trend, within the lines, a correction is possible, and if it overcomes it, the trend reversal is not excluded.
Support and resistance levels
Resistance and support levels are lines drawn through the extremum points on the price chart. In technical analysis, the resistance and support levels show demand and supply of the market.
The price may slow down, approaching these levels, and sometimes it may bounce and start moving in the opposite direction. If the price overcomes the level and fixes, it means that the trend is likely to change.
The line drawn through the maximum points is called the resistance level, it is located above the current market price. At this point, sellers enter the market. The line drawn through the minimum points is called the support level, it is located below the current market price. At this level, buyers enter the market.
You can use support levels for entry to the market to open long positions. When the price falls to this level, the price is likely to rise again. Stop loss should be placed below the support level. Resistance levels are used in the same way, but for entry to the market to open short positions. When the price reaches this level, we can assume that it will fall again.
Chart patterns
On the chart, you can see the various chart patterns. There are two most popular chart patterns: reversals and continuations. The formation of a reversal pattern on a chart means a change in trend. Such patterns include Head and Shoulders, Double Top, Double Bottom. For example, “Double top” is a graphical pattern of an uptrend reversal. The pattern consists of two highs, in which the price twice tried to break through the resistance. Noticing this pattern, one should consider sales.
If continuation patterns are formed on the chart, this means that the trend is likely to continue. Flag, Pennant, Triangle, Rectangle are among the continuations. Quite often, these patterns act as reversal formations.
There is the “Technical Analysis” section at the JustForex website where the analysis of chart patterns is published.
Indicators
Each indicator of technical analysis is based on a specific formula. Depending on the type of indicator or its purpose, the formula may vary. Using indicators a trader determines trends, overbought and oversold zones, trading volume, identifies possible reversals.
All indicators can be divided into Trend and Oscillators:
- Trend indicators are used to identify trends in a specific time interval. Most trend indicators are built in the same window as the price chart. The Moving Average is considered to be the most popular trend indicator.
- Oscillators work well when there is no pronounced trend. They help to determine overbought and oversold zones and predict the future direction of the price. Such indicators are built in a separate window under the chart. The most popular oscillators are Stochastic, RSI and MACD.
Using technical analysis of financial markets, it is possible to forecast price movements, thereby making a stable income. At the same time, JustForex recommends not to forget to take into account fundamental analysis, as well as risk management rules while trading.
Rand Stands as Biggest EM Loser Following Balance of Trade Report
The South African Rand stands at time of writing as the biggest loser amongst emerging markets currencies today with losses of 1.56%, after South Africa’s latest balance of trade report unexpectedly showed slowing export growth.
The recently-announced trade balance data for September has essentially resumed selling pressure on the Rand. The market is not pleased with the news that export growth fell by 2.6% month-on-month, with the essential factor to consider that slowing export growth at a time where the domestic economy is in a technical recession is never a positive sign for any global economy.
Figures like this do suggest that external uncertainties, such as the prolonged trade tensions and warnings from respected institutions like the IMF that global growth has potentially “plateaued” is a problem for emerging markets in particular.
Overall, I wouldn’t read too much into a one-off data release, but investors would be mindful to monitor the upcoming economic releases from South Africa for validation behind why exactly the Finance Minister downgraded the South African economic growth outlook so sharply from 1.6% to 0.7%.
If further economic releases from South Africa provide an explanation to why the growth outlook for the country was sharply revised lower during the medium-term budget statement one week ago, it does risk weighing further selling momentum on the Rand.
One factor that is also not helping the Rand over the near-term is the news of the Dollar edging to further 2018 high’s at time of writing. Dollar strength remains as a major challenge to emerging markets.
Japan 225 Index Regains Some Ground after Rebound on 20780
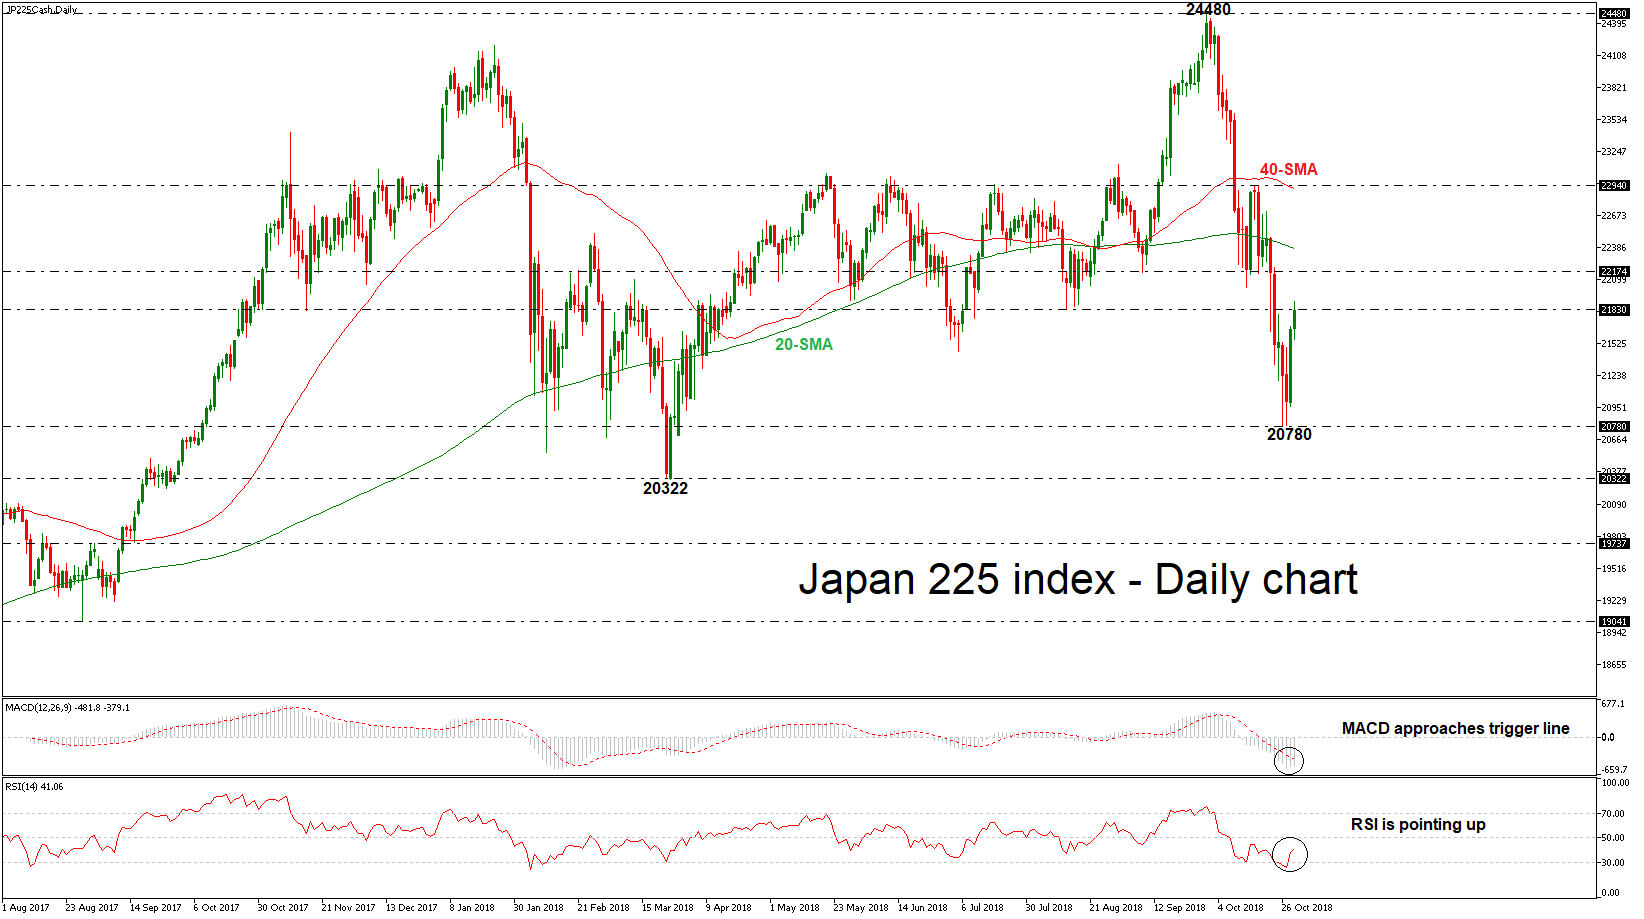
The Japan 225 index has been outperforming since yesterday following the bounce off the 20780 support level. The aggressive bullish scenario is confirmed by the technical indicators; the RSI jumped higher from the oversold zone, sloping upwards, while the MACD is moving slightly higher, approaching the trigger line but stands below the zero line.
Should the index manage to strengthen the positive momentum, the next immediate resistance could come near the 22174 barrier, but the price needs first to post a closing day above 21830. A break above 22174 would challenge the 20-day simple moving average (SMA) near 22378 at the time of writing. The next level higher for investors to have in mind is the 22940 resistance, which stands near the 40-day SMA.
However, if prices create a pullback on 21830 and head lower, this would turn the risk to the downside towards the 20780 support. Below this level, the next target could come from the 20322 support, identified by the trough on March 26.
When looking at the bigger picture the price does not have a clear directional movement in the medium-term, however, in a longer timeframe the index has been creating an ascending movement since June 2016.
USD/JPY Mid-Day Outlook
Daily Pivots: (S1) 112.56; (P) 112.83; (R1) 113.34; More..
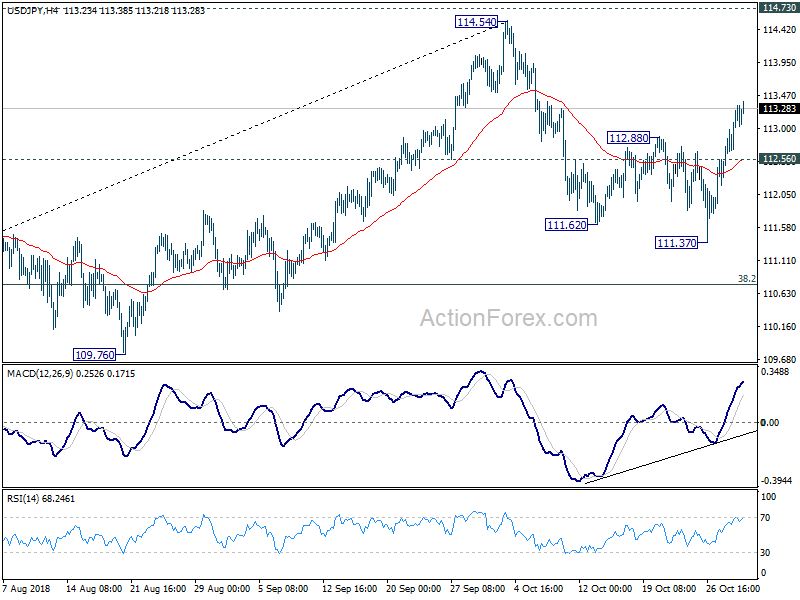
USD/JPY's rebound from 111.37 is still in progress. Intraday bias remains on the upside for 114.54/73 key resistance zone. On the downside, break of 112.56 will possibly extend the correction from 114.54 to 38.2% retracement of 104.62 to 114.54 at 110.75 before completion.
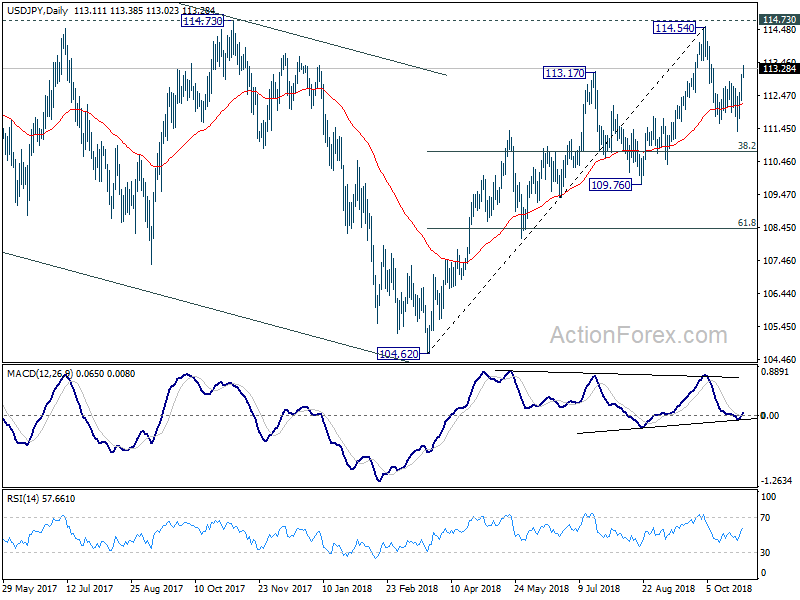
In the bigger picture, corrective fall from 118.65 (2016 high) should have completed with three waves down to 104.62. Decisive break of 114.73 resistance will likely resume whole rally from 98.97 (2016 low) to 100% projection of 98.97 to 118.65 from 104.62 at 124.30, which is reasonably close to 125.85 (2015 high). This will stay as the preferred case as long as 109.76 support holds. However, decisive break of 109.76 will dampen this bullish view and turns outlook mixed again.
USD/CHF Mid-Day Outlook
Daily Pivots: (S1) 1.0022; (P) 1.0038; (R1) 1.0067; More...
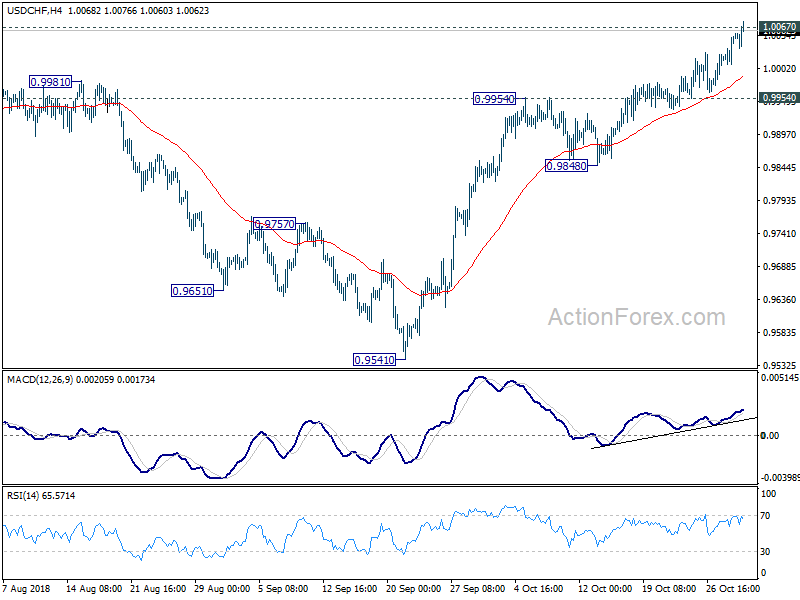
USD/CHF rises to as high as 1.0076 so far and breaches 1.0067 resistance. Intraday bias remains on the upside at this point. Sustained break of 1.0067 will confirm resumption of larger rise from 0.9186 and should target 1.0342 key resistance next. In any case, near term outlook will remain bullish as long as 0.9954 resistance turned support holds. However, break of 0.9954 will confirm short term topping and bring deeper pull back to 0.9848 support and below.
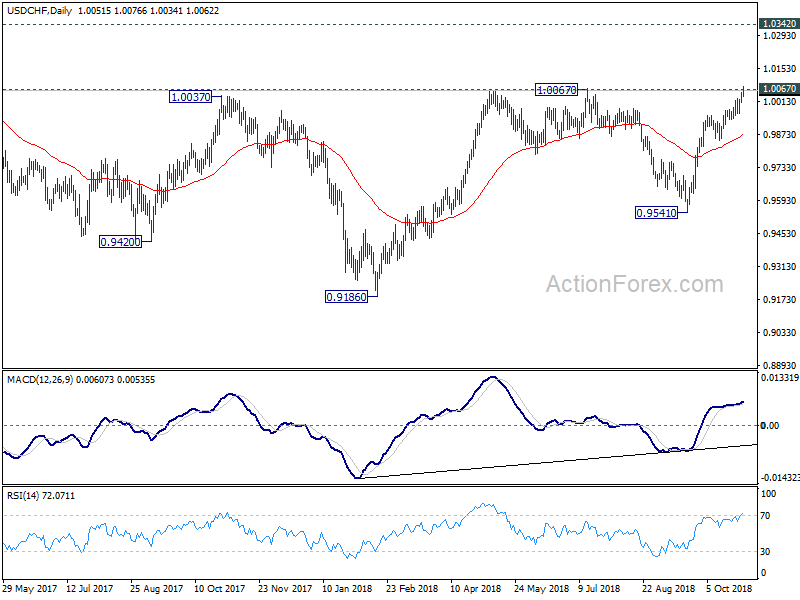
In the bigger picture, the pullback from 1.0067 has completed at 0.9541 already. And rise from 0.9186 is likely resuming. Firm break of 1.0067 will pave the way to retest 1.0342 key resistance. We'd be cautious on strong resistance from there to limit upside to bring another medium term fall to extend long term range trading.
GBP/USD Mid-Day Outlook
Daily Pivots: (S1) 1.2666; (P) 1.2739; (R1) 1.2783; More...
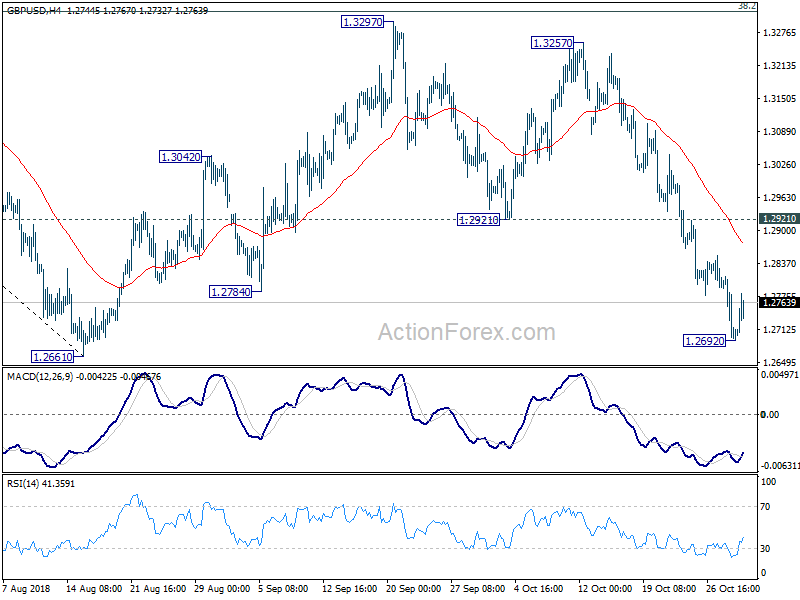
A temporary low is in place at 1.2692 with today's recovery. Intraday bias in GBP/USD is turned neutral for some consolidation first. As long as 1.2921 support turned resistance holds, another fall is expected. Below 1.2692 will target 1.2661 low first. Decisive break there will resume larger down trend from 1.4376. Next target is 61.8% projection of 1.4376 to 1.2661 from 1.3297 at 1.2237.
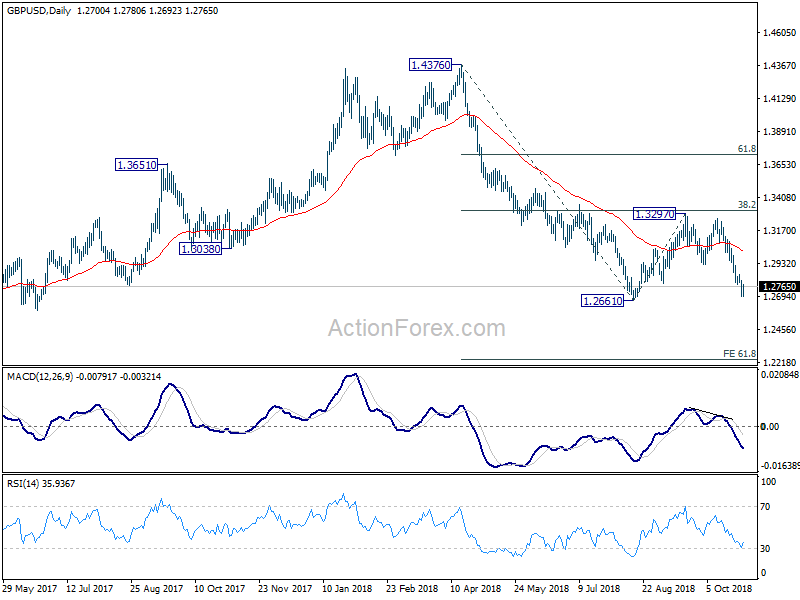
In the bigger picture, whole medium term rebound from 1.1946 (2016 low) should have completed at 1.4376 already, after rejection from 55 month EMA. The structure and momentum of the fall from 1.4376 argues that it's resuming long term down trend. And this will be the preferred case as long as 38.2% retracement of 1.4376 to 1.2661 at 1.3316 holds. However, firm break of 1.3316 would bring stronger rebound to 61.8% retracement at 1.3721. And, the eventual depth of the fall from 1.4376, and the chance of hitting 1.1946 low, will depend on the strength of the interim corrective rebound from 1.2661.
Canada Ekes Out an Expansion in August
August saw Canadian economic activity climb modestly, up 0.1% month-on-month. The gains were fairly concentrated, as just 8 of 20 major industries expanded.
The service sector led the way, gaining 0.1% as strength in finance and insurance (+1.0%), real estate (+0.3%) and professional services (+0.3%) offset modest pullbacks in a few key areas, notably transportation (-0.5%) and retail trade (-0.2%).
The goods producing sectors were effectively flat on the month in aggregate. A rebound of oil and gas helped drive mining, quarrying, and oil & gas to a 0.9% monthly expansion, while utilities rose for a second month (+0.8%). Holding the sector back was a pullback of manufacturing output (-0.6%) and a third monthly decline in construction activity (-0.4%).
Key Implications
That could have been worse. Despite some weakness in the headline-grabbing sectors – notably manufacturing sales and retail trade – the Canadian economy eked out a modest gain in August on the back of a rebound in the oil and gas sector, alongside a surge of market activity that helped the financial sector. To be sure, this report could have been stronger, but it also could have been weaker.
Indeed, without those key contributors, the economy would likely have contracted. Just eight sectors expanded in August, the worst breadth in nearly six years. The lack of breadth may be a bit discouraging, but economic growth for Q3 is nevertheless tracking around 2%, just a tick above the Bank of Canada's latest projections (see commentary). What's more, some of the August weakness looks likely to reverse in September, and the lifting of uncertainty delivered by the USMCA should contribute to an above-trend pace of expansion thereafter in both our, and the Bank of Canada's, view.
Combine a healthy economic outlook with the tilt towards hawkishness that accompanied last week's rate hike, and you have the recipe for further monetary tightening. The Governor has made it clear that every rate decision is 'live', which could bring a December hike into play. However, GDP is only slightly outperforming the Bank's forecast and core inflation is still largely on target. Thus, we remain comfortable in our view that the next hike is most likely to come with the January 2019 decision.
Canada GDP Up 0.1% in August on Oil Sands Production Rebound
Highlights:
- Canadian GDP rose 0.1% in August to build on a 0.2% gain in July. Markets expected a flat reading in August.
- Details were softer with a jump in oil sands production and utilities output in particular not likely to be repeated.
- Looking through monthly wiggles, the data remains consistent with GDP rising 2% in Q3 — broadly in line, and perhaps slightly stronger than the Bank of Canada’s 1.8% forecast.
Our Take:
Details were softer than the (slightly) stronger-than-expected 0.1% headline GDP increase would imply. A 3.2% jump in oil sands production won’t likely be repeated to the same extent — the gain retraced a similar sized drop the prior month due to transitory production disruptions. Similarly, warm weather boosted utilities output for a second straight month. That will reverse as temperatures return to normal. Activity outside of those components was little changed. Manufacturing, retail, and wholesale sales all dipped lower, broadly in line with earlier-released monthly sales reports for the sectors with other services components posting trend-like increases on balance.
Looking through monthly volatility, though, the economic backdrop continues to look strong. On a year-over-year basis, GDP was up 2.5% in August, led in part by a large gain in oil & gas extraction but also solid year-over-year growth in manufacturing and services output. Indeed, business surveys are increasingly reporting that capacity constraints, not lack of demand, are the most pressing concern at the moment in much of the country. Wage growth has lagged despite tight labour markets but rising business need for workers still means wage growth is more likely to strengthen than slow going forward. Yet interest rates are still very low. Absent an unexpected shock to the economy, that backdrop leaves little reason for the Bank of Canada not to follow through with further gradual interest rate hikes.
EURUSD: Bear Pressure Aims Support At 1.3000 Level
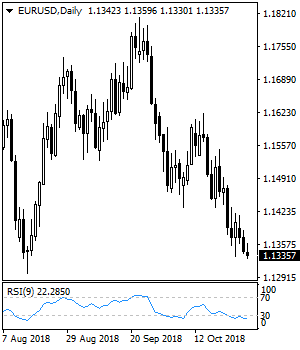
EURUSD bear pressure aims support located at 1.3000 but beware of a price stall. This is coming on the back of its Tuesday losses. Support lies at the 1.1250 where a violation will aim at the 1.1200 level. A break below here will aim at the 1.1150 level. Further down, support lies at the 1.1100. Its daily RSI is bearish and pointing lower suggesting further weakness. On the upside, resistance resides at 1.1350 level with a break through there opening the door for further upside towards the 1.1400 level. Further up, resistance comes in at the 1.1450 level where a violation will expose the 1.1500 level. All in all, EURUSD continues to face further downside pressure in the medium term.