Sample Category Title
EURUSD Outlook: Bears Look For Final Break Below Key 1.1314/00 Supports
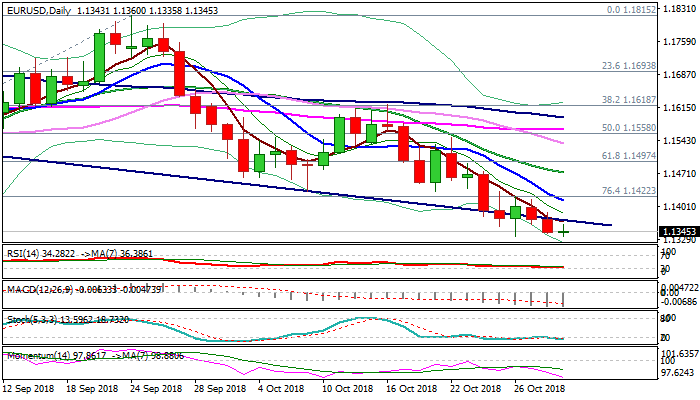
The Euro retested last Friday's low at 1.1335 on Wednesday but was far unable to break lower.
The pair is consolidating within narrow range above 1.1335, with near-term bias remaining with bears and eyeing key supports at 1.1314/00 (200WMA / 15 Aug low).
Strong demand for the US dollar keeps the Euro pressured, along with weak bloc's data (weaker than expected German labor data and EU GDP on Tue).
Today's downbeat German retail sales (Sep m/m 0.1% vs 0.5% f/c and Sep y/y -2.6% vs 0.9% f/c) maintain negative tone ahead of release of EU CPI data (y/y 2.1% f/c vs 2.1% prev).
Strong bearish setup of daily techs maintain negative tone, as last week's long red weekly candle weighs and the pair being on track for strong monthly loss, keeping focus at the downside.
Eventual break below 1.1300 pivot would expose next strong support at 1.1178 (Fibo 61.8% of 1.0327/1.2555 ascend).
Broken neckline of asymmetric H&S pattern marks initial resistance at 1.1370 (reinforced by falling 5SMA), with extended upticks expected to stall under falling 10SMA (1.1413) to keep bears in play.
Res: 1.1370, 1.1413, 1.1444, 1.1478
Sup: 1.1335, 1.1314, 1.1300, 1.1285
China Notes: Weak Chinese PMI Points To Further Slowdown In Q4
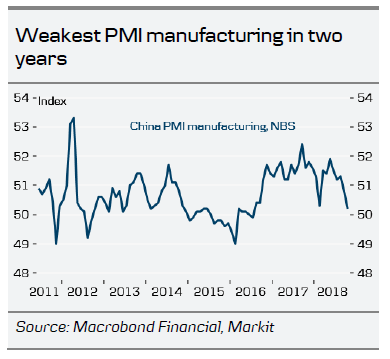
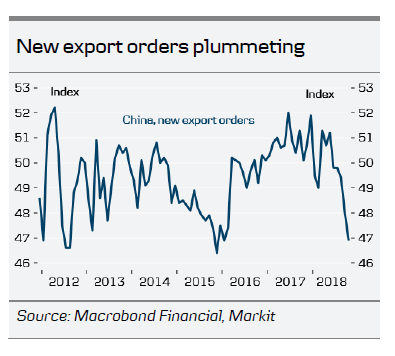
Chinese PMI released overnight was very weak and points to more slowing in Q4. The official PMI manufacturing decreased to 50.2 (Consensus 50.6) in October, down from 50.8 in September. This is the lowest level in two years. In particular, new export orders are very weak, highlighting the negative effect of the trade war with the US.
We look for more weakness in coming quarters before a rebound in 2019 when the stimulus kicks in more and we expect to a trade deal at some point in the year. We believe infrastructure and housing will support growth. China could also very well announce further tax cuts for households to unleash more consumption. Both private investment and consumption have been soft, – probably related to the uncertainty on the trade war.
While the trade war is clearly painful for China in the short term, we do not believe it changes the negotiating stance with the US in the trade war. In our view, China will look for a deal for the long term and not be too affected by short-term developments. There is still a risk we will see further escalation if Xi Jinping and Donald Trump fail to get US and China back on a negotiating path when they meet at end-November. Hence, we could see the 10% rate on the USD200bn Chinese imports go up to 25% on 1 January and Trump putting tariffs on all Chinese imports. This would create further headwind for China. However, we expect a deal to be reached during 2019 (not least because it will start to hurt the US too), which would lift some of the dark clouds over the Chinese economy. At the same time, a weaker currency and stimulus should work as a cushion to the drag from exports.
The slowdown underlines continued downward pressure on CNY. We continue to see USD/CNY rising to 7.20 in 12M, up from 6.969 currently.
The private version of PMI from Caixin is due to be released tomorrow at 02:45 CET.
Dollar Soars To 1½-Year Highs, Eurozone Flash Inflation Eyed
Here are the latest developments in global markets:
FOREX: The dollar soared to a fresh high last seen in June 2017 against a basket of six major currencies, as risk sentiment was reinvigorated. The pound was the worst performer, as ratings agency S&P warned of a recession in case of a no-deal Brexit. The defensive yen was the second-worst performer in the face of stronger risk appetite. Meanwhile, the aussie is on the back foot on Wednesday, giving back some of its gains from the previous session, amid disappointing inflation data out of Australia and PMIs from China.
STOCKS: US markets came roaring back on Tuesday, without any clear trigger behind the bounce, and curiously overlooking a simultaneous rebound in US bond yields. The Dow Jones was the best performer (+1.77%), while the benchmark S&P 500 (+1.57%) and the tech-heavy Nasdaq Composite (+1.58%) followed in its tracks. Moreover, the optimism seems to have lingered, as futures tracking the Dow, S&P, and Nasdaq 100 are all pointing to a higher open today as well. Correspondingly, Asia was a sea of green on Wednesday. Japan’s Nikkei 225 and Topix rose by 2.16% and 2.15% respectively, while the Hang Seng in Hong Kong gained 1.35%. In Europe, all the major indices were looking set to open notably higher according to futures markets.
COMMODITIES: Oil prices were on the rise on Wednesday, recovering some of the losses from the previous two sessions. On the one hand, the demand picture looks bleak, as global growth is wobbly and crude demand could be one of the first casualties if the US-China trade conflict escalates further. On the other, the looming sanctions on Iran coupled with reports that OPEC and allies are considering productions cuts, likely kept a floor under prices. In precious metals, gold is down by more than 0.4% today at $1,215 an ounce, feeling the heat of a stronger dollar and the improvement in risk sentiment. A dip back below $1,214 would turn the short-term technical picture back to neutral.
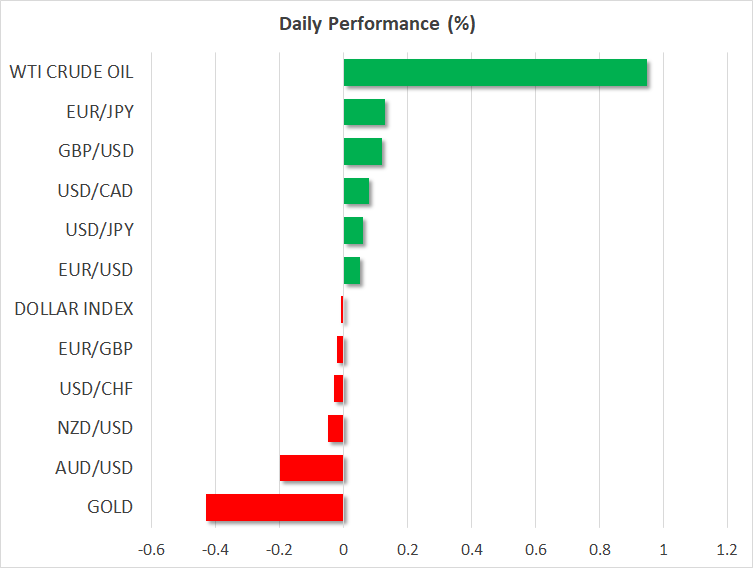
Major movers: US equity markets roar back; dollar soars to fresh 1½-year high
The overarching theme during Tuesday’s trading session was a revival of risk appetite, though once again, in the absence of any fresh catalyst – other than an upbeat reading on US consumer confidence. US stock markets came roaring back, with commodity currencies such as the aussie and kiwi also advancing. Accordingly, the defensive Japanese yen was the second-worse performer among the major currencies, after sterling, weighed down by a lack of haven demand.
Meanwhile, the dollar index soared to a fresh 1½-year high, with the US currency drawing strength from an uptick in longer-dated US Treasury yields. The move highlights that the greenback has the best of all possible worlds at the moment. Namely, it can act both as a haven asset when risk sentiment deteriorates given its status as the world’s reserve currency, and also outperform in a risk-on environment given its high-carry appeal.
In the UK, the pound surrendered ground as Brexit uncertainties continued to ride high. Credit ratings agency S&P issued a stark warning that the probability for a no-deal Brexit has risen, and that such an outcome would likely trigger a recession, and alongside it a rating downgrade. This probably served as a reminder that the talks remain in a deadlock, with any deal now unlikely to be reached before December, if at all. Such a timeframe would also allow little time to push any deal through Parliament, which itself isn’t going to be a picnic for PM May.
In the eurozone, GDP growth for Q3 disappointed, clocking in at a mere 0.2% in quarterly terms, from 0.4% previously. The print underscores that the slowdown seen in PMI surveys is manifesting into the “hard data” too, and that the ECB may have an increasingly difficult task of unwinding its stimulus while staring down the barrel of a slowing economy. Euro/dollar fell below 1.1350.
Overnight, the BoJ kept its policy unchanged, downgrading its inflation forecasts. Other than that, there were practically no fresh signals on policy, and the reaction in the yen was accordingly non-existent. All in all, with underlying inflation still so far away from target, the BoJ appears unlikely to alter its ultra-loose policy framework anytime soon. In isolation, this argues for a weaker yen over time, particularly against currencies of nations that are raising rates – like the dollar – as the yield differential between Japan and other economies widens.
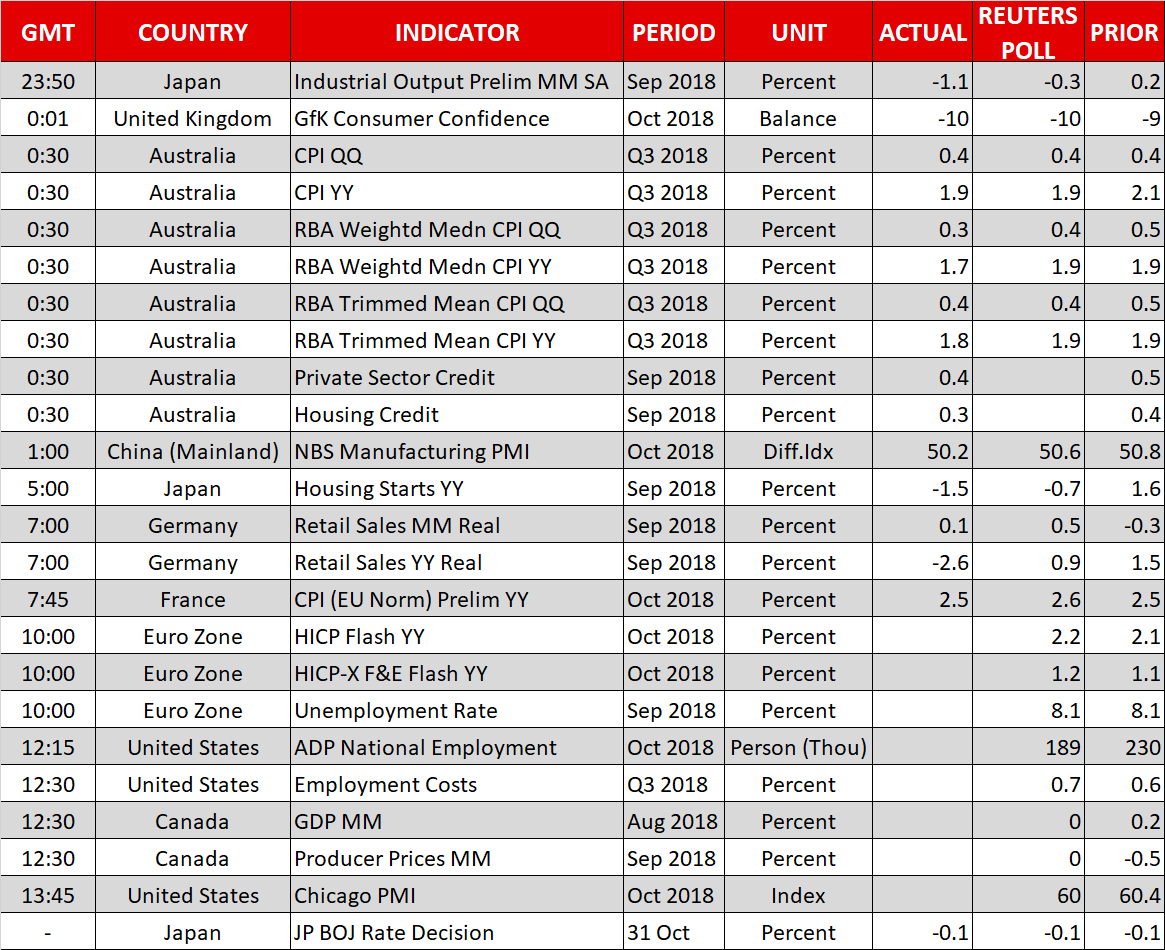
Day ahead: Eurozone flash inflation, US ADP jobs data and Canadian growth figures coming up
Eurozone inflation figures, the ADP employment report out of the US, and monthly GDP numbers out of Canada are some of the highlights on Wednesday’s economic calendar.
The prints for eurozone flash inflation for October will be released at 1000 GMT. The harmonised index of consumer prices (HICP) is anticipated to have grown by 2.2% y/y in October, above September’s 2.1% and matching its highest since December 2012. For perspective, the ECB’s target for annual inflation is “close to but below 2%”. Still, the significance of the overshoot in headline inflation might be downplayed, as underlying price pressures remain relatively subdued. In this respect, core HICP that excludes volatile food and energy items is projected to grow by 1.2% y/y, up from September’s 1.1%. A notable beat in the numbers may see the battered euro – EURUSD is trading around two-and-a-half-month lows – post a relief rally.
Also out of the euro area at 1000 GMT will be September’s unemployment rate. That’s expected to match August’s 8.1% rate, which is the lowest since late 2008.
Out of the US, October’s ADP national employment report on the number of positions added to the economy by the private sector is due at 1215 GMT. The number of jobs added is forecast to stand at 189k, down from 230k during September, though still constituting a relatively robust figure. Traders may use the ADP data to speculate on how Friday’s nonfarm payrolls report will come out, though it bears mention that the two prints are far from perfectly correlated. Elsewhere, Q3 employment costs are also due out of the US at 1230 GMT; this is a gauge of wage growth and thus is worth keeping an eye on. Lastly, October’s Chicago PMI is slated for release at 1345 GMT.
The reading on Canada’s August GDP growth will be made public at 1230 GMT. Zero growth is forecast by analysts during the month, after economic activity expanded by 0.2% m/m in July. September’s producer prices out of the nation will be hitting the markets at the same time.
Meanwhile, global trade – the Sino-US dispute –, Italian and German politics, as well as Brexit uncertainty remain in the background, with any headlines having the potential to rattle the markets. Relating to the latter, UK PM May and finance minister Hammond will be meeting chief executives and international investors to discuss Brexit and the nation’s latest budget.
ECB members Nowotny and Nouy will be speaking at 0900 GMT and 0905 GMT correspondingly, while the Bank of Canada Governor Poloz and Senior Deputy Governor Wilkins will be appearing before a Senate Committee at 2015 GMT.
In equities, General Motors will be reporting quarterly earnings before the US market open.
In energy markets, EIA data on US crude stocks due at 1430 GMT are predicted to show an inventory buildup of around 4.1 million barrels during the week ending October 26, following a rise by roughly 6.3m in the previously tracked week
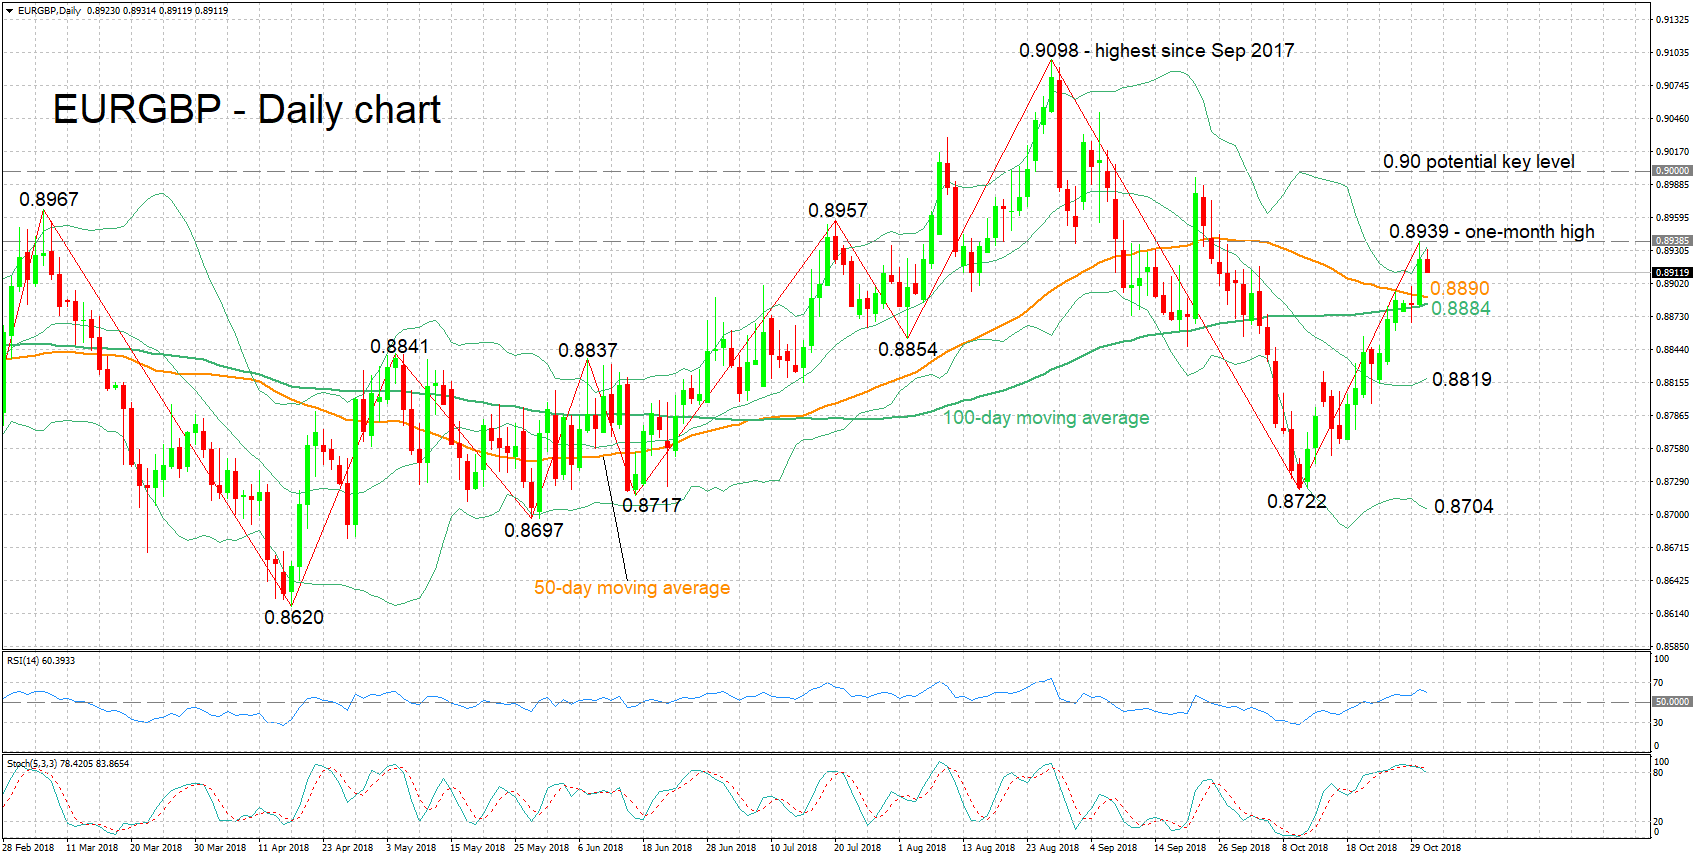
Technical Analysis: EURGBP bullish bias though stochastics signal caution in very short-term
EURGBP has staged a recovery after hitting its lowest since mid-June of 0.8722 on October 10. On Tuesday it touched a one-month high of 0.8939, while it is currently trading not far below that peak. The RSI, which is in bullish territory and has been rising in recent weeks, is projecting a bullish short-term picture. The stochastics though are signaling that losses may be in store in the very short-term; the %K and %D lines have recorded a bearish cross.
Stronger-than-anticipated inflation figures out of the eurozone are likely to push the pair higher. Immediate resistance could take place around yesterday’s high of 0.8939; the area around this captures a couple of tops from previous months at 0.8957 and 0.8967, as well as the upper Bollinger band at 0.8933. Further above, the 0.90 handle may act as a psychological barrier, while higher still, the attention would turn to late August’s high of 0.9098.
On the downside and in the event of disappointing data out of the euro area, support may come around the current levels of the 50- and 100-day moving average lines at 0.8890 and 0.8884 respectively; the zone around these includes numerous tops and bottoms from the past. Steeper losses would shift the focus to the middle Bollinger line at 0.8819 – a 20-day MA line –, while further below the 0.8722 bottom would increasingly come into scope.
Brexit headlines can also move the pair.
EURJPY Turns Slightly Positive In Short-Term But Stuck Below Downtrend Line
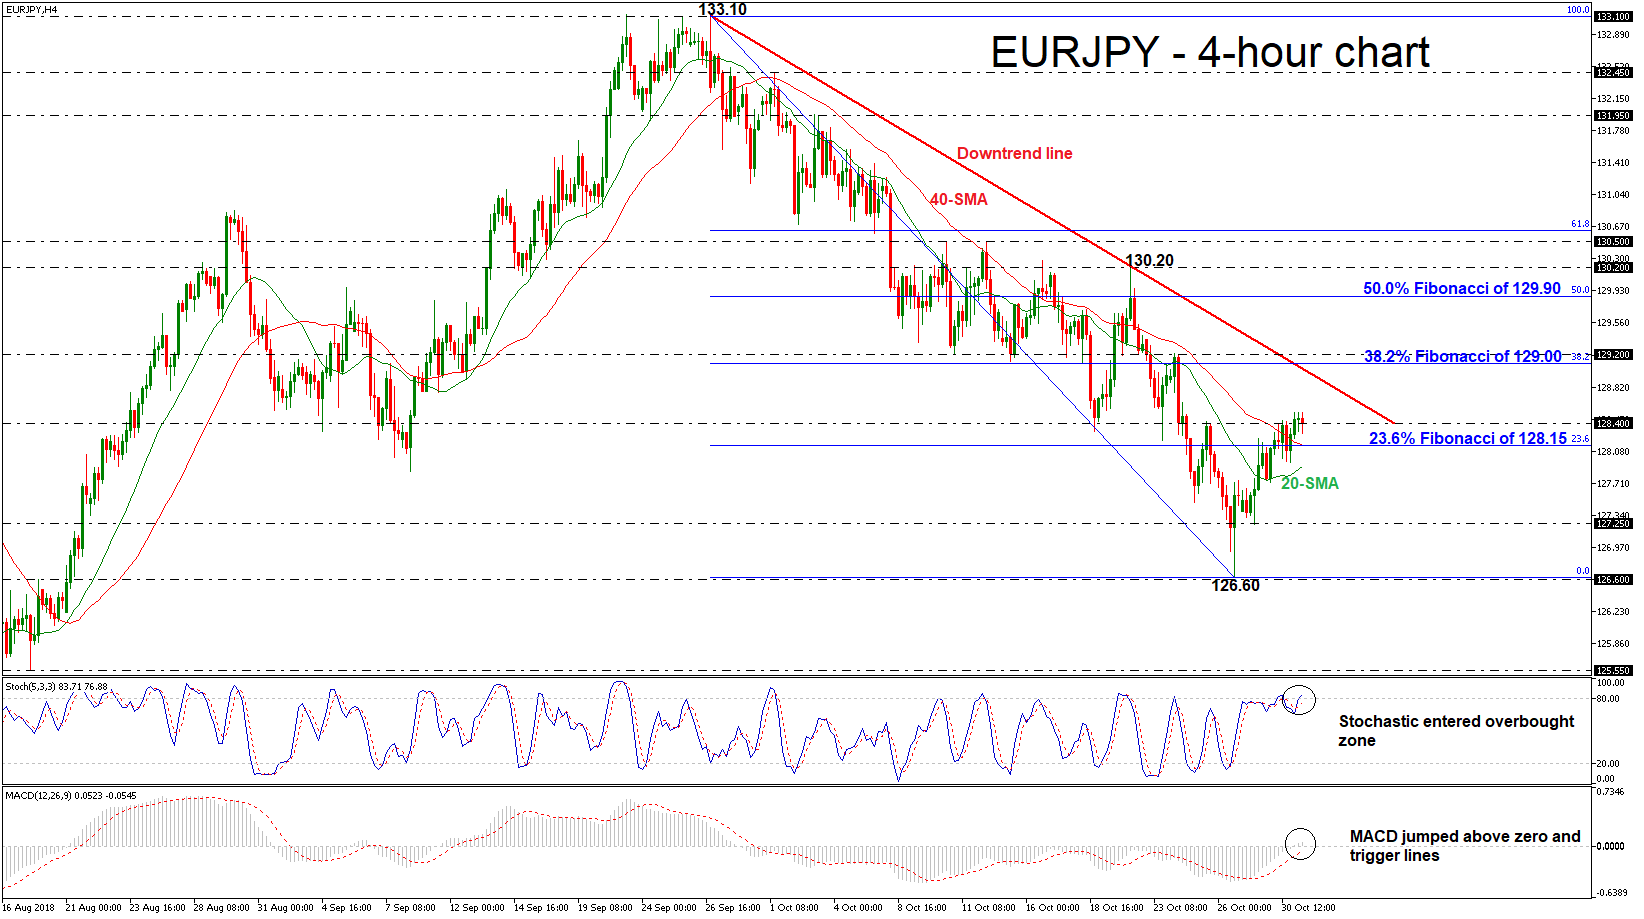
EURJPY has moved considerably higher following the rebound on the two-month low of 126.60 in the previous week. This week the pair has been higher, and the technical indicators are confirming the recent upside movement. The stochastic oscillator jumped into the overbought zone, while the MACD entered the positive territory with weak momentum.
If prices are able to continue to move higher the next resistance for traders to watch is the 38.2% Fibonacci retracement level of the downleg from 133.10 to 126.60, around the 129.00 handle, which stands near the short-term descending trend line. Even higher, the pair could meet the 50.0% Fibonacci of 129.90, while a jump above this level would open the way towards the 130.20 hurdle.
However, if the market manages to turn to the downside again and breaks below the 23.6% Fibonacci of 128.15, which coincides with the 40-simple moving average (SMA) in the 4-hour chart, the price could slip until the 20-SMA near 127.90, at the time of writing. Below this level, the price could hit the 127.25 support barrier.
Zooming into the near-term picture, in the 4-hour chart, EURJPY has been trading within a short-term downtrend over the past months after the price bounced off the 133.10 resistance level.
Oil Correction Over?
Trick or treat on final day of the month?
The final day of the month is shaping up to be a treat for investors following what has been an otherwise shocking month for stock markets.
Positive momentum has been gathering throughout the Asian and European sessions in what investors will be hoping is a sign that the worst of the sell-off is behind us. October has truly lived up to its reputation this year, with the major indices in the US wiping off all gains for the year and entering correction territory along the way.
The way markets have traded recently, I wouldn’t exclude the possibility that October has one more trick in store, but the start to trade today has certainly been encouraging. Volatility remains high and with it, anxiety, but if we can get through the next couple of days relatively unscathed, investors may start to smell opportunities and bargains and the tide could turn back in favour of the bulls.
Oil correction over?
Oil is riding the positive momentum wave higher this morning, paring some of its recent losses having also suffered at the hands of the October effect. Of course, there have been other factors at play, but in a similar manner to stocks, traders may now be looking at oil and see the sell-off as being overdone. I think we’ll have a better idea of traders views on oil later on today following the release of the EIA inventory data. A build of 5.7 million barrels, reported by API on Tuesday, was effectively shrugged off by traders. Should the same happen following the EIA release today, it may suggest the correction has run its course.
Gold shows anxiety remains
Gold is trading around 0.5% lower this morning as risk appetite picks up but what’s interesting here is the declines are much less significant than the corresponding gains in risk assets. I wonder whether this is a sign of the still underlying caution among investors, still unsure that any bounce has the resilience to withstand the next test from above. The more we see the bulls retake control in stocks, the more these moves in Gold could fade.
Data and earnings keep traders busy
As is the case for the rest of the week, there’s plenty on the calendar today for investors to focus on. It’s been a busy week for earnings and we have another 37 S&P 500 companies reporting today. The big economic releases may be coming later in the week but ADP non-farm employment, US employment cost index and EIA crude inventories today should be enough to keep us busy.
USDJPY Outlook: Bulls May Take A Breather After Post-BoJ Rally Shows Signs Of Fatigue
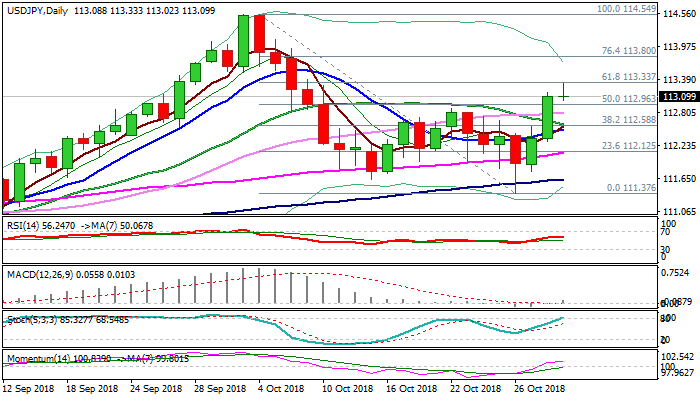
The pair hit three-week high at 113.33 on Wednesday, in extension of strong rally in past two days, after BoJ kept its ultra-low rates unchanged but emphasized downside risk, with focus on the inflation.
The dollar gained over 1% against yen in past two days, with strong acceleration on Tuesday, sparked by rise in US consumer confidence which rose to 18-year high in October.
Persisting trade tensions between the US and China, which threaten of escalating, add to the positive outlook for the greenback on risk-off mode.
Technical studies are bullish on daily chart and support further advance, but bulls may take a breather after facing strong headwinds at 113.33 (Fibo 61.8% of 114.54/111.37 downleg) as slow stochastic enters overbought zone.
Overextended 4-hr studies support the idea of corrective dip before bulls resume.
Broken 30SMA (112.82) mark initial support, with extended dips expected to find ground at 112.60 zone (broken 20SMA / top of thick hourly cloud) and keep bulls intact.
Res: 113.33, 113.80, 114.10, 114.54
Sup: 113.02, 112.82, 112.60, 112.30
USD/CAD Bullish Consolidation Before Bounce
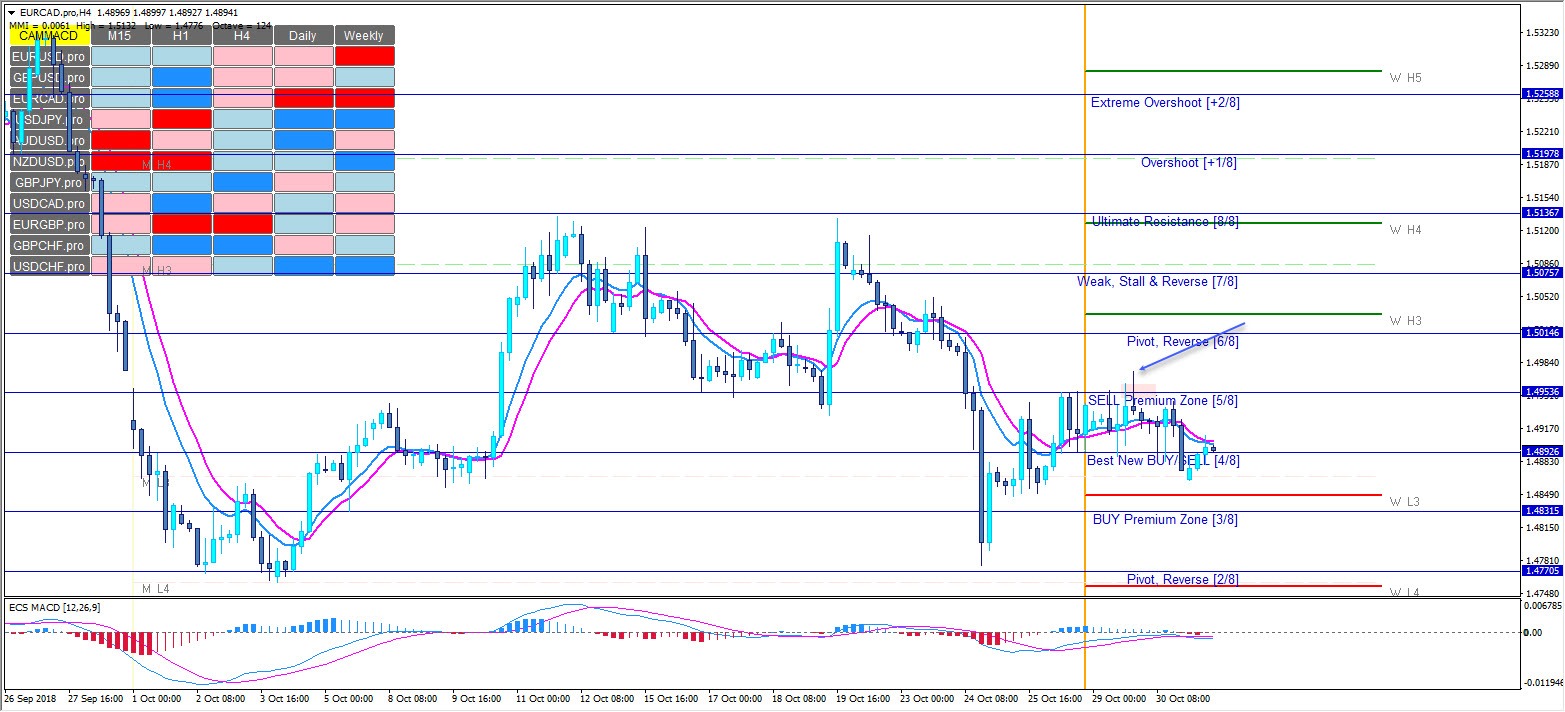
This indicates a bullish pressure that will be materialized if the price closes above 1.3153 W H3 and 7/8 confluence. Look for continuation above towards 1.3214 if that happens. If we see a pullback look for 1.3060-90 zone rejection towards 1.3153 and 1.3214. Only if the price closes below 1.3030, bulls will lose steam and the price might get a deeper pullback. At this point its all bullish.
Brexit: No News is Bad News
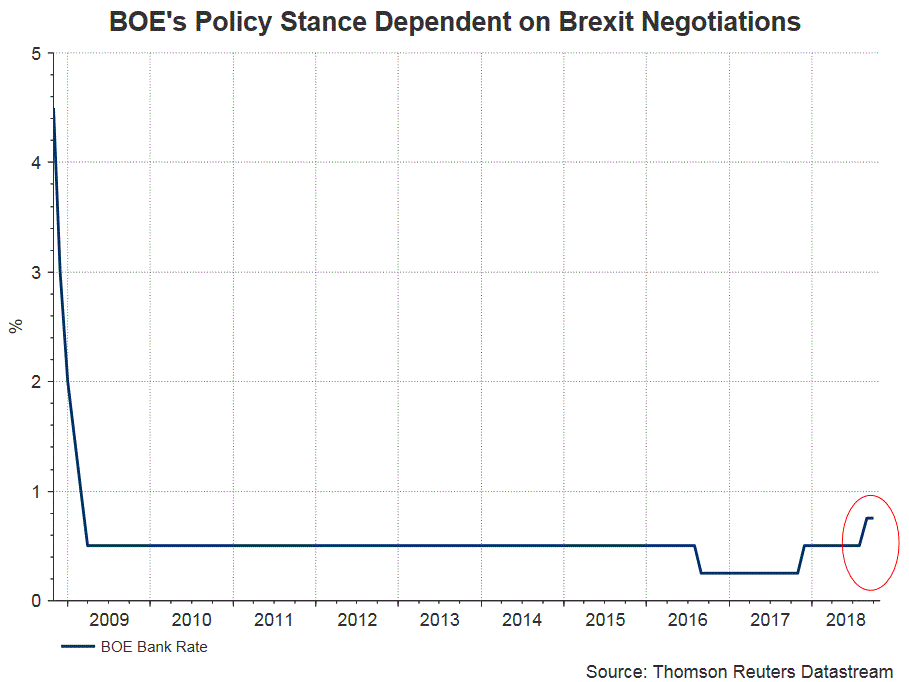
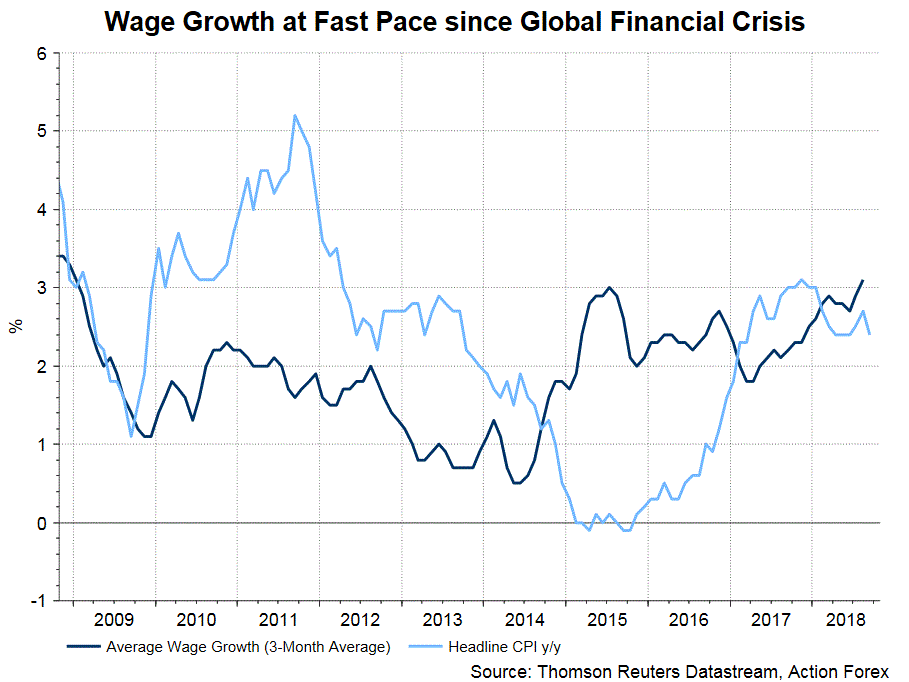
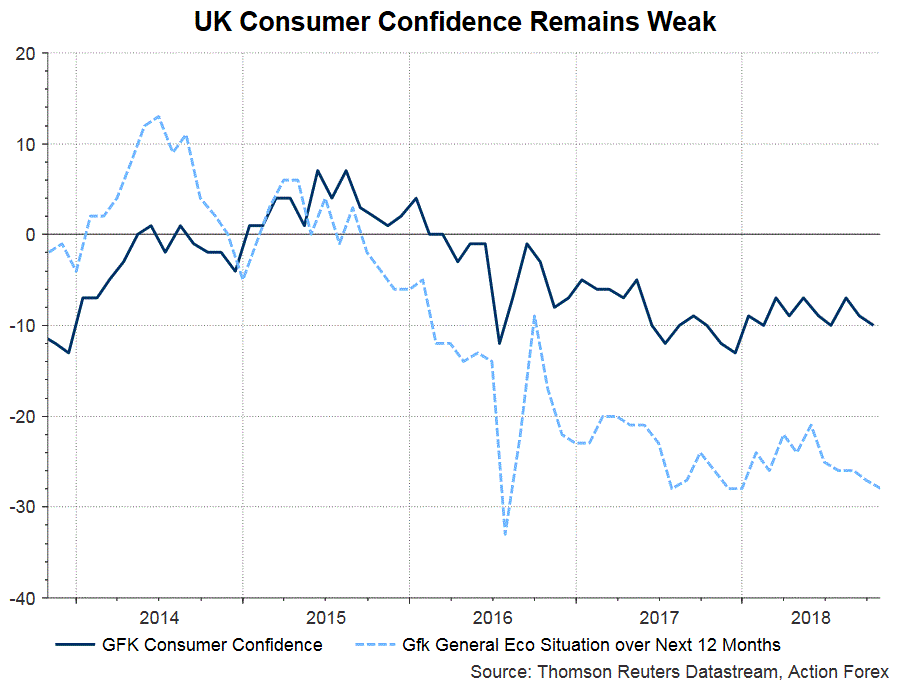
At the meeting later this week, we expect BOE members to vote unanimously to keep the Bank rate unchanged at 0.75% and the asset purchase program at 435B pound. The macroeconomic indicators released during the inter-meeting period are mixed, while no progress on Brexit negotiations although the deadline is approaching. Chancellor Phillip Hammond declared “austerity has ended” in his Budget speech. Fiscal easing might have to accelerate the pace of BOE rate hike. However, with Brexit uncertainty unresolved, it would be a dilemma for the central bank. S&P has recently warned that, in case of a no-deal Brexit, the country’s inflation would jump while household wage slumps. The magnitude of house price decline would be similar to that after the 2008 financial crisis. We believe Brexit outcome remains the biggest uncertainty that affects BOE’s monetary policy, leading it to retain the “gradual and limited” stance.
The Remaining 5%
The EU summit on October 18-19 turned out to be a non-event. It was originally scheduled as the deadline of reaching a deal on the Withdrawal Agreement. Due to the sluggishness of previous talks, the summit only aimed at getting some progress on the Irish border issue for paving the way for further negotiations in November. Yet, not even that was achieved- EU scrapped plans for November summit due to “not enough progress”. While PM Theresa May has affirmed that 95% of the Withdrawal Agreement has been done, the “considerable sticking point” remains the Irish border and the related backstop plan, a safety net that avoids a hard border between the Irish Republic (Eurozone member) and Northern Ireland (part of the UK) after Brexit.
Back in March, the EU released a draft legal text, suggesting that, if no better solutions were found, Northern Ireland would stay in the EU customs union and most parts of the single market, unless and until a long-term trade deal is agreed upon that kept the border as open as it is now. The UK rejected the proposal, suggesting that it is an invasion to sovereignty (Northern Ireland adopts EU law and creates a border in the Irish Sea). It then counter-proposed that the WHOLE UK, together with North Ireland, would align with the EU customs arrangement for “a limited period” after 2020. This has been rejected by the EU.
Gambler May
Meanwhile, PM Theresa May also proposes to lengthen the transition period (Mar 29, 2019 to Dec 31, 2020) so that the UK could buy time “make a sovereign decision”. She affirmed that this could “not be indefinite” and would finish “well before the end of this parliament” – i.e. mid-2022.
If there were no contingent summit in November, the hope is on the summit on December 13-14. Even if the Irish border issue is resolved, clearing the way for the deal on the Withdrawal Agreement, another challenge is ratification by the UK Parliament. It appears the PM May would use the tactic of time pressure – pushing the bill for a parliamentary vote a week before Christmas. She hopes that it would limit the time for Brexit hardliners to mobilize against her. On the flip side, however, she also would limit the time for her to gather support. There is chance that she would lose the gamble. Back in 2017, her call for a snap election, hoping to enlarge Tory’s majority in the parliament, ironically shrank its power.
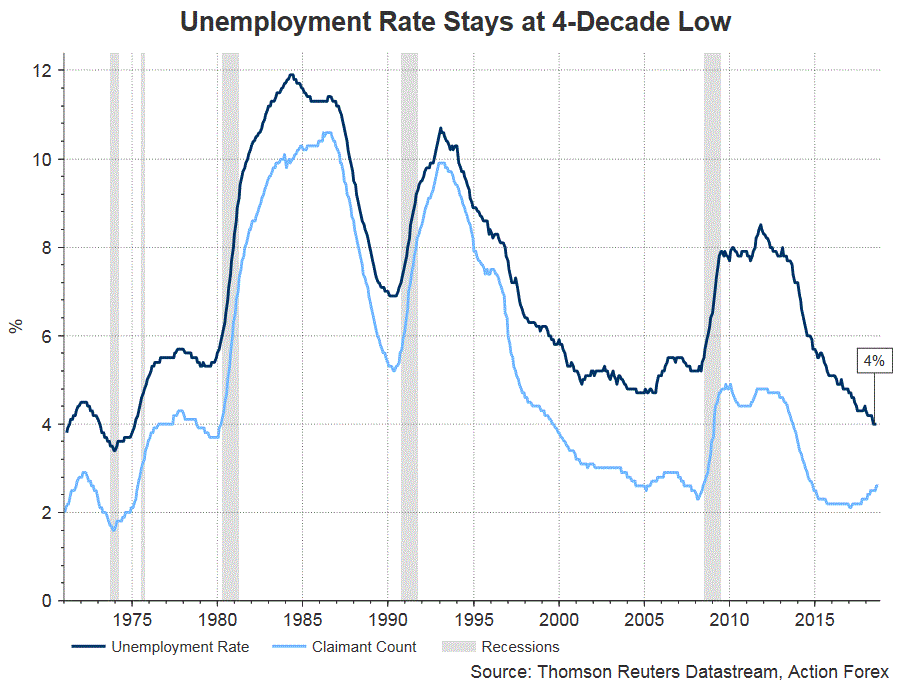
S&P has recently warned of the disaster of a no deal Brexit. As it suggested, the scenario would send the unemployment rate to 7.4% by 2020, from 4% as of September. House prices would fall by -10% over 2 years, while office prices in London could dive-20% in 2- 3 years, a fall similar to the one just after the 2008 financial crash. Household incomes would drop by 2,700 pound per year, while inflation would jump to a peak of 4.7% in mid-2019.
While our base case remains that a Withdrawal Agreement would be agreed upon before the beginning of the transition period, the risk of no-deal Withdrawal Agreement) has increased as the official date of UK leaving EU approaches.
AUDUSD Outlook: Aussie Dips After Weak Australian/Chinese Data And Extends Directionless Mode
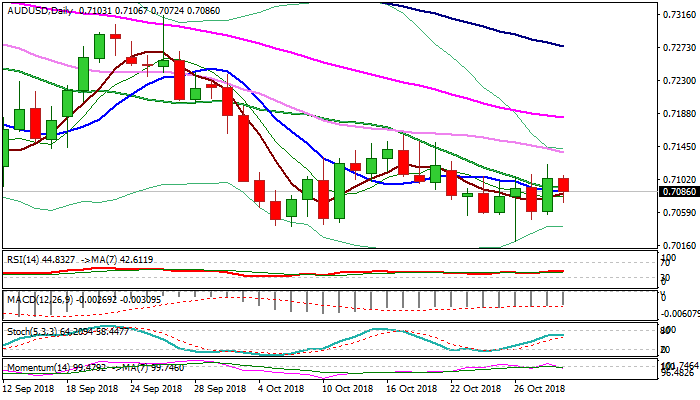
The Australian dollar holds in red in early Wednesday's trading and reverses a part of previous day's strong rally, pressured by weaker than expected Australian CPI data (inflation q/q was up 0.4% in Q3, missing forecast for 0.5% rise).
Also, weaker than expected China PMI's added to AUD's negative stance Wednesday.
The Aussie failed to benefit from positive signal on previous day's bullish outside day pattern (Wednesday's rally peaked at 0.7122 – one week high but was unable to hold gains and the price returned to multi-day congestion).
Fresh bearish momentum is building on daily chart, keeping the downside vulnerable, as 10/20SMA's are returning to bearish setup.
However, near-term mode remains directionless while the price holds between 0.7040 base and falling 30SMA (0.7135) with break of either side to generate initial direction signal.
Bearish scenario requires sustained break below 0.7040 base and close below psychological 0.7000 support to confirm continuation of larger downtrend.
Conversely, lift above 30SMA would provide relief, but extension and close above falling 55SMA (0.7182) is needed to signal reversal.
Res: 0.7122, 0.7135, 0.7159, 0.7182
Sup: 0.7072, 0.7050, 0.7040, 0.7020
Crude Oil Under Pressure
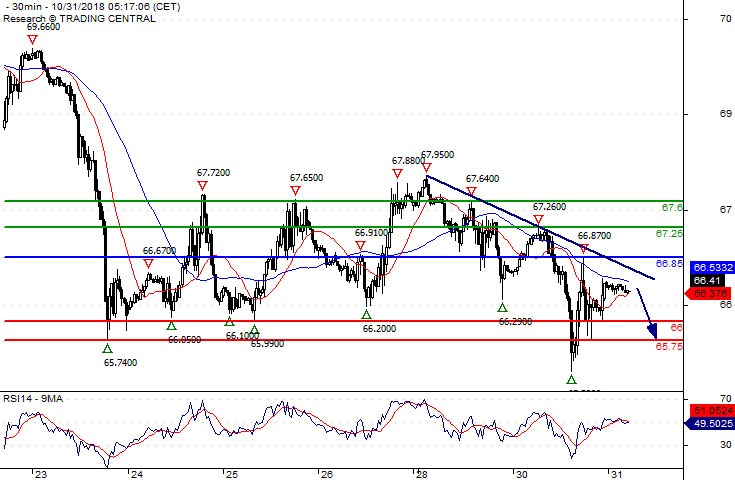
Pivot (invalidation): 66.85
Our preference Short positions below 66.85 with targets at 66.00 & 65.75 in extension.
Alternative scenario Above 66.85 look for further upside with 67.25 & 67.60 as targets.
Comment As Long as 66.85 is resistance, likely decline to 66.00.