Sample Category Title
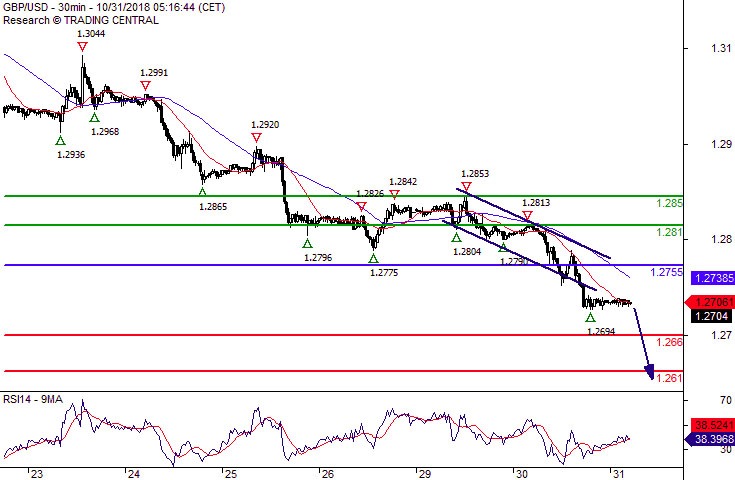
GBP/USD 1.2610 Expected
Pivot (invalidation): 1.2755
Our preference Short positions below 1.2755 with targets at 1.2660 & 1.2610 in extension.
Alternative scenario Above 1.2755 look for further upside with 1.2810 & 1.2850 as targets.
Comment As Long as the resistance at 1.2755 is not surpassed, the risk of the break below 1.2660 remains high.
EUR/USD The Downside Prevails
Pivot (invalidation): 1.1365
Our preference Short positions below 1.1365 with targets at 1.1335 & 1.1300 in extension.
Alternative scenario Above 1.1365 look for further upside with 1.1385 & 1.1415 as targets.
Comment A break below 1.1335 would trigger a drop towards 1.1300.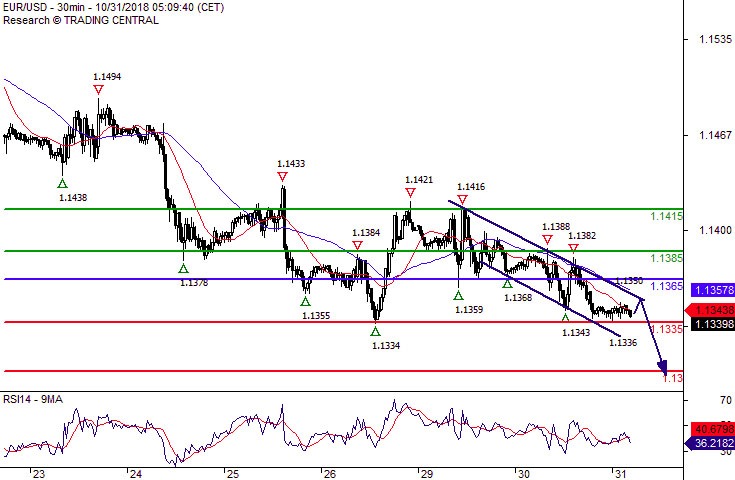
S&P 500 Further Advance
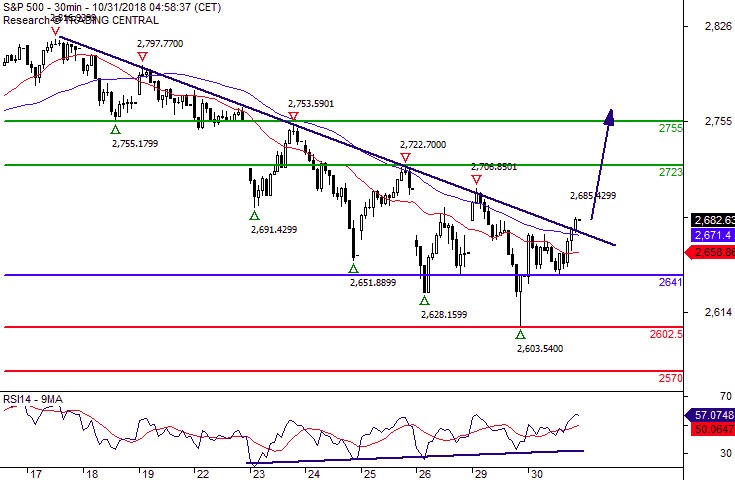
Pivot (invalidation): 2641.00
Our preference Long positions above 2641.00 with targets at 2723.00 & 2755.00 in extension.
Alternative scenario Below 2641.00 look for further downside with 2602.50 & 2570.00 as targets.
Comment The RSI shows upside momentum.
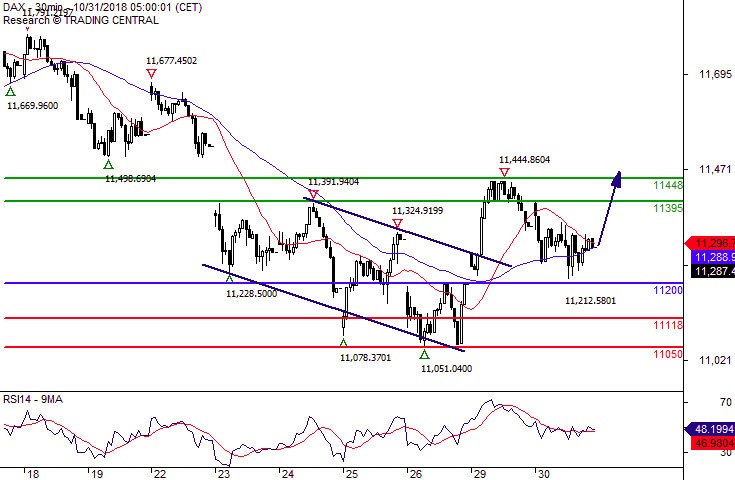
DAX Rebound In Sight
Pivot (invalidation): 11200.00
Our preference Long positions above 11200.00 with targets at 11395.00 & 11448.00 in extension.
Alternative scenario Below 11200.00 look for further downside with 11118.00 & 11050.00 as targets.
Comment A support base at 11200.00 has formed and has allowed for a temporary stabilisation.
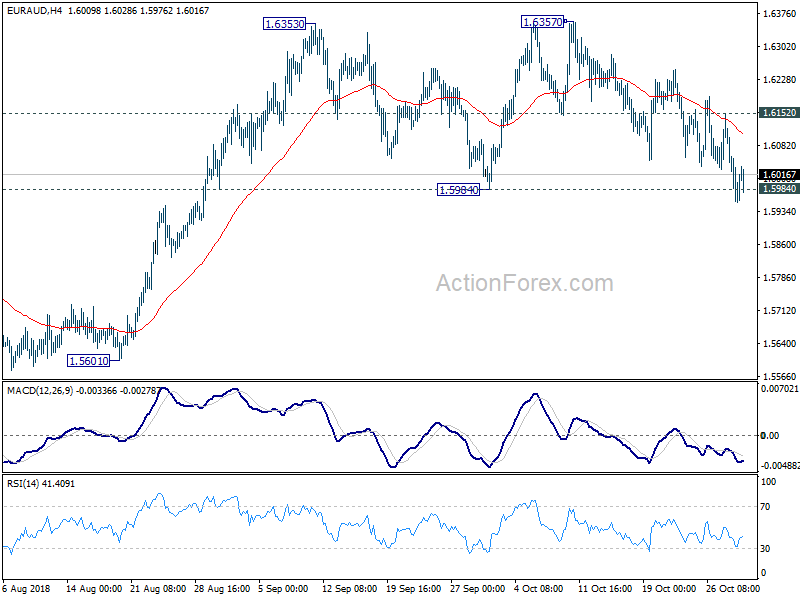
EUR/AUD Daily Outlook
Daily Pivots: (S1) 1.5907; (P) 1.6015; (R1) 1.6074; More....
EUR/AUD recovered quickly after breaching 1.5984 support. Intraday bias stays neutral first. On the upside, break of 1.6152 will suggest the choppy decline from 1.6357 has completed. Intraday bias will be turned back to the upside for retesting 1.6357 first. However, on the downside, decisive break of 1.5984 will be an early sign of trend reversal and turn outlook bearish.
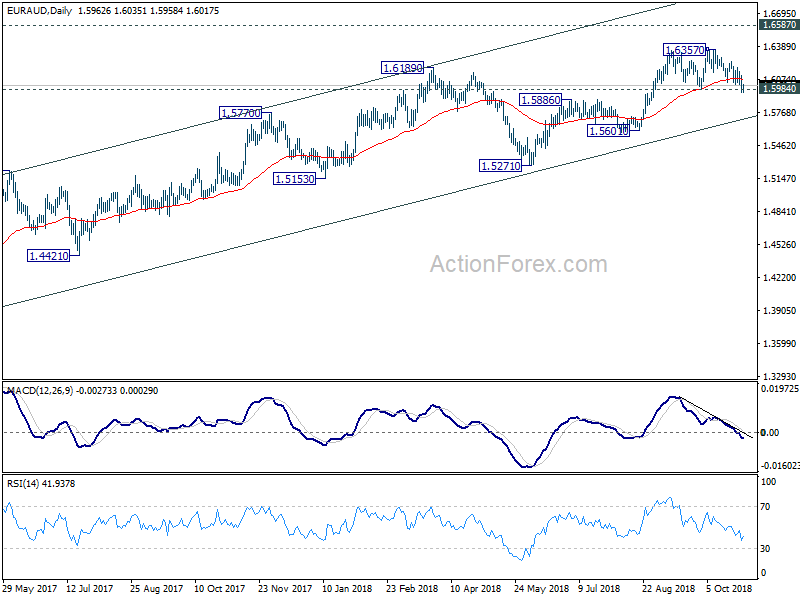
In the bigger picture, up trend from 1.3624 (2017 low) is still in progress. Further rise should be seen to retest 1.6587 (2015 high). Decisive break there will resume the long term rally and target 1.7488 fibonacci level. On the downside, break of 1.5984 support is need to be the first sign of medium term reversal. Otherwise, outlook will remain bullish in case of deep pull back. However, sustained break of 1.5984 will be an early sign of trend reversal and turn focus to 1.5601 support for confirmation.
AUDUSD Creates Weak Movement, Still Below Descending Trend Line
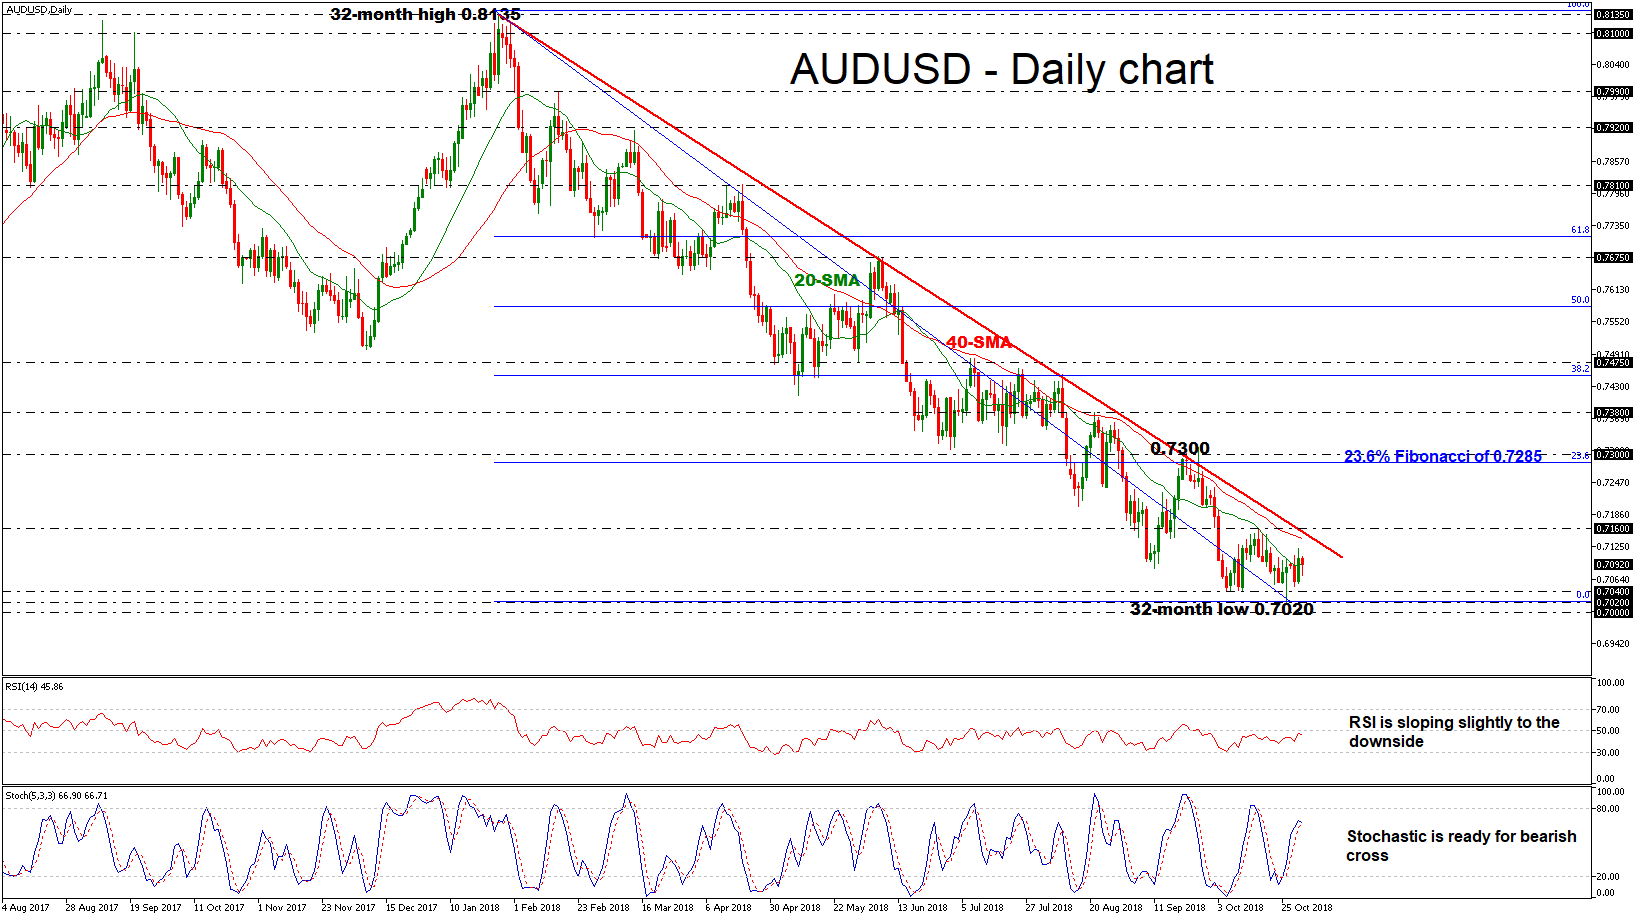
AUDUSD remains under pressure and risk is still to the downside as prices continue to drift lower in the long-term timeframe. The short-term picture shows signs for some weakness as the price has been developing within a sideways channel over the last month. It is worth mentioning that the price recorded a fresh 32-month low of 0.7020 over the preceding week but failed to end the day near this level.
Having a look at the technical indicators, in the daily timeframe, the RSI indicator stands slightly below the threshold of 50 and is sloping to the downside. Moreover, the blue %K line of the stochastic oscillator is ready to post a bearish crossover with the red %D line in the middle area. Both indicators are suggesting neutral to bearish moves in the next few sessions.
Further losses could find immediate support at the 0.7020 barrier, achieved on October 26. If the latter fails to halt bearish movements, the next target could be the 0.7000 round figure, identified by the bottom on February 2016. A sharp bearish rally below this hurdle could open the door for the 0.6830 support, reached on January 2016.
On the flip side, the price could attempt to retouch the falling trend line, which is just above the 40-SMA and near the 0.7160 resistance level. Should traders continue to buy the pair above that significant obstacle, shifting the long-term downtrend to a more neutral one, resistance could then run towards the 0.7300 handle, which holds around the 23.6% Fibonacci retracement level of the downleg from 0.8135 to 0.7040.
To sum up, AUDUSD remains in a descending movement over the last nine months after the pullback on the 0.8135 level and has failed to create a noteworthy bullish retracement.
EUR/USD Slips Below 1.1350
Markets
Global core bonds traded mixed yesterday with US Treasuries edging lower and German Bunds closing marginally higher. Second day in a row that European and US equities mirrored each other. European indices closed yesterday's session with (limited) losses after disappointing Q3 GDP results and a fall in economic confidence. Italy's data showed stagnation in growth, pushing Italian BTP futures back south. The spread over Germany increased again to well above 300 bps. US equities opened higher to enter a volatile day of trading. Only in the last trading hours, US indices rallied higher to close in green (+1.5%-2.0%). US Treasuries edged gradually lower throughout the day. The US yield curve shifted 3.4 bps (2-yr) to 3.8 bps (10-yr) higher. The German yield curve bull flattened with yields falling 0.1 bp (2-yr) to 1.5 bps (30-yr). The dollar took the upper hand on FX markets with the trade weighted dollar testing the 2018 high. EUR/USD settled in the lower 1.13-1.14 area. EUR/GBP edged somewhat higher in yesterday's session but this was more related to sterling weakness. There was no brexit news to steer trading, leaving EUR/GBP at 0.892.
Asian stock markets reflect WS's optimism despite disappointing Chinese/Japanese eco data. Especially Chinese PMI's send a worrying signal, with the manufacturing index just holding above the 50 boom/bust mark. The US Note future struggles and the dollar keeps going. The greenback manages gains in both a risk-on and risk-off context the past couple of days The trade weighted dollar sets a new 2018 high, north of 97. EUR/USD slips below 1.1350, grinding towards the 1.1301 2018 low. The USD/JPY rally brings the pair above 113 with lower inflation forecast by the BoJ adding to yen weakness. EUR/GBP holds above 0.89 going into tomorrow's BoE meeting.
Today's eco calendar contains EMU unemployment rate, EMU CPI, US ADP employment and Chicago PMI. The unemployment rate is expected to stabilize at 8.1%, the lowest level since the end of 2008. Inflation is expected to accelerate from 2.1% Y/Y to 2.2% Y/Y for the headline reading and from 0.9% Y/Y to 1.1% Y/Y for the core. Spanish, German and Belgian inflation readings suggest such an increase is likely. It would strengthen ECB president Draghi's recent comments that he expect a vigorous pick-up in core inflation because of wage growth, the economic expansion and the ECB's easy monetary policy. This scenario might weigh on the Bund especially if European equities build on yesterday's WS strength. It could give the euro some reprieve, but ongoing dollar strength and nearby support suggest at least at test of the 1.1301 mark. US eco data are interesting, but probably no market movers ahead of tomorrow's ISM and Friday's payrolls.
News Headlines
The Indian government wants to enact a never-used provision in the Reserve Bank of India act which would allow them to consult and give instructions for RBI governor to act on certain issues "in the public interest". The central bank and government are at odds on issues like the handling of weak state-run lenders, tight liquidity and resolving bad loans at power generators. USD/INR rises back above 74, closing in on the 74.48 all time high.
Chinese PMI's disappointed. Both the manufacturing and services gauges declined more than forecast, respectively from 50.8 to 50.2 and from 54.9 to 53.9. The manufacturing PMI hit the lowest level since July 2016, confirming a broad decline in economic activity as the US trade war bites. Australian inflation fell back below the RBA's 2%-3% target in Q3 (1.9% Y/Y from 2.1% Y/Y). The central bank's trimmed mean CPI was unchanged at 1.8% Y/Y. Inflation readings will strengthen the central bank's view that no policy action is needed within the next 12 months and could keep AUD/USD in the defensive. Japanese industrial production declined by 1.1% in September (vs -0.3% estimate).
The Bank of Japan kept its monetary policy unchanged, but downgraded inflation forecasts in its new quarterly outlook report. Inflation is expected to remain below the 2% target until at least early 2021
October: The Calm Before The Storm For Bitcoin?
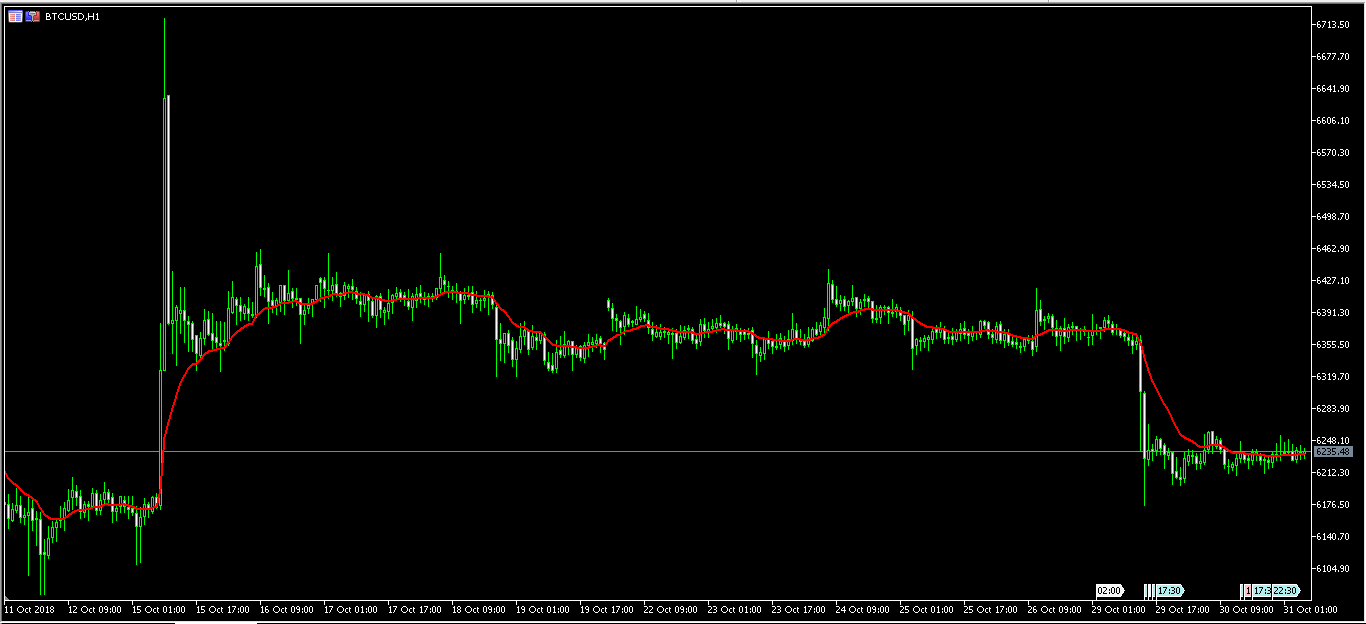
Over the past two weeks, the price of Bitcoin has been largely unmoved and has seen the least volatility since 2016. This is in contrast to the overall stock market with the CBOE Volatility Index reaching the highest level in October since early this year. Bitcoin’s low volatility was mostly because of the lack of major regulatory updates or exchange hacks.
During October, investors were disappointed when BlackRock failed to talk cryptocurrencies in the third quarter earnings call. Perhaps, the biggest news during the month was the decision by Fidelity to start a new custodial services company targeted at institutional clients. This was significant because Fidelity is one of the largest brokerage companies in the world. Furthermore, its services would solve the biggest problem that large investors have with Bitcoin – how to store it.
There was also a meeting between the SEC, CBOE and VanEck that focused on the failed ETF attempt. Issues that prevented the SEC from approving the Bitcoin ETF are said to have been resolved which could result in a green light in the near future. Traders are watching the markets carefully, however, and awaiting updates. This is because last year, when the CME and CBOE launched the Bitcoin futures, it was seen as a key factor that would attract more participants – but recent data has shown that Bitcoin futures are traded thinly on these exchanges.
With a level of uncertainty in the air, the volatility in the price of Bitcoin could be the calm before the storm. This could mean that in November, the price could move sharply in either direction.
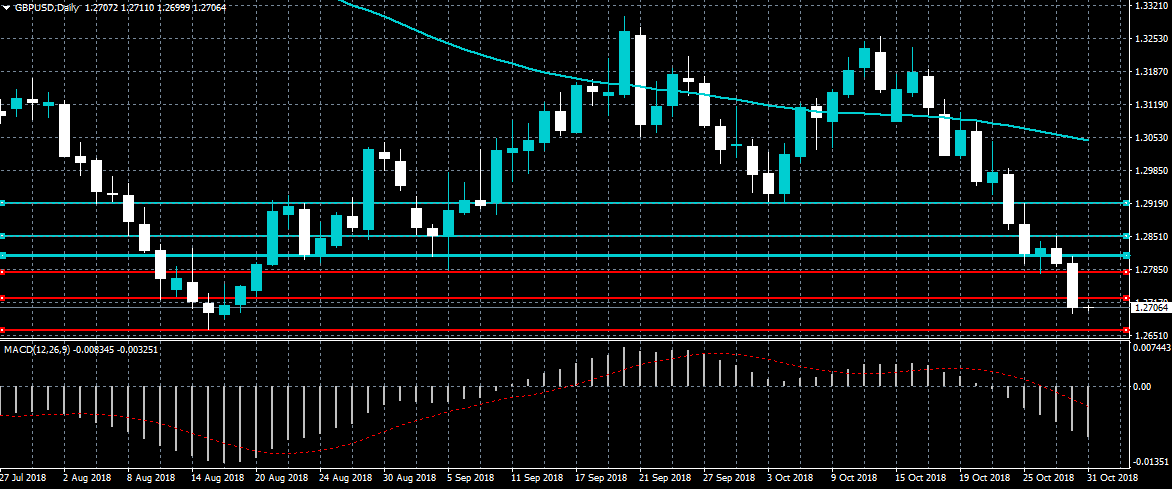
GBPUSD 2018 Trading Low In Focus
The British pound is testing towards the 1.2700 support level against the US dollar following Tuesday’s bearish technical break below the 1.2785 level. The pairs 2018 trading low, at 1.2861, is now in focus with a move below this key level likely to expose the GBPUSD pair to losses towards the 1.2550 level. Buyers need to move price above the 1.2730 level to negate immediate selling pressures.
The GBPUSD pair is strongly bearish while trading below the 1.2785 level, key support is now found at the 1.2700 and 1.2661 levels.
If the GBPUSD pair moves above the 1.2730 level, buyers may test towards the 1.2785 and 1.2820 resistance levels.
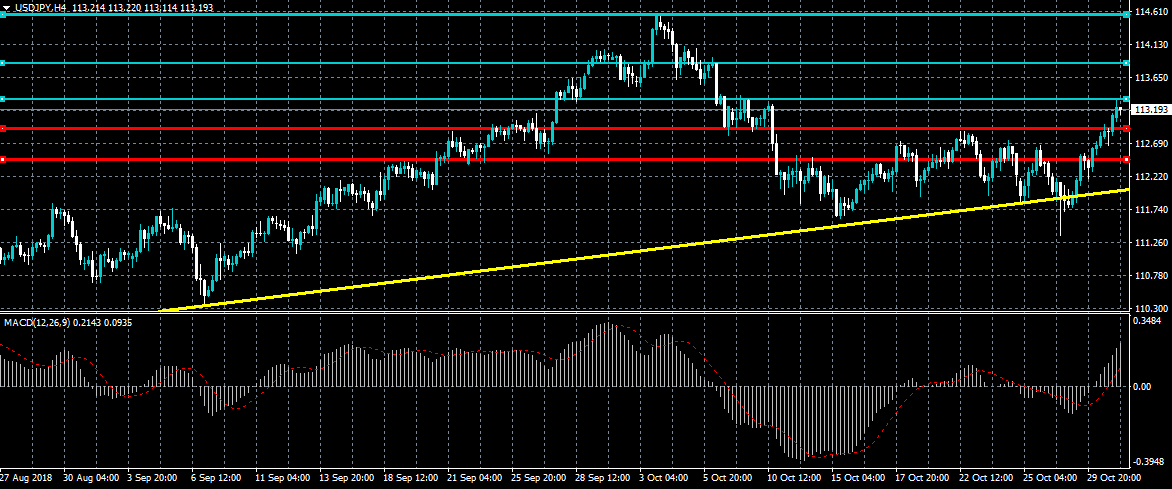
USDJPY Strongly Bullish Above 112.87
The US dollar has moved above the 113.00 resistance against the Japanese yen currency after buyers performed a key technical breakout above the 112.87 level. The USDJPY pair now has a strong intraday bullish bias and is supported by overall US dollar strength. Buyers need to break the 113.30 resistance level for further bullish advancement, while sellers need to push price below the 112.87 level.
The USDJPY pair is strongly bullish while trading above the 112.87 level, key resistance is now found at the 113.30 and 113.80 levels.
If the USDJPY pair trades below the 113.00 level, sellers are likely to test the 112.87 and 112.45 support levels.