Sample Category Title
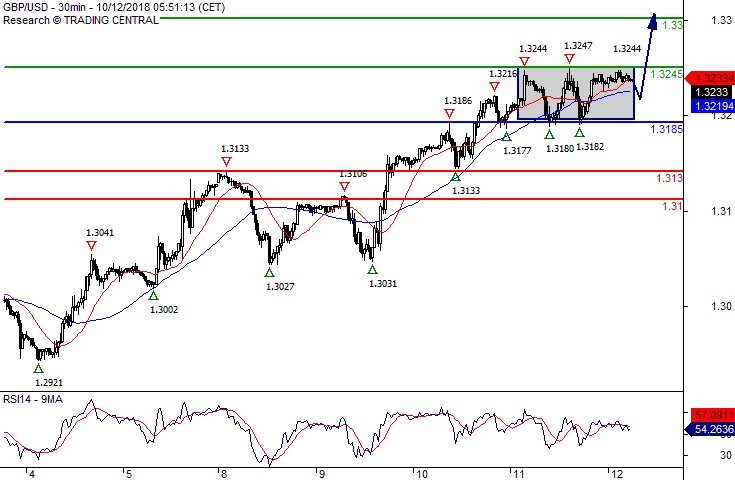
GBP/USD Watch 1.3300
Pivot (invalidation): 1.3185
Our preference Long positions above 1.3185 with targets at 1.3245 & 1.3300 in extension.
Alternative scenario Below 1.3185 look for further downside with 1.3130 & 1.3100 as targets.
Comment The RSI is mixed to bullish.
EUR/CHF Daily Outlook
Daily Pivots: (S1) 1.1412; (P) 1.1451; (R1) 1.1509; More...
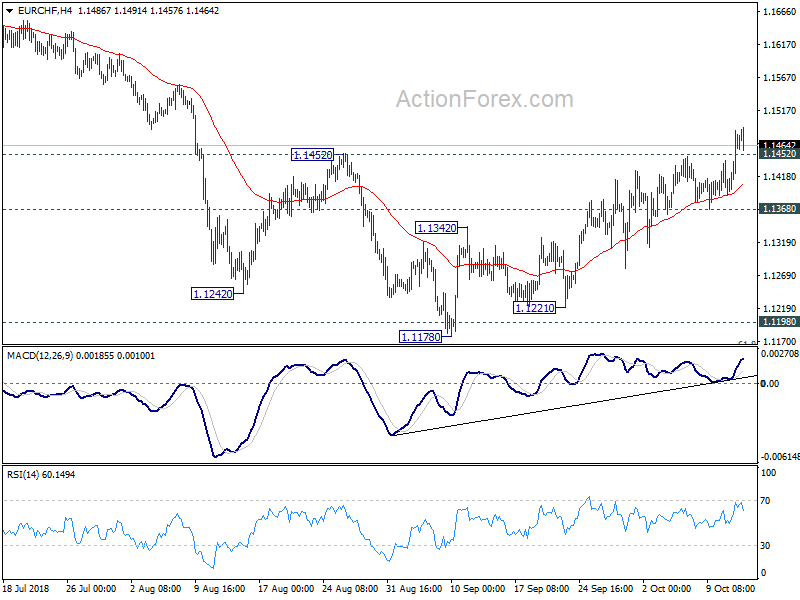
EUR/CHF's break of 1.1452 resistance affirms the case of bullish trend reversal after being support from 1.1154/98 zone. Intraday bias is now on the upside for 1.1713 resistance for confirmation. Break will target 1.2004 key resistance again. On the downside, break of 1.1368 support is needed to indicate completion of the rebound. Otherwise, outlook will stay cautiously bullish in case of retreat.
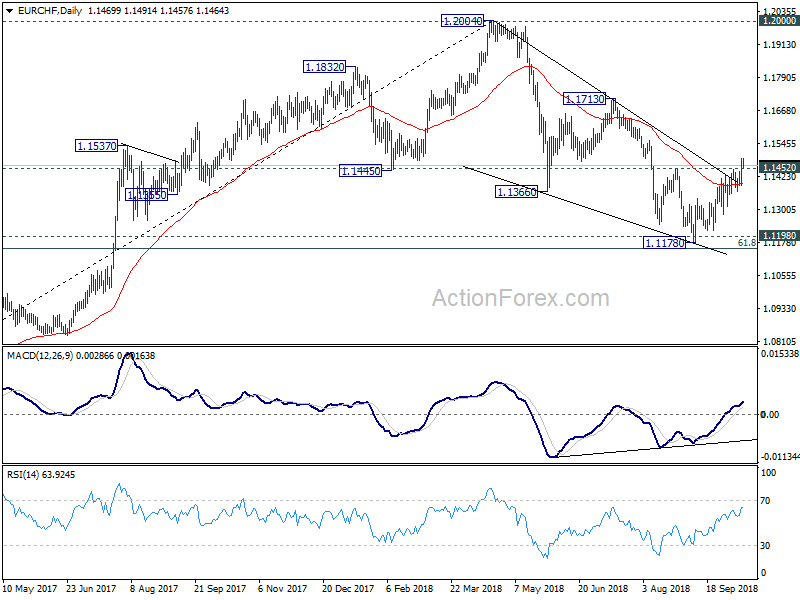
In the bigger picture, price actions from 1.2004 medium term top is seen as a correction only. Downside should be contained by support zone of 1.1198 (2016 high) and 61.8% retracement of 1.0629 to 1.2004 at 1.1154 to complete it and bring rebound. This cluster level is in proximity to long term channel support (now at 1.1234) too. A break of 1.2 key resistance is still expected in the medium term long term. However, sustained break of the mentioned support zone will mark reversal of the long term trend. In that case, 1.0629 key support will be back into focus.
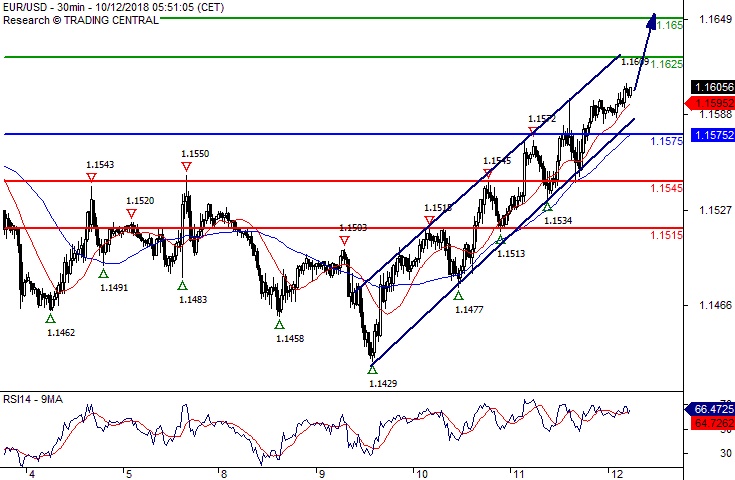
EUR/USD Target 1.1650
Pivot (invalidation): 1.1575
Our preference Long positions above 1.1575 with targets at 1.1625 & 1.1650 in extension.
Alternative scenario Below 1.1575 look for further downside with 1.1545 & 1.1515 as targets.
Comment The RSI is bullish and calls for further upside. The pair is trading within a bullish channel drawn from the low of October 9.
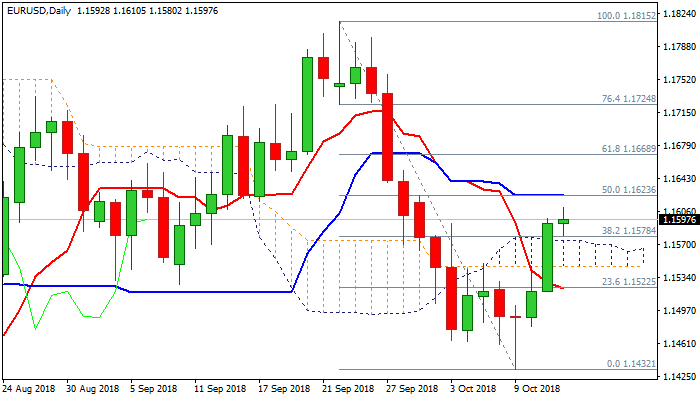
EURUSD Outlook: Bulls Look For Test Of Converged 20/30SMA’s, Broken Daily Cloud Underpins
The Euro holds positive tone in early Friday’s trading and consolidating above daily cloud, following Thursday’s strong rally which resulted in break and close above cloud.
The single currency was up 0.65% on Thursday (the biggest one-day gains since 20Sep), supported by weaker dollar as fresh sell-off was triggered by weaker than expected US CPI data.
Positive tone from the minutes of the ECB’s last policy meeting, which suggests the central bank was on track to start normalizing its ultra-loose policy, added to Euro’s positive sentiment.
Bullish signals on Thursday’s close above daily cloud top / Fibo 38.2% of 1.1815/1.1432 descend signal that recovery rally from 1.1432 (09 Oct spike low could extend.
Fresh bulls eye a cluster of barriers at 1.1618 (converged 20/30SMA’s), 1.1623 (50% of 1.1815/1.1432) and 1.1628 (100SMA), with break here to generate fresh bullish signal.
The pair is on track for bullish weekly close (after two weeks in red) as fresh acceleration higher penetrated thick weekly cloud (cloud base lays at 1.1578), which provides further positive signals.
Rising momentum on daily chart supports, however, MA’s are still in mixed mode and slow stochastic is overbought, suggesting that bulls may take a breather before continuing.
Top of broken daily cloud marks strong support (1.1574) and weekly close above here would add to bullish stance.
Res: 1.1618, 1.1628, 1.1668, 1.1724
Sup: 1.1574, 1.1545, 1.1532, 1.1518
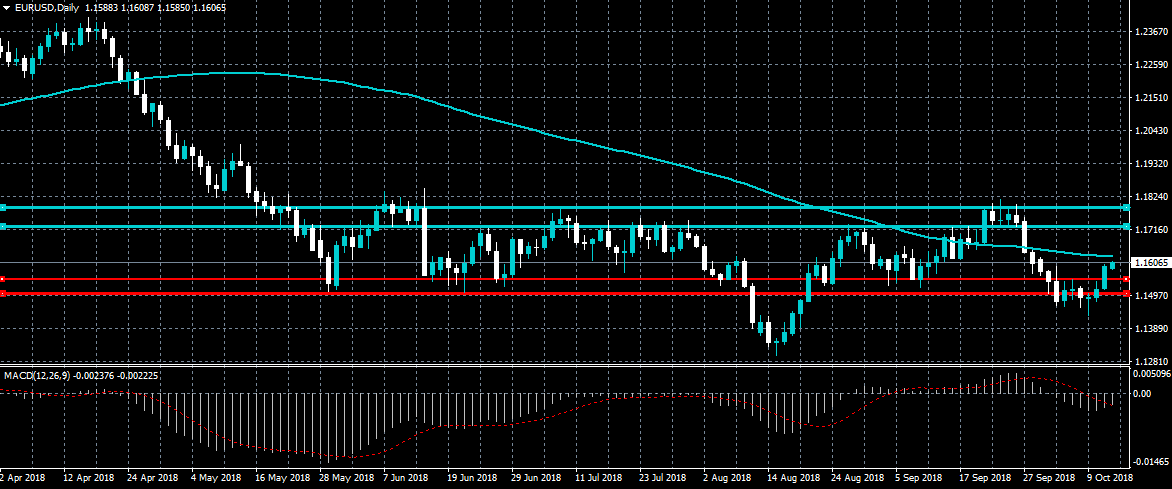
EURUSD Aiming For 100 Day Moving Average
The euro currency continues to press higher against the US dollar in early Friday trading, with price now holding above the 1.1600 level. The MACD indicator is trending higher on the daily time frame while the EURUSD pair is still exhibiting bullish price-action. Buyers are currently aiming for the pairs 100-day moving average, while sellers need to close the week below the 1.1553 level.
The EURUSD pair is strongly bullish while trading above the 1.1600 level, key resistance is found at the 1.1627 and 1.1650 levels.
If the EURUSD pair declines below the 1.1600 level, key intraday technical support is found at the 1.1575 and 1.1553 levels
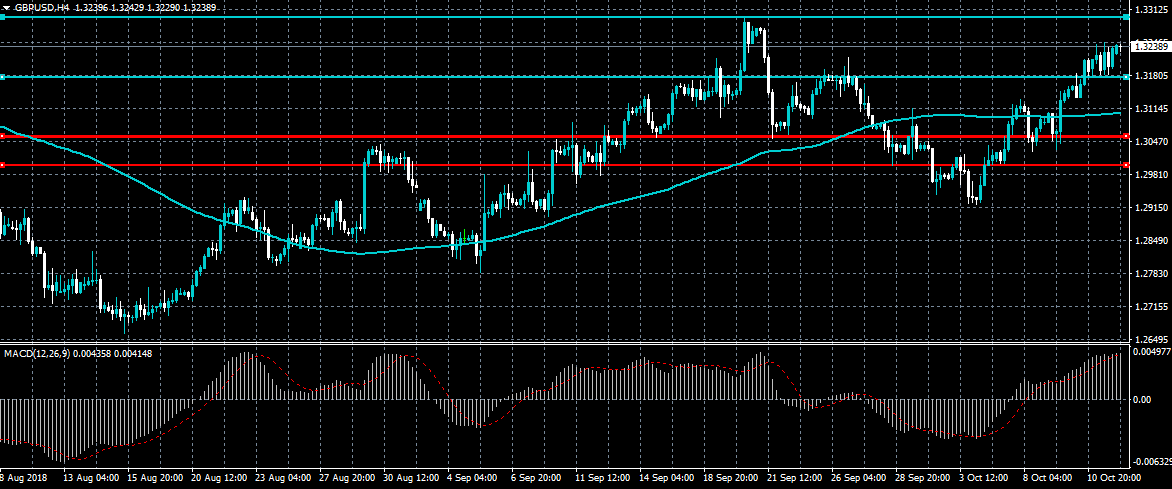
GBPUSD Further Gains Expected Above 1.3180
The British pound continues to benefit from weakness in the US dollar, with buyers now testing towards the current weekly trading high. The intraday bullish bias in the GBPUSD pair remains intact while price trades above the 1.3180 support level. Buyers will attempt to break the 1.3297 resistance level, while sellers will look to force the GBPUSD pair below the 1.3180 level to shift the intraday bias.
The GBPUSD pair is strongly bullish while trading above the 1.3180 level, key resistance is found at the 1.3245 and 1.3297 levels.
If the GBPUSD pair moves below the 1.3180 level, key support is found at the 1.3155 and 1.3110 levels.
Crude Oil Price Falls Sharply After Buildup In Investories
The US dollar declined against major peers in the Asian session. This was a continuation of the weakness experienced this week. Yesterday, data from the Labor Department showed that inflation numbers for September rose at a slower rate than traders were expecting. During the month, the CPI rose at an annualized rate of 2.3%, which was lower than the expected 2.7%. The core CPI rose at an annual rate of 2.2% which was lower than the expected 2.3%. The slow growth in inflation was mostly because of energy prices. Inflation, recent market performance and pressure from President Trump could lead the Fed to reconsider its decision to continue hiking interest rates.
The price of crude oil continued the decline started on Wednesday following data from the Energy Information Administration (EIA). On Wednesday, data from the American Petroleum Institute (API) showed an inventory build-up of more than 9.75 million barrels. This was higher than the expected 2.6 million barrels. Yesterday, the EIA released inventory data that missed analysts’ forecasts. Crude oil inventories reached 5.65 million barrels, which was higher than the 2.62 million barrels that traders were expecting. Data came a few hours after OPEC lowered the demand for crude oil. In previous months, the price of crude oil has moved up as traders anticipate a reduction of demand as the US imposes sanctions on Iran.
China released its trade numbers that were better than expected. In September, exports rose by more than 14%, which was higher than the 8.9% traders were expecting. At the same time, imports rose by 14.3%, which was lower than the 15% traders were expecting. In total, the trade surplus increased to $31.6 billion. This was higher than the expected $19 billion. The country’s trade surplus with the United States widened to a record $34 billion. This number has been a focus of the Trump administration, which has imposed tariffs to limit Chinese exports to the US.
EUR/USD
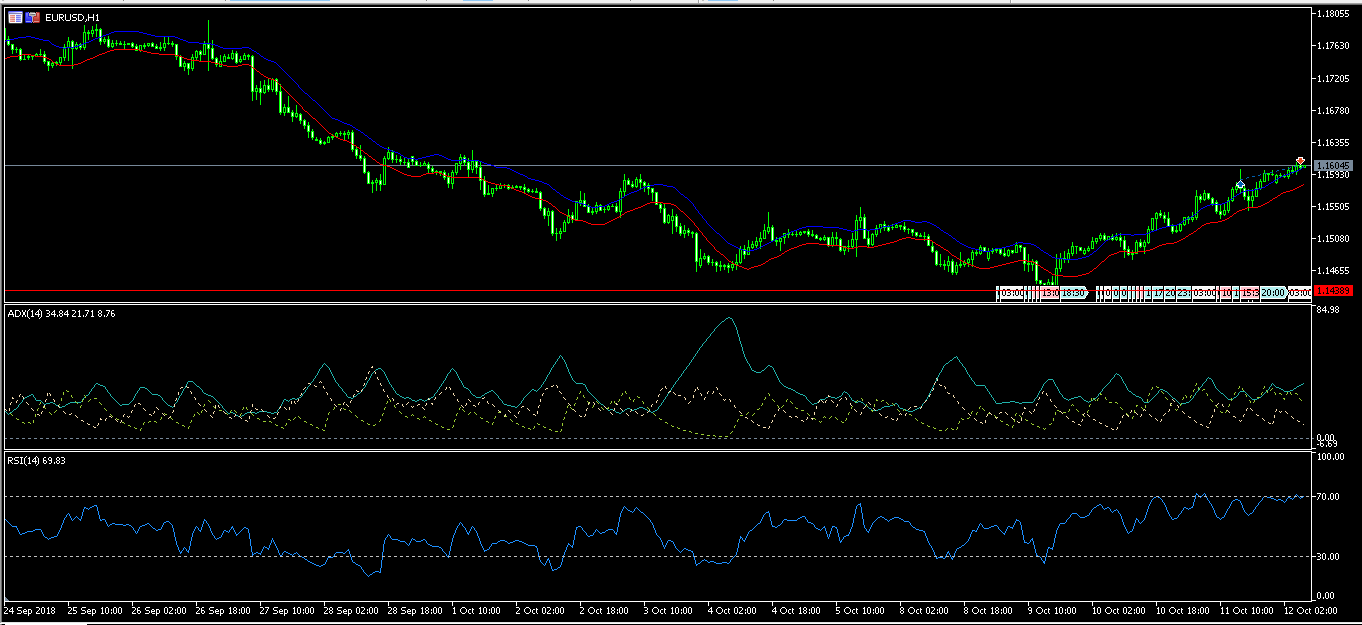
The EUR/USD pair rose to an intraday high of 1.1605 in the Asian session. This was a continuation of the rally that started this week when the pair reached a low of 1.1438. With no major economic data expected from the EU and US today, the pair will likely continue the upward movement. This is confirmed by trend indicators like ADX which is currently at 34. The RSI is currently at 69 while the MACD line shows that the pair might continue to move up.
GBP/USD
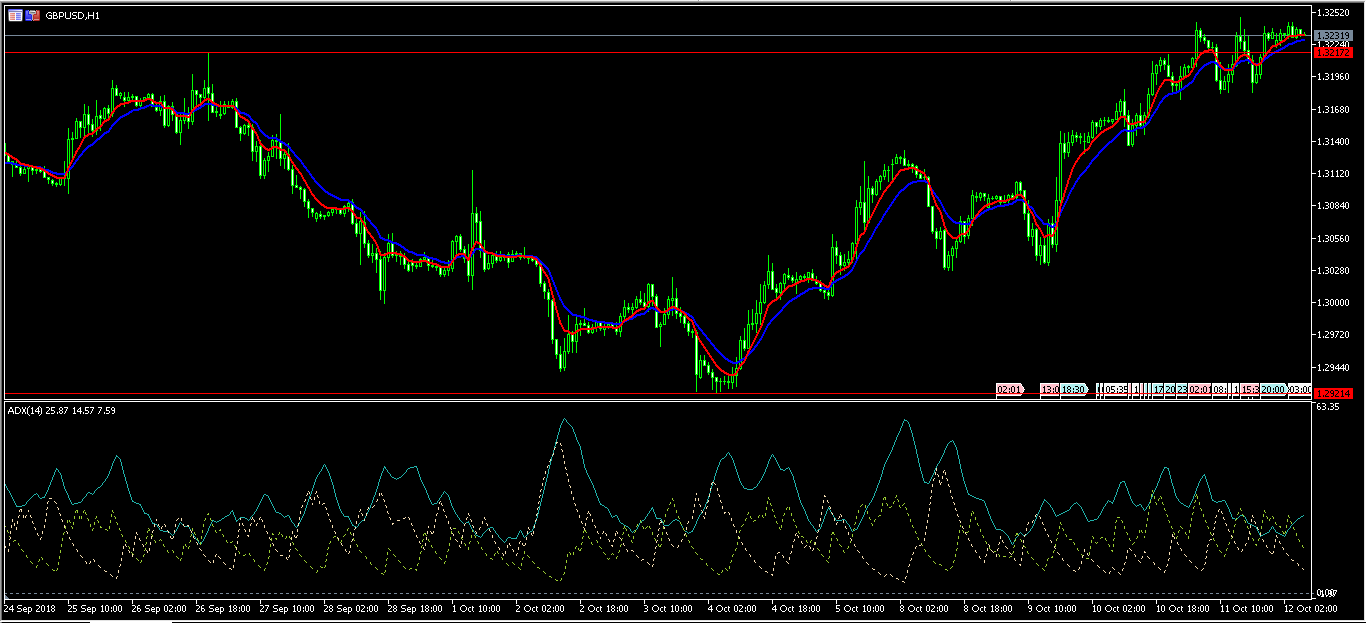
On Wednesday, the GBP/USD pair moved above the important 1.3217 level. This was the highest level since September 27. It was also the end of the cup level that the pair had been establishing. Gains by the GBP were because of the USD weakness and the hopes that a compromise will be found on Brexit negotiations. The ADX is currently at 25, an indication that the strength of the trend has eased. Similarly, the double EMA shows that the gap between the two has narrowed. Therefore, while the pair could continue moving up, traders should be cautious because it might also move lower to complete the cup and handle pattern.
XTI/USD
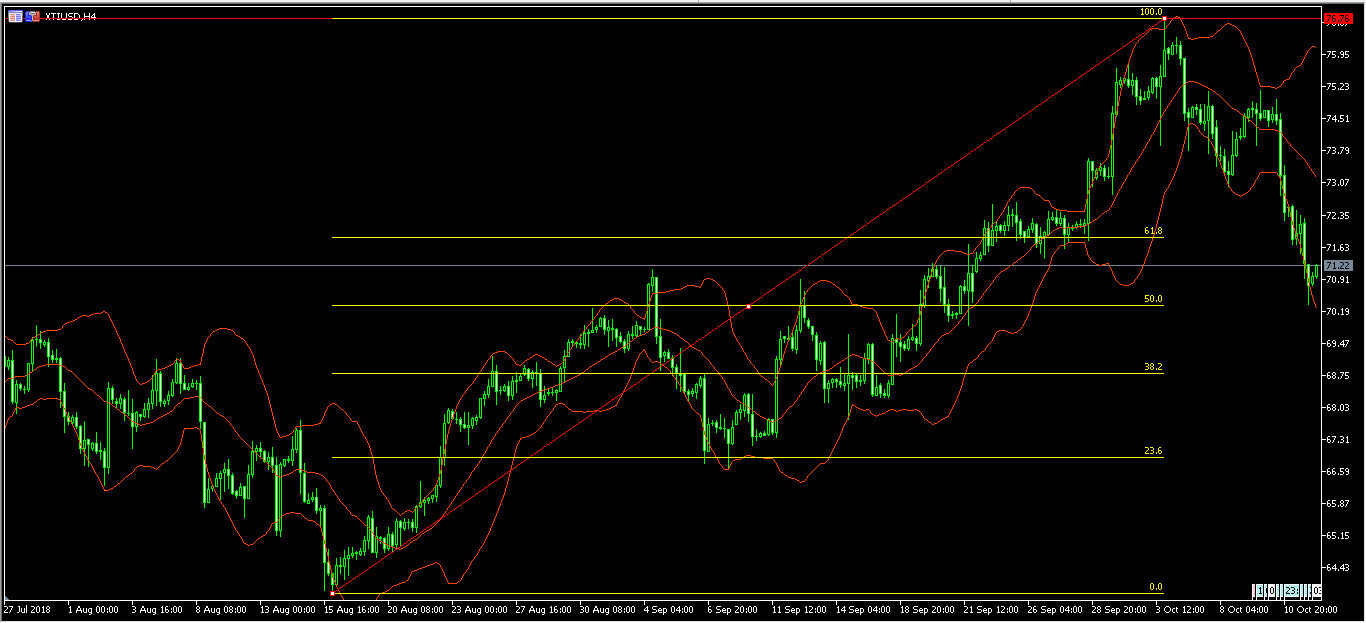
Last week, the price of Brent reached a record high of $76.76 as traders placed their hopes on Iran sanctions. This week, the price declined sharply and today, it reached a low of $70.35. This was after the increase in inventories. Today’s low was along the 50% Fibonacci Retracement level. It was also along the important psychological level of $70. The price is currently along the lower band of the Bollinger Bands and is likely to continue to move lower.
Equity Selloff Continues, But Shows Signs Of Abating
Here are the latest developments in global markets:
FOREX: The dollar index is practically flat on Friday, licking its wounds following considerable losses in the previous session, which were owed to a pullback in US Treasury yields. The euro capitalized on this weakness, gaining ground almost across the board even as the Italian budget drama continues to lurk in the background. The yen, meanwhile, was weaker than one would have expected considering the recent market turmoil.
STOCKS: Wall Street indices extended their latest tumble on Thursday, though the magnitude of the losses was smaller than previously. The Dow Jones (-2.13%) and the S&P 500 (-2.06%) fell below their 200-day moving averages, a technical barrier that provided reliable support in the past. Meanwhile, technology stocks – that were hammered the most earlier – were more resilient, with the tech-heavy Nasdaq Composite declining by 1.25%. Encouragingly though, sentiment seems to have reversed, with futures tracking the S&P, Dow, and Nasdaq 100 suggesting all these indices are set to open more than 1.3% higher today. Likewise, Asia was a sea of green on Friday. Japan’s Nikkei 225 (+0.46%) and Topix (+0.03%) bounced, while in Hong Kong, the Hang Seng gained 1.81%. Europe was a similar story, with all benchmarks set to open much higher today, futures suggest.
COMMODITIES: Oil fell on Thursday alongside energy stocks. It rebounded today alongside risk appetite, though not enough to recover its losses, with WTI trading higher by 1.1% at $71.76 per barrel, and Brent gaining 1.18% to reach $81.20/barrel. There was little in the way of fundamental news in oil markets, with investors still weighing anticipated supply outages in Iran with a clouded demand outlook amid worries of a slowdown in China. In precious metals, gold finally showed signs of life, surging by more than $30 on Thursday to break above the upper bound of its recent range. The spike came on the back of a tumbling US dollar as well as broad-based risk aversion, though the yellow metal pulled back by 0.55% today to settle near $1218 per ounce. The close above the latest range has turned the near-term technical outlook to positive.
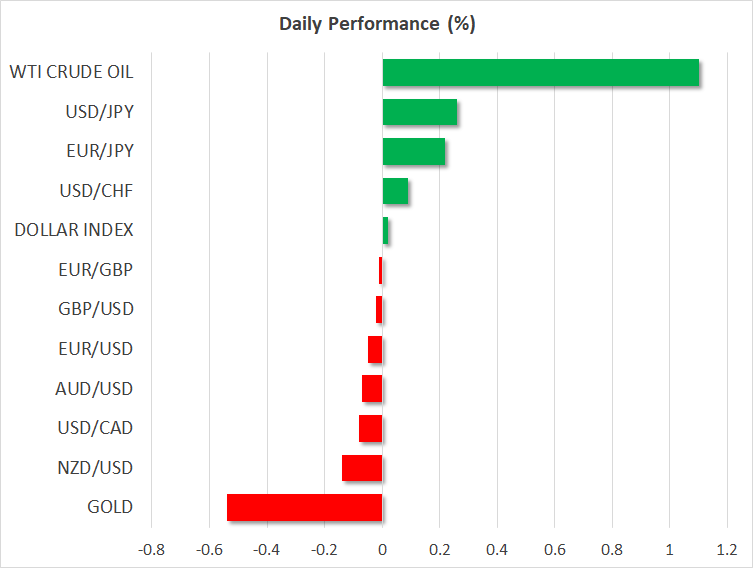
Major movers: Dollar tracks yields lower as equities extend selloff; Asia rebounds though
The stock market selloff continued yesterday, with all major US indices edging lower, albeit to a lesser extent than in the previous session. It’s noteworthy this rout occurred just ahead of the earnings season in the US, as it may also be a taste of markets being jittery around the results or the guidance firms will give, leading investors to limit their exposure beforehand. Disappointing US inflation data yesterday coupled with reports that the US and Chinese Presidents plan to meet towards the end of November likely helped to calm some nerves around yields and the trade conflict respectively, limiting any greater losses in stocks.
In a positive sign for the bulls, sentiment seems to have turned around during the Asian session on Friday, with most markets closing in the green. Additionally, futures tracking the US indices are also pointing to a material rebound today, which in the case of the Nasdaq would eclipse yesterday’s losses. One major factor providing comfort is probably the pullback in US bond yields. This can be seen as a self-correcting mechanism, where stocks begin to selloff as bond yields rise, leading investors to shift back to bonds amid the risk-averse environment, hence driving yields back down and calming the stock market.
Accordingly, the dollar was the worst performer in the currency market on Thursday, surrendering ground across the board as the pullback in US yields stole some of the currency’s shine. The euro capitalized on the dollar’s softness, advancing against all the majors besides the antipodeans – aussie and kiwi – both of which bounced sharply off 2 ½ year lows. Perhaps most striking was the yen, which pulled back against both the euro and pound despite the risk-off tones on Thursday. The Japanese currency is also weaker today, as the about-turn in risk sentiment seems to have taken the wind of the safe-haven’s sails.
Day ahead: University of Michigan consumer sentiment survey and eurozone industrial production coming up
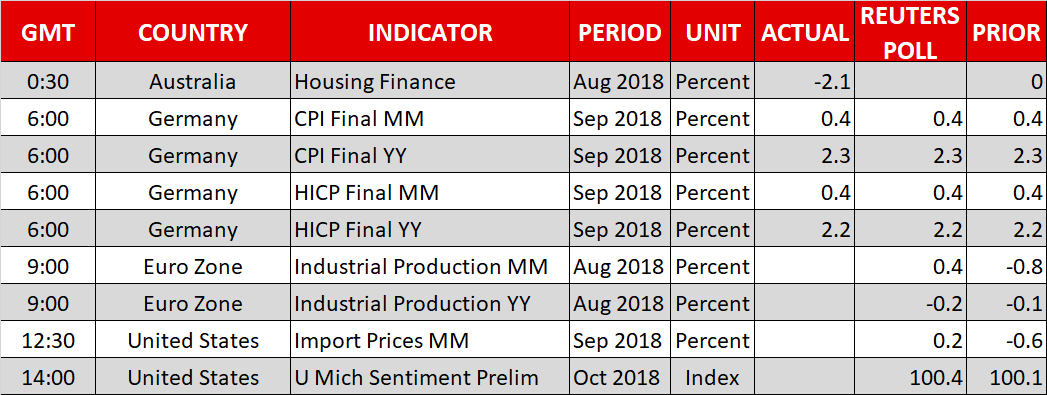
Friday’s calendar is relatively light, with the University of Michigan’s (U of M) consumer sentiment survey attracting interest and eurozone industrial production data also due out.
At 0900 GMT, eurozone industrial production figures for August will be made public. Month-on-month, production is anticipated to rise by 0.4%, partly rebounding from a 0.8% contraction in the two preceding months. Still, if actual results match estimates, the annual rate of growth in output would remain in negative territory during August.
Despite the euro extending its recovery from its lowest in around two months of 1.1429 hit on Tuesday, touching an 11-day high of 1.1610 earlier on Friday, its rebound may prove short-lived as worries over Italian and EU officials clashing over Italy’s spending plans remain firmly on the table. Also relating to this, credit ratings agency Fitch warned that it sees considerable risks to Italy’s new fiscal targets, especially beyond 2019.
The most important release on the US calendar is the U of M preliminary survey on October consumer sentiment. The relevant index measuring consumer morale is projected to slightly improve relative to September, and at 100.4 stand at its highest since March. The survey’s sub-indices gauging inflation expectations tend to be watched by markets. In this instance, they may attract additional attention in the aftermath of yesterday’s weaker-than-anticipated CPI readings out of the US.
Also due out of the US are data on September’s import and export prices (1230 GMT).
In terms of policymakers’ appearances, regional Fed Presidents Evans (non-voting FOMC member in 2018 – 1330 GMT) and Bostic (voter – 1545 GMT) are on the agenda. Bank of England chief economist Haldane will also be talking at 1400 GMT, though the topic of discussion renders any comments on monetary policy unlikely.
Elsewhere, the IMF and World Bank will hold meetings in Bali starting today; influential policymakers including the ECB chief Draghi will be attending the gatherings.
In energy markets, Baker Hughes data on active oil rigs in the US are scheduled for release at 1700 GMT.
In equities, JPMorgan Chase, Citigroup and Wells Fargo will be kicking off earnings season for big US banks. All three will be releasing their results before the US equity market open. Still, trade and yield angst remain at play and could divert attention out of corporate releases. Treasury yields did ease from cycle highs, though they still remain at relatively elevated levels. On Sino-US tensions, officials made reference to plans for a Trump-Xi Jinping meeting in November.
Technical Analysis: USDJPY bullish signal by stochastics in very short-term after pair touches 3½-week low
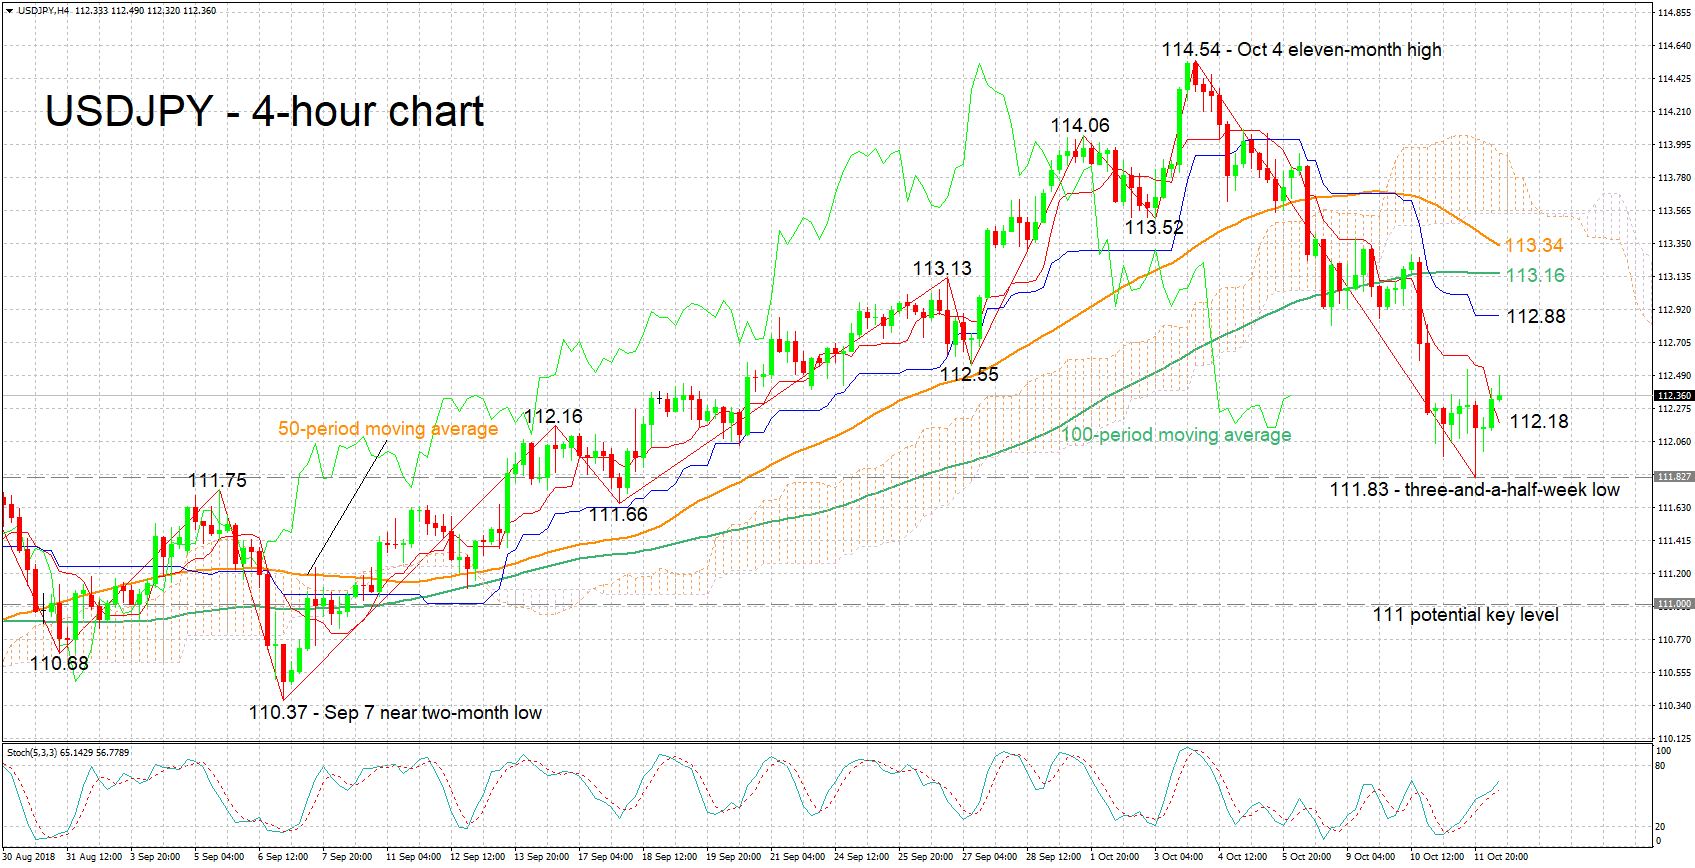
USDJPY posted considerable losses after reaching an 11-month high of 114.54 last week, eventually hitting a three-and-a-half-week low of 111.83 on Thursday. The negatively aligned Tenkan- and Kijun-sen lines are acting as a testament to the bearish short-term bias that is in place. However, the Kijun-sen halting its decline is a sign negative momentum is easing. Moreover, the stochastics are giving a bullish signal in the very short-term: the %K line is above the slow %D one and both are heading higher.
A strong U of M survey, especially as regards inflation expectations that may stoke market-implied odds for a fourth 25bps Fed hike in 2018, are likely to lift the pair. The zone around 112.88 and 113.34 includes the Kijun-sen, as well as the 50- and 100-period moving average lines, and may act as resistance to gains.
On the downside and in case of disappointing US figures, immediate support could come around the Tenkan-sen at 112.18; not far below lies yesterday’s low of 111.83. Lower still, support may take place around the 111 round figure; the region around this was congested in previous weeks.
Safe-haven flows (for example in the event the equity rout extends) or the lack thereof can also affect the pair.
EUR/USD Daily Outlook
Daily Pivots: (S1) 1.1543; (P) 1.1571; (R1) 1.1623; More.....
Intraday bias in EUR/USD remains mildly on the upside as rebound from 1.1431 is in progress, for 55 day EMA and above. But still, we'd expect upside to be limited by 1.1779/1814 resistance zone to bring down trend resumption eventually. On the downside, below 1.1534 minor support will turn bias back to the downside. Further break of 1.1431 will bring retest of 1.1300 low.
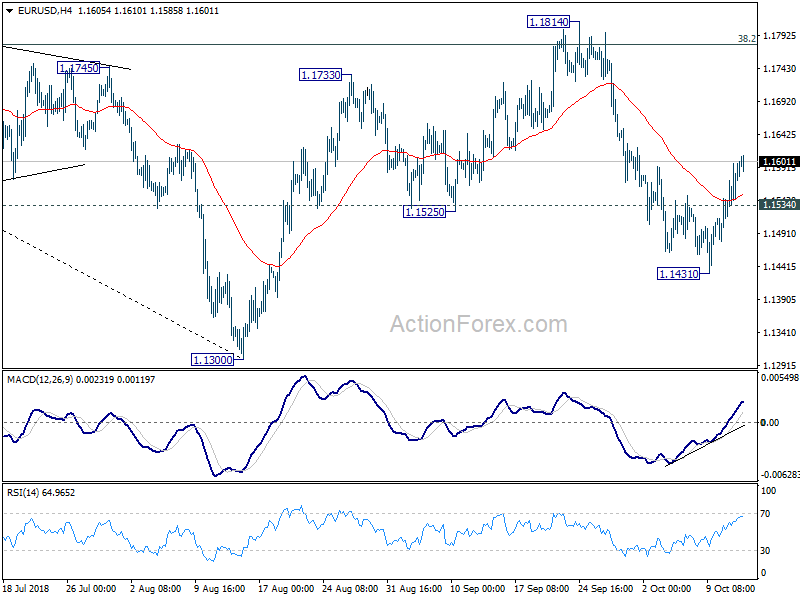
In the bigger picture, corrective pattern from 1.1300 could have completed at 1.1814 after hitting 38.2% retracement of 1.2555 to 1.1300 at 1.1779. Decisive break of 1.1300 will resume the down trend from 1.2555 to 61.8% retracement of 1.0339 (2017 low) to 1.2555 at 1.1186 next. Sustained break there will pave the way to retest 1.0339. On the upside, break of 1.1814 will delay the bearish case and extend the correction from 1.1300 with another rise before completion.
USDCAD Rally Eases Below Short-Term Downtrend Line
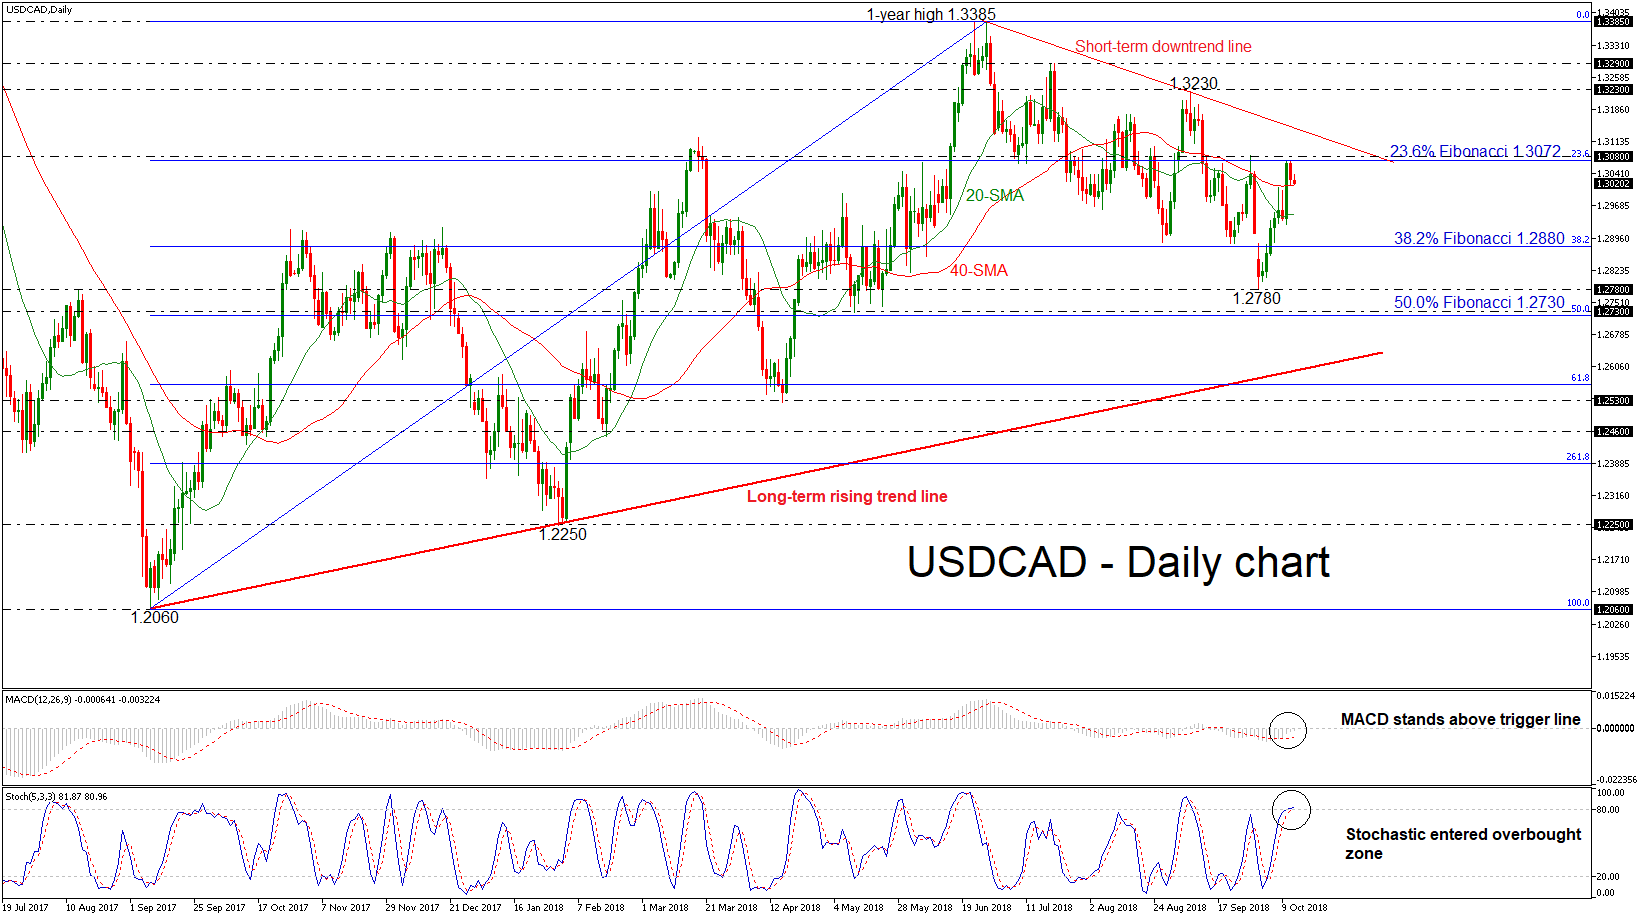
USDCAD has eased back down again after finding resistance at the 23.6% Fibonacci retracement level of the upleg from 1.2060 to 1.3385, around 1.3072. The price is paring some of the previous days strong gains and remains in a short-term bearish bias, despite that it stands above the 20- and 40-simple moving averages (SMAs) in the daily timeframe.
However, the technical indicators are suggesting for a possible upside movement as the MACD oscillator is trying to surpass the zero line and moves above the trigger line, while the stochastics holds in the overbought zone with weak momentum.
In case of an upward attempt above the 23.6% Fibonacci and the downtrend line, dollar/loonie would likely meet resistance at the 1.3230 barrier. A break above this line would send prices until the 1.3290 resistance level, achieved on July 19. Further gains would push the market until the one-year high of 1.3385.
On the other side, a drop below the SMAs, immediate support is being provided by the 38.2% Fibonacci mark of 1.2880, which is acting as major obstacle for the bears. If prices dip below of this area, the next support would likely come from the latest bottom of 1.2780 and then could hit the 50.0% Fibonacci around the 1.2730 barrier, taken from the low on May 11. A drop below the 50% Fibonacci level would signal the start of a deeper bearish phase, challenging the longer-term rising trend line again.
Regarding to the bigger picture, the bullish outlook remains intact as USDCAD stands above the ascending trend line, which has been holding since September 2017. The short-term negative movement would be erased if the price surpasses the downtrend line.