Sample Category Title
Asian Markets Rebound Despite Another US Selloff, IMF Downgrade
While the US markets tumbled for another day overnight, Asian markets showed their own resilience and turned positive after initial pressure. Nikkei closed up 0.46% at 22694.66. Japanese 10 year JGB yield is also above 0.15 at 0.151, up 0.0059. Singapore Strait Times is rising 0.72%. Hong Kong HSI is trading up 1.82%. China Shanghai SSE is up 0.86% at 2605.93 but cannot reclaims 2638 key support yet. Overnight, DOW lost -2.13% or 545.91 pts to 25052.83, barely held 25000 handle. S&P 500 lost -2.85% and NASDAQ dropped -1.25%. Treasury yields also tumbled with 10 year yield closed down -0.092 at 3.133.
In the currency markets, Canadian Dollar is the strongest one so far today, followed by Sterling and then Dollar. Yen is the weakest one again for today. But it's now followed by New Zealand and then Australian Dollar. For the week, however, Canadian Dollar is the weakest one followed by Dollar. New Zealand Dollar, yen and Australian Dollar are the stronger ones.
Technically, there is no clear sign that Dollar is bottoming, except possibly versus Yen. The greenback might need to seek help from stabilization in US stocks, if that happens today, to find its footing.
IMF downgrades 2019 Asia growth forecasts, including Australia, Hong Kong, Korea, Singapore, China, India
In the regional outlook report released today, IMF downgraded Asia growth forecasts in 2019 due to financial market stress and trade tensions. But it maintained that "near-term outlook for Asia remains positive, supported by steady global momentum and broadly accommodative policies". Also, "Asia continues to be the main growth engine of the world".
Overall Asian growth is projected to be at 5.6% in 2018 and 5.4% (downgraded by -0.2%) in 2019. For 2019, four of the seven advanced economies got growth projections downgraded, including Australia at 2.8% (-0.3%), Hong Kong 2.9% (-0.3%), Korea 2.6% (-0.3%), Singapore 2.5% (-0.2%). Taiwan got an upgrade to 2.4% (+0.4%), so did New Zealand at 3.0% (+0.1%). Japan's forecast was unchanged at 0.9%. Overall emerging Asian economies was downgraded to 6.3% (-0.3%) in 2019. China's growth was downgraded to 6.2% (-0.2%), India to 7.4% (-0.4%).
Additionally, IMF cited the following near-term downside risks to the forecasts:
- Escalating trade tensions
- Tighter global financial conditions
- Homegrown risks
And it urged the following policy actions:
- strengthen macro building blocks
- liberalize trade and investment
- strengthen productivity prospects
- seize the opportunities of, while addressing the spillovers from, the digital economy
US Treasury not to name China a currency manipulator, just keep it in monitoring list
There are media reports came out yesterday saying that US Treasury is not going to name China a currency manipulator in the upcoming report to be released later in the month. Though China will remain on a monitoring list due to the huge trade surplus with the US.
That could put Treasury Secretary Steven Mnuchin under even bigger pressure from Trump and the trade hawks in his administration. Mnuchin is clearly the one who preferred to and tried to line up restart of negotiation with China. But he has been receiving cold shoulders from his colleagues.
And Trump seemed to have gotten impatient with Mnuchin. If should be reminded that Trump didn't just complained Fed for rate hikes. In his words, he said earlier "The problem [causing the market drop] in my opinion is Treasury and the Fed. The Fed is going loco and there's no reason for them to do it. I'm not happy about it."
In a Bloomberg interview yesterday, Mnuchin declined to comment and only said "We are concerned about the depreciation" of the yuan, he said, "and want to make sure that it's not being used as a competitive devaluation.
China exports to US grew despite trade war, imports shrank for another month
China's trade surplus surprisingly widened in September, as trade surplus with US jumped to record high at USD 34.1B. As trade war started and escalated to another phase, exports to US continued to grow while imports from the US contracted for another month. For the year as a whole, China continued to have faster import growth with EU, than exports.
In USD terms, China's trade surplus widened to USD 31.7B in September, well above expectation of USD 19.4B. Exports rose 14.5% yoy to USD 226.7B. Import rose 14.3% yoy to 195.0B.
For the month of September
- Exports to EU rose 1.2% mom, 11.4% yoy to USD 37.4B. Imports from EU dropped -0.6% mom, rose 9.1% yoy to USD 24.7B. Trade surplus rose 9.9%, 37.7% yoy to USD 12.7B.
- Exports to US rose 5.2% mom, 14.0% yoy to USD 46.7B. Imports from US dropped -5.8% mom, -2.3% yoy to USD 12.6B. Trade surplus rose 9.9% mom, 21.5% yoy to USD 34.1B.
From January to September
- Exports to EU rose 11.4% yoy to USD 301.5B. Imports from EU rose 14.1% to USD 205.2B. Trade surplus rose 6.1% yoy to USD 96.3B.
- Exports to US rose 12.9% yoy to 348.8B. Imports from US rose 8.3% to USD 123.0B. Trade surplus rose 15.5% to USD 225.8B.
Elsewhere
New Zealand BusinessNZ manufacturing PMI dropped 0.3 to 51.7 in September. Australia home loans dropped -2.1% mom in August. Japan M3 rose 2.8% yoy in September. Tertiary industry index rose 0.5% mom in August. Eurozone industrial production, US import price and U of Michigan sentiment will be featured today.
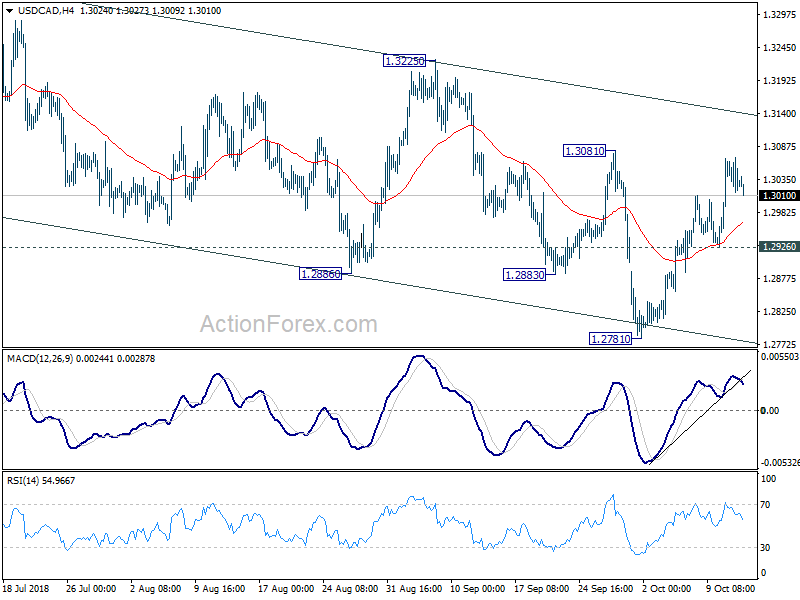
USD/CAD Daily Outlook
Daily Pivots: (S1) 1.3010; (P) 1.3041; (R1) 1.3068; More...
USD/CAD failed to break through 1.3081 resistance and retreats with 4 hour MACD crossed below signal line. Intraday bias is turned neutral again. On the upside, decisive break of 1.3081 will be the first sign of completion of whole choppy fall from 1.3385. In that case, near term outlook will be turned bullish for 1.3225 resistance for confirmation. On the downside, below 1.2886 minor support will turn bias to the downside for 1.2781 first.
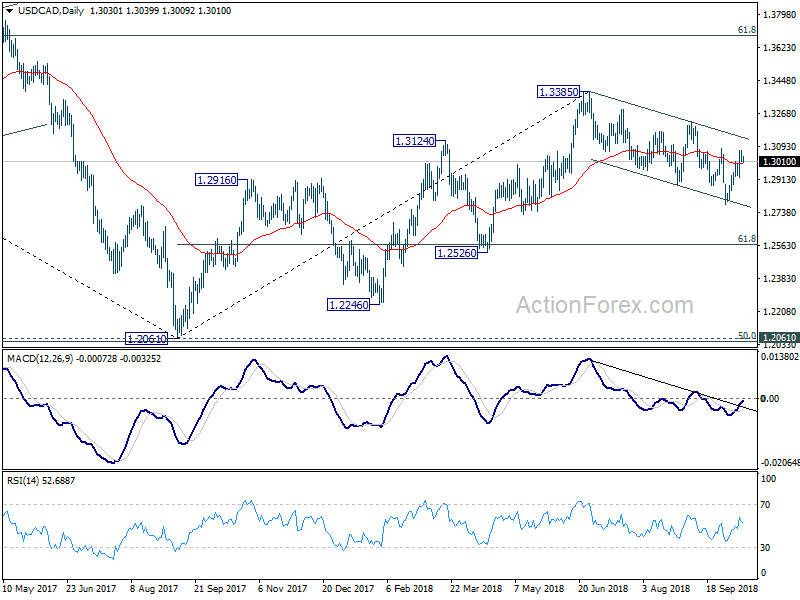
In the bigger picture, corrective rebound from 1.2061 could have completed at 1.3385 already. Deeper fall is mildly in favor to 61.8% retracement of 1.2061 to 1.3385 at 1.2567, which is close to 1.2526 support. For now, we're not seeing fall from 1.3385 as resuming larger down trend from 1.4689 (2015 high) yet. Thus, we'll look for bottoming signal again below 1.2567 . On the upside, though, break of 1.3081 resistance will argue that the pull back from 1.3385 is completed and rise from 1.2061 is resuming for another high above 1.3385.
Economic Indicators Update
| GMT | Ccy | Events | Actual | Forecast | Previous | Revised |
|---|---|---|---|---|---|---|
| 21:30 | NZD | BusinessNZ Manufacturing PMI Sep | 51.7 | 52 | ||
| 23:50 | JPY | Japan Money Stock M2+CD Y/Y Sep | 2.80% | 2.90% | 2.90% | |
| 0:30 | AUD | Home Loans M/M Aug | -2.10% | -0.90% | 0.40% | 0.00% |
| 2:54 | CNY | Trade Balance (USD) Sep | 31.7B | 19.4B | 27.9B | |
| 2:54 | CNY | Trade Balance (CNY) Sep | 213B | 192.3B | 179.8B | |
| 4:30 | JPY | Tertiary Industry Index M/M Aug | 0.50% | 0.30% | 0.10% | -0.10% |
| 6:00 | EUR | German CPI M/M Sep F | 0.40% | 0.40% | 0.40% | |
| 6:00 | EUR | German CPI Y/Y Sep F | 2.30% | 2.30% | 2.30% | |
| 9:00 | EUR | Eurozone Industrial Production M/M Aug | 0.40% | -0.80% | ||
| 12:30 | USD | Import Price Index M/M Sep | 0.30% | -0.60% | ||
| 14:00 | USD | U. of Mich. Sentiment Oct P | 100.9 | 100.1 |
China exports to US grew despite trade war, imports shrank for another month
China's trade surplus surprisingly widened in September, as trade surplus with US jumped to record high at USD 34.1B. As trade war started and escalated to another phase, exports to US continued to grow while imports from the US contracted for another month. For the year as a whole, China continued to have faster import growth with EU, than exports.
In USD terms, China's trade surplus widened to USD 31.7B in September, well above expectation of USD 19.4B. Exports rose 14.5% yoy to USD 226.7B. Import rose 14.3% yoy to 195.0B.
For the month of September
- Exports to EU rose 1.2% mom, 11.4% yoy to USD 37.4B. Imports from EU dropped -0.6% mom, rose 9.1% yoy to USD 24.7B. Trade surplus rose 9.9%, 37.7% yoy to USD 12.7B.
- Exports to US rose 5.2% mom, 14.0% yoy to USD 46.7B. Imports from US dropped -5.8% mom, -2.3% yoy to USD 12.6B. Trade surplus rose 9.9% mom, 21.5% yoy to USD 34.1B.
From January to September
- Exports to EU rose 11.4% yoy to USD 301.5B. Imports from EU rose 14.1% to USD 205.2B. Trade surplus rose 6.1% yoy to USD 96.3B.
- Exports to US rose 12.9% yoy to 348.8B. Imports from US rose 8.3% to USD 123.0B. Trade surplus rose 15.5% to USD 225.8B.
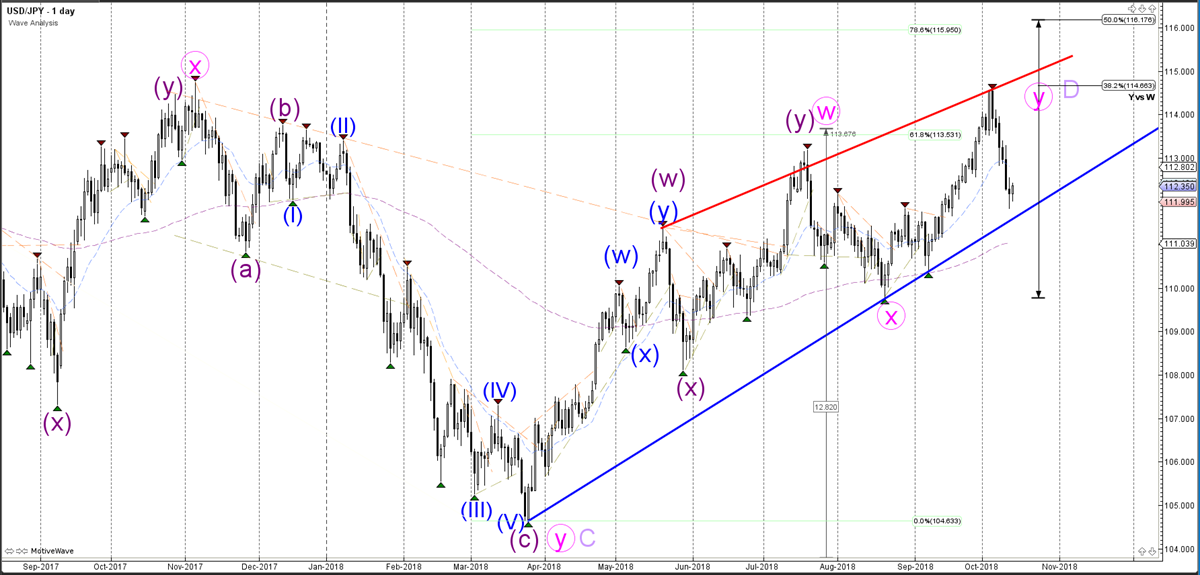
The USD/JPY Currency Pair Is Testing A Key Support Trend Line (Blue), Which Is A Key Bounce Or Break...
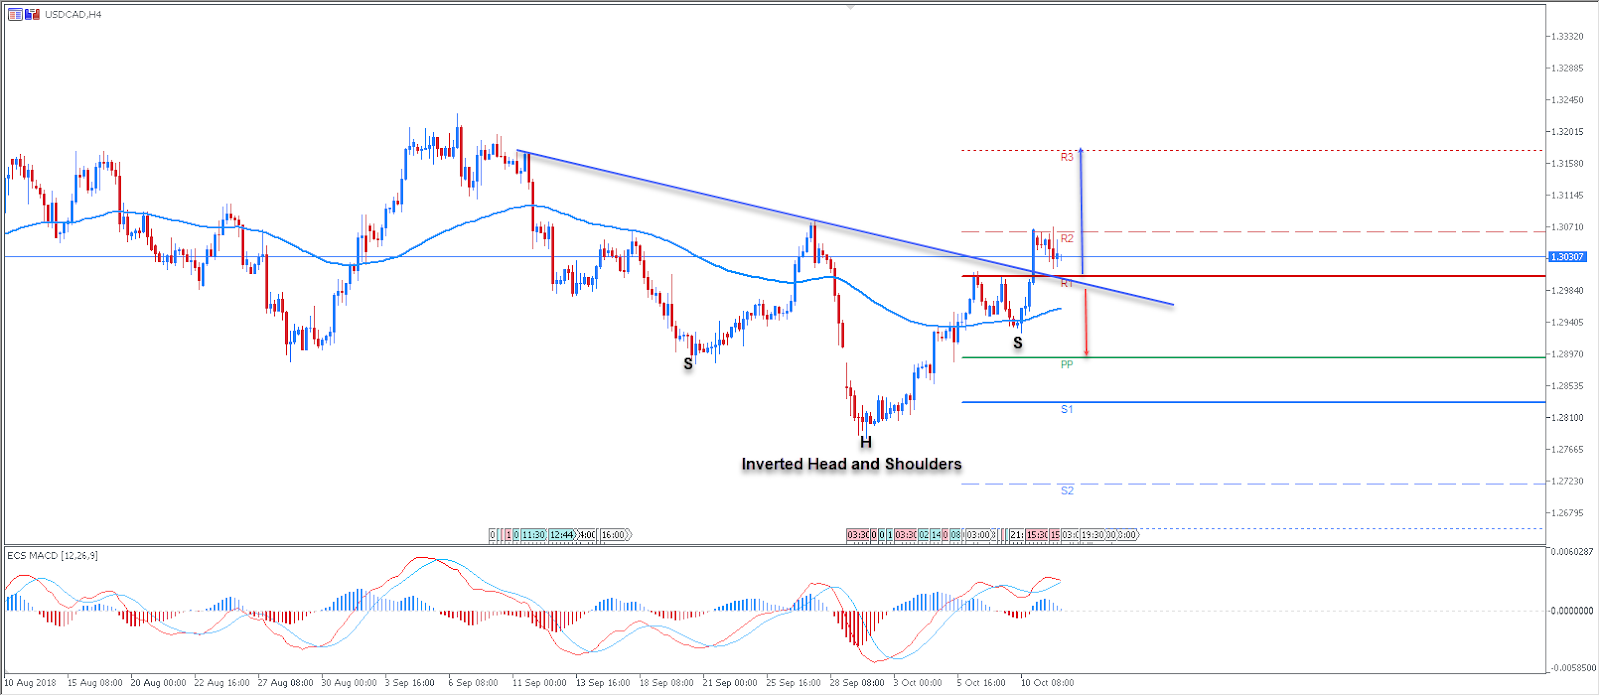
The USDCAD currency pair has formed an inverted head and shoulders pattern. The breakout occured at the R1 Resistance. The calendar will be light on the CAD data, but due to standard Friday profit taking, volatility could be present during the London/New York session. The main USD news for Friday is based on measuring the level of a composite index, based on surveyed consumers - Preliminary UoM (University of Michigan) Sentiment. Don't forget to follow our Forex calendar for all regular updates on the news,economic announcements, forecasts and much more.
Technically, the USD/CAD currency pair has opened room for further gains. Above the R1 and trend line confluence, we could also see the R2 break with a final target at R3 - 1.3175. However, as Friday is a profit taking day, we might also see a bearish price action. Bears might start to dominate below 1.2980. A sustained break below 1.2980 should target the Weekly Pivot Point (PP) at 1.2892.
Pivot Lines - Weekly Support and Resistance
POC - POC - Point Of Confluence (The zone where we expect the price to react - aka the entry zone)
USD/JPY Decision Zone At 61.8% Fibonacci Retracement Level
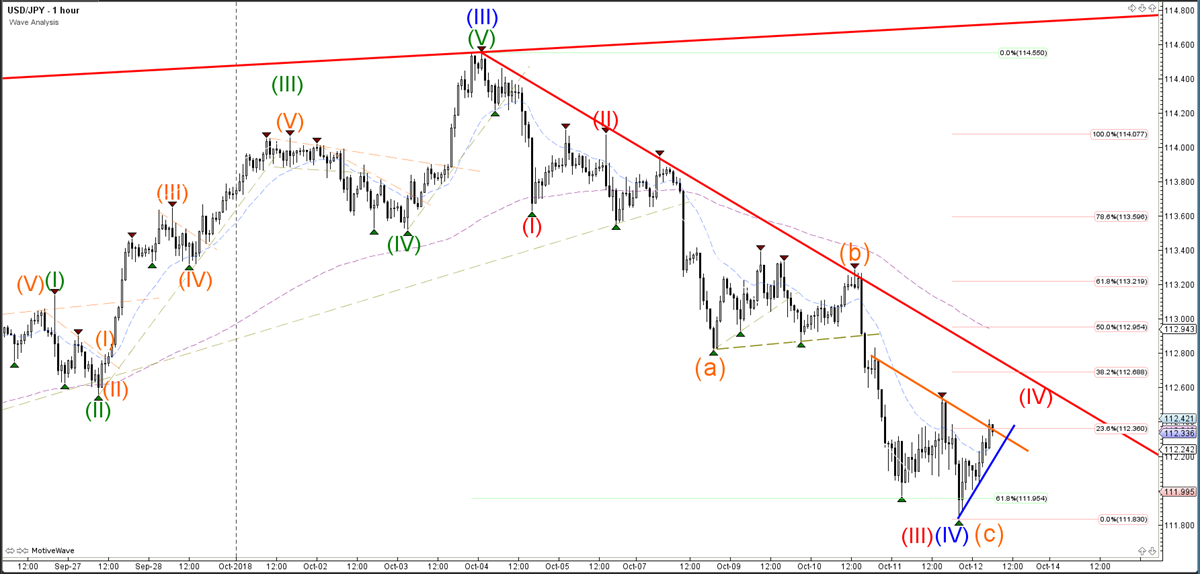
The USD/JPY currency pair made a bullish bounce at the 61.8% Fibonacci retracement level. A bullish break above the resistance trend line (red) could indicate the end of a wave 4 (blue) pattern, and the start of the wave 5 (blue). A bearish break indicates a new wave pattern indicated by the 5 bearish waves (red).
The USD/JPY currency pair has either completed a bearish ABC (orange), or is building a 5 wave (red) pattern, which will depend on the candlestick patterns that emerge at the support and resistance trend lines.
The USD/JPY currency pair is testing a key support trend line (blue), which is a key bounce or break zone.
SPX Another Selling Can Enter Index Into Buying Area?
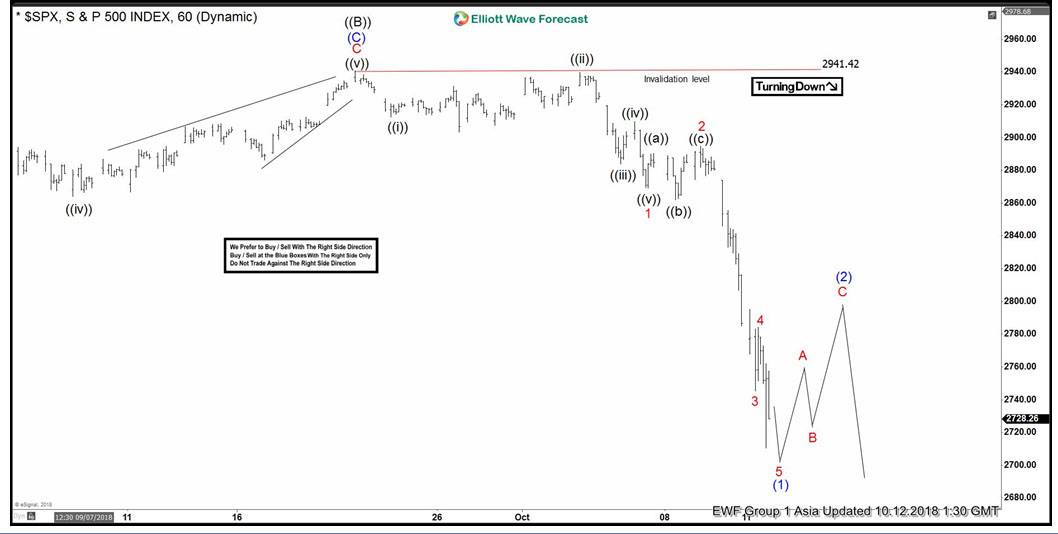
SPX short-term Elliott wave view suggests that a rally to $2941.42 high ended primary wave ((2)) bounce. Down from there, primary wave ((C)) remain in progress as impulse structure. Where initial decline to $2912.63 low ended Minute wave ((i)). A bounce to $2939.86 high ended Minute wave ((ii)). A decline to $2883.92 low ended Minute wave ((iii)), Minute wave ((iv)) ended at $2909.64.
Minute wave ((v)) ended at $2869.29 low, which also completed Minor Minor wave 1. Up from there a bounce to $2894.83 high ended Minor wave 2 as a Flat structure. Where lesser degree Minute wave ((a)) ended at $2890.42, Minute wave ((b)) ended at $2862.08 and Minute wave ((c)) ended at $2894.83. Down from there, Minor wave 3 ended in lesser degree 5 waves at $2745.46. A bounce to $2784.11 high ended Minor wave 4 recovery.
Currently, Minor wave 5 remain in progress looking to extend lower 1 more push towards $2711.82-$2667.16 100%-161.8% Fibonacci extension area of a Minor 5=1 target area to end intermediate wave (1) in 5 waves. Afterwards, the index is expected to do a bounce in intermediate wave (2) to correct the cycle from $2941.42 high in 3, 7 or 11 swings before turning lower 1 more time entering into another possible long side at $2584.87-$2363.19 area approximately. We don’t like selling it.
SPX 1 Hour Elliott Wave Chart
Euro Trading On A Stronger Footing In The Asian Session
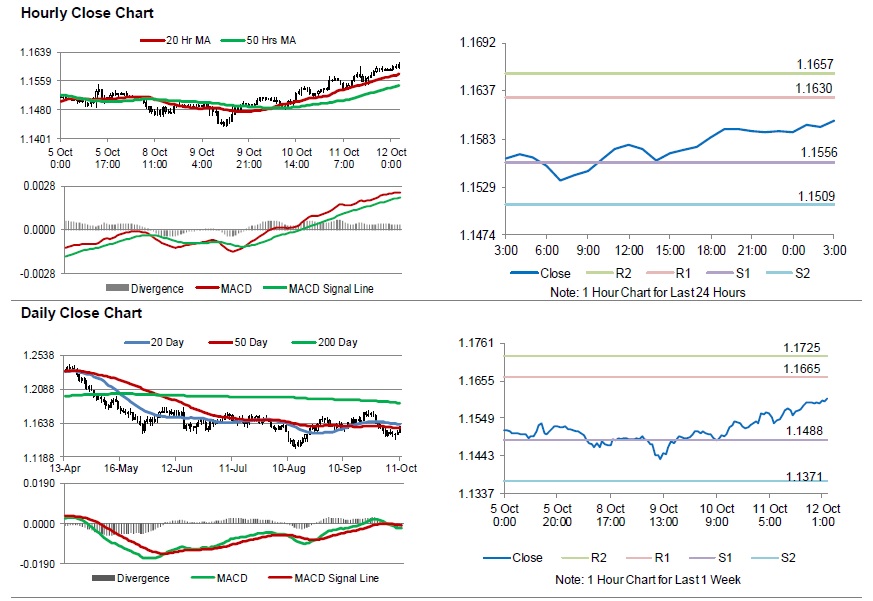
For the 24 hours to 23:00 GMT, the EUR rose 0.49% against the USD and closed at 1.1592.
In the US, data revealed that the US consumer price index (CPI) advanced 2.3% on an annual basis in September, following a gain of 2.7% in the previous month. Market participants had anticipated the CPI to rise to 2.4%. On the contrary, the nation’s seasonally adjusted initial jobless claims unexpectedly climbed to a level of 214.0K in the week ended 06 October 2018, compared to market consensus for a steady reading. In the prior week, initial jobless claims had recorded a reading of 207.0K.
In the Asian session, at GMT0300, the pair is trading at 1.1604, with the EUR trading 0.10% higher against the USD from yesterday’s close.
The pair is expected to find support at 1.1556, and a fall through could take it to the next support level of 1.1509. The pair is expected to find its first resistance at 1.1630, and a rise through could take it to the next resistance level of 1.1657.
Trading trend in the Euro today is expected to be determined by the Euro-zone’s industrial production for August as well as Germany’s consumer price index for September, set to release in a few hours. Later in the day, the US Michigan consumer sentiment index for October will garner significant amount of investors’ attention.
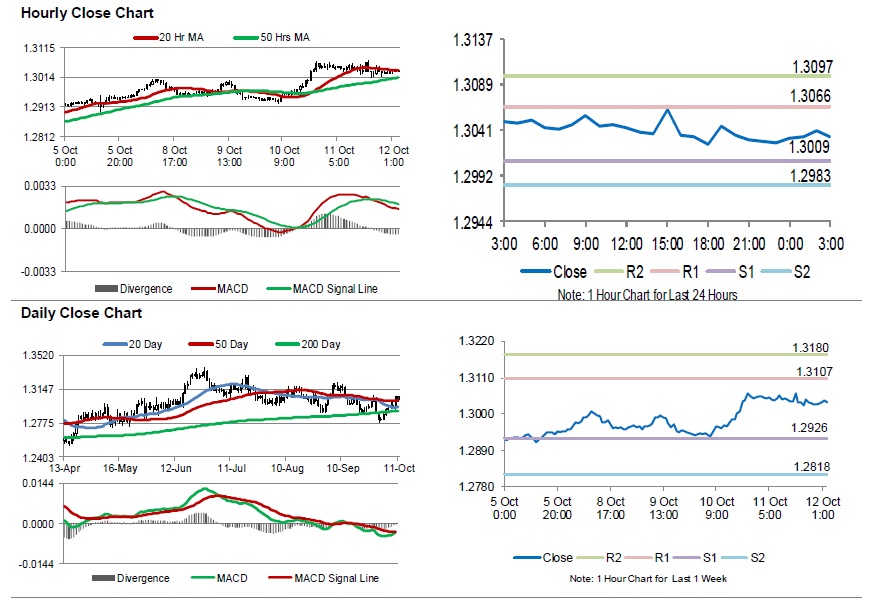
The currency pair is trading above its 20 Hr and 50 Hr moving averages.
Pound Extends Its Gains In The Morning Session
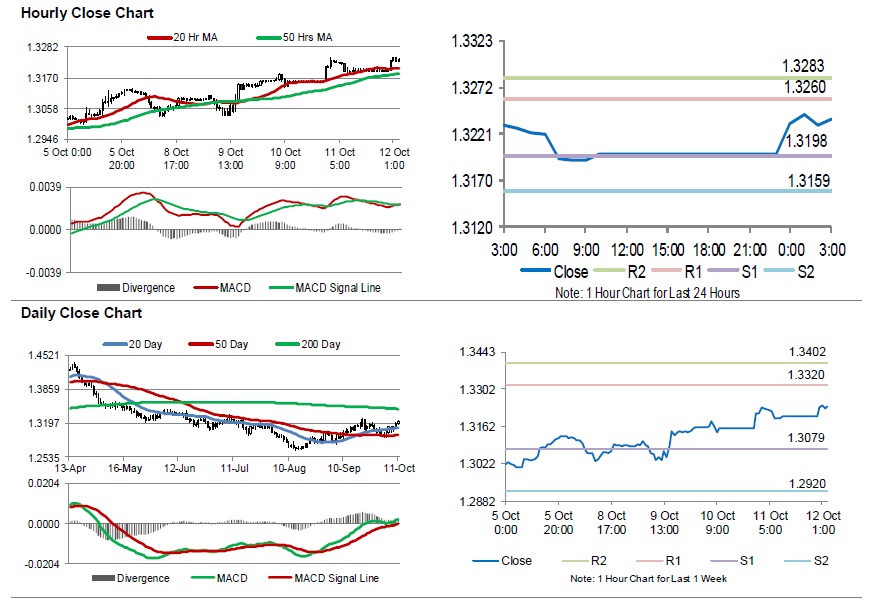
For the 24 hours to 23:00 GMT, the GBP rose 0.34% against the USD and closed at 1.3199.
In the Asian session, at GMT0300, the pair is trading at 1.3237, with the GBP trading 0.29% higher against the USD from yesterday’s close.
The pair is expected to find support at 1.3198, and a fall through could take it to the next support level of 1.3159. The pair is expected to find its first resistance at 1.3260, and a rise through could take it to the next resistance level of 1.3283.
With no macroeconomic releases in Britain today, investor sentiment would be governed by global macroeconomic events.
The currency pair is trading above its 20 Hr and 50 Hr moving averages.
Japanese Yen Reverses Its Gains In The Morning Session
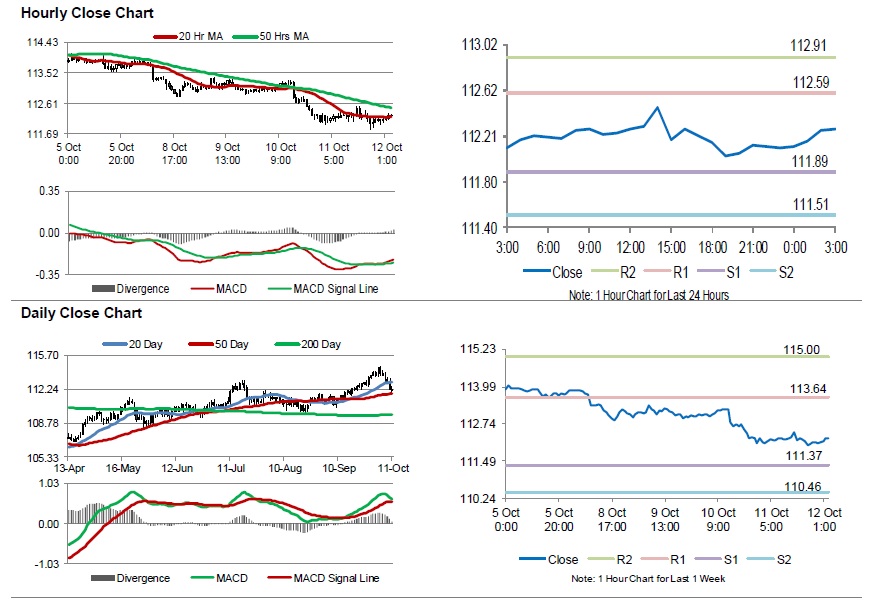
For the 24 hours to 23:00 GMT, the USD declined 0.14% against the JPY and closed at 112.10.
In the Asian session, at GMT0300, the pair is trading at 112.27, with the USD trading 0.15% higher against the JPY from yesterday’s close.
The pair is expected to find support at 111.89, and a fall through could take it to the next support level of 111.51. The pair is expected to find its first resistance at 112.59, and a rise through could take it to the next resistance level of 112.91.
Looking forward, traders would keep an eye on Japan’s consumer price index, industrial production and trade balance data, set to release next week.
The currency pair is showing convergence with its 20 Hr moving average and trading below its 50 Hr moving average.
Swiss Franc Trading Slightly Higher This Morning
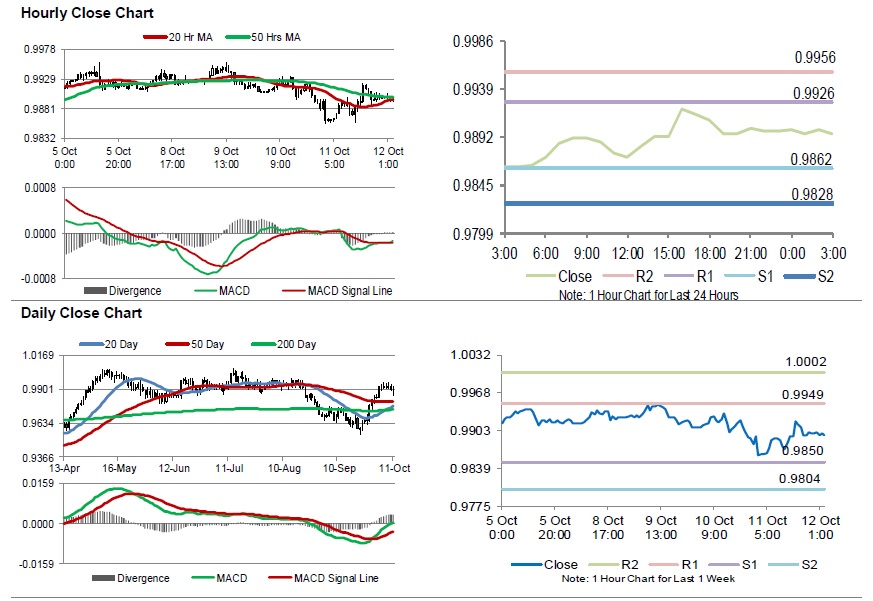
For the 24 hours to 23:00 GMT, the USD rose 0.08% against the CHF and closed at 0.9898.
In the Asian session, at GMT0300, the pair is trading at 0.9896, with the USD trading a tad lower against the CHF from yesterday’s close.
The pair is expected to find support at 0.9862, and a fall through could take it to the next support level of 0.9828. The pair is expected to find its first resistance at 0.9926, and a rise through could take it to the next resistance level of 0.9956.
The currency pair is showing convergence with its 20 Hr and 50 Hr moving averages.
Canada’s New Housing Price Index Advanced Less-Than-Expected In August
For the 24 hours to 23:00 GMT, the AUD rose 0.81% against the USD and closed at 0.7124.
LME Copper prices declined 2.2% or $139.0/MT to $6155.0/MT. Aluminium prices declined 0.3% or $5.0/MT to $2024.0/MT.
Overnight data showed that Australia's seasonally adjusted home loan approvals eased 2.1% on a monthly basis in August, more-than-anticipated and compared to an advance of 0.4% in the previous month.
Elsewhere, in China, Australia's largest trading partner, trade surplus widened to $31.69 billion in September, more than market expectations and compared to a surplus of $27.89 billion in the previous month.
In the Asian session, at GMT0300, the pair is trading at 0.7121, with the AUD trading slightly lower against the USD from yesterday's close.
The pair is expected to find support at 0.7082, and a fall through could take it to the next support level of 0.7042. The pair is expected to find its first resistance at 0.7146, and a rise through could take it to the next resistance level of 0.7170.
The currency pair is trading above its 20 Hr and 50 Hr moving averages