Sample Category Title
Investors Take A Breather As The Equity And The FX Markets Stabilise
Policy to Weaken JPY continues
USDJPY spent the summer recoupling with interest rates. The JPY weakness helped the Nikkei rise nearly 2000 point in September. Yet, recent risk-sell which strengthened JPY, has eliminated most of the early gains. Outside of market volatility, there are real sign that the effect of “Abenomics” are fading and real economy is slowing. Since the BoJ Tankan surveys released in September there has been clear decelerations in key areas. Current business conditions index for large manufacturers has fallen by 2 points while industrial production remained weak. Perhaps the lone bright spot for Japan and the global economy is exports orders embed in manufacturing PMI, which increased 1.2 to 50.9. While just marginally above expansion territory Nikkei bulls will take it. Inflations remains weak limiting the impact of the current uptick. The BoJ’s prefer measure of core-core inflations indicted that prices in Tokyo increased by 0.7% in September. The result of higher prices across the board was likely the effect of higher energy prices rather than growth driven.
Markets have been speculating that Japanese policy makers might changes the economic policy mix. Specifically ending the current accommodating monetary policy stance and by default trigger the start of normalization. However, the negative direction of growth and positive movement of inflation suggest that nothing meaningfully will be adjusted. Prime Minster Shinzo Able landslide victory on 20th September suggests that Abenomics will be maintained for the remaindered of this tenure. Overall, despite marginal momentum in inflation trend the BoJ remains a distance from its 2% inflation target. Market should not expected and material changes form yields curves control policy with newly adopted forward guidance. With policy a core reason for JPY weakness the renewed support for Abenomics should create momentum for further JPY weakness (recoupling with historically dominate US-JP interest rate spread). That said geopolitical uncertainty, and fears of US protectionism and higher interest rates could easily trigger renewed safe haven seeking and stronger JPY. USDJPY was able to stage a recovery bounce off 50 d MA at 111.85 potentially target 113.39 range resistance.
Chinese exports defy US tariffs
China’s trade surplus with the US continues to reach record highs, at USD 34 billion in September from August’s USD 31 billion. It’s probably unsustainable, as the Trump Administration’s tariffs on USD 200 billion of Chinese goods went live on 24 September. The planned Trump-Xi meeting on 30 November/1 December 2018 will be tense, if it even takes place. Globally, Chinese exports rose 14.5% (prior: 9.10%), largely above expectations of 9.80% while imports at 14.30% remain lower for the second consecutive month (prior: 19.90%), thanks to competitive advantage of a weaker renminbi.
10% tariffs could be increased to 25% by year-end, if no progress in US-China trade is made. This could hammer China and its manufacturing sector. US consumers are robust spenders, but the 10-25 hike would weigh heavily on Chinese exporters. China’s economy appears resilient, although worries related to growth remain. The central bank’s challenge is to balance liquidity and credit to support the economy and safeguard against a credit collapse, which would bring on a recession.
Global Stocks Bounce Back, Gold Shines Through Chaos
The brutal selloff that engulfed global stocks this week took a pause on Friday as risk sentiment slightly improved across financial markets.
Most Asian shares recovered during early trade despite Wall Street suffering heavy losses overnight. In Europe, stocks continue to march higher on positive global cues which could support Wall Street later in the afternoon. Although positive trade data from China and reports of U.S. President Donald Trump meeting Chinese President Xi Jinping at the G20 summit next month has rekindled risk appetite, stock markets are not out of the woods yet.
Concerns revolving around escalating trade tensions, prospects of rising interest rates and global growth concerns remain a drag on global equity markets. With caution likely to heighten ahead of the earning’s seasons, the current stock market rebound could prove to be a mere dead-cat bounce.
Dollar Index wobbles above 95.00
It is thought-provoking how the Dollar has weakened to a monthly low against its major peers despite trade disputes and global growth fears promoting risk aversion.
President Trump’s repeated criticism of the Federal Reserve coupled with soft U.S. inflation data remain key drivers behind the Dollar’s depreciation. Although the Greenback still maintains its status as a safe-haven currency in times of uncertainty, further losses could be experienced in the short term. The potential downside is based on a technical breakdown below the 95.00 support level on the daily timeframe. A solid weekly close under this level has the potential to instill bears with enough confidence to attack 94.60 and 94.35, respectively.
Commodity spotlight – Gold
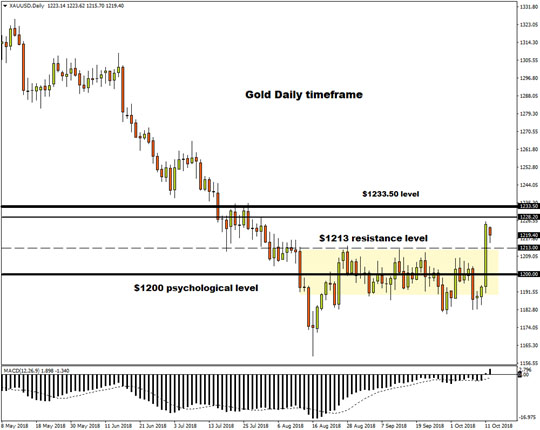
Gold bulls were unstoppable on Thursday as global risk aversion sent investors sprinting to safe-haven assets. A depreciating Dollar boosted appetite for the yellow metal with prices powering to a 10-week high above $1,225.
Although gold prices are noticeably weaker this morning, bulls remain in the driving seat above the $1,213 level. While the technical outlook points to further upside, fundamentals are still in the bear’s favour. With the Dollar supported by safe-haven flows and prospects of higher U.S. interest, the medium- to longer-term outlook remains negative for Gold.
Focusing purely on the technical picture, Gold prices turned bullish on the daily charts following abreakout above the $1,213 resistance level. Investors may utilize $1,213 as a fresh support to push prices towards $1228.20 and $1233.50. If prices unable to keep above the $1,213, Gold has scope to depreciate back towards the $1,200 psychological level.
Sugar 11 Outlook: Bulls Pressure Falling Weekly Cloud As Positive Fundamentals Continue To Underpin
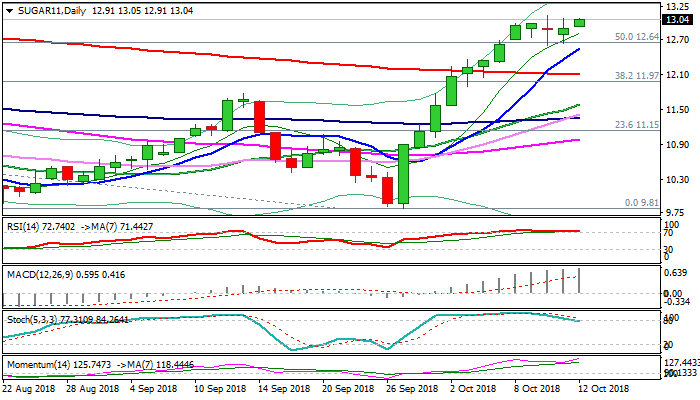
Sugar price probes again above psychological $13.00 barrier on Friday (following short-lived spike to $13.11 on 10Oct) signaling continuation of strong three-week uptrend. Fresh strength emerges after consolidation in past two days and pressures key barriers at $13.09/38 (base of falling weekly cloud/Fibo 61.8% of $15.47/$9.81), violation of which would generate strong bullish signal. Bullish techs support the action, but fundaments are likely the main driver of sugar price. News that global sugar market could turn to deficit as Brazil and the EU cut production, affected by very low prices (sugar hit the lowest since mid-2007) could spark further rise of sugar price. The price was up over 20% in past three weeks on acceleration from 27 Sep low at $9.81 and shows no signs of fatigue for now. Firm break above $13.09/31 pivots) and lift above weekly cloud top ($13.62) would open way towards $14.13 (Fibo 76.4% of $15.47/$9.81 descend) and $14.52 (falling weekly 100SMA). Two-day consolidation lows at $12.60 mark initial support (reinforced by rising 10SMA), guarding pivotal support at $12.09 (broken 200SMA).
Res: 13.09, 13.31, 13.62, 14.13
Sup: 12.91, 12.60, 12.34, 12.09
The Analytical Overview Of The Main Currency Pairs
The EUR/USD currency pair
Technical indicators of the currency pair:
Prev Open: 1.15188
Open: 1.15862
% chg. over the last day: +0.61
Day's range: 1.15796 – 1.16104
52 wk range: 1.0571 – 1.2557
Yesterday, the US dollar continued to lose ground relative to the major currencies. The EUR/USD quotes growth exceeded 80 points. The US currency was under pressure due to weak data on US inflation and criticism of Fed policy by Donald Trump. At the moment, local support and resistance levels are: 1.15700 and 1.16100, respectively. Trading instrument has the potential for further growth. We recommend opening positions from the key levels.
Today, the news feed on the Eurozone economy is calm.
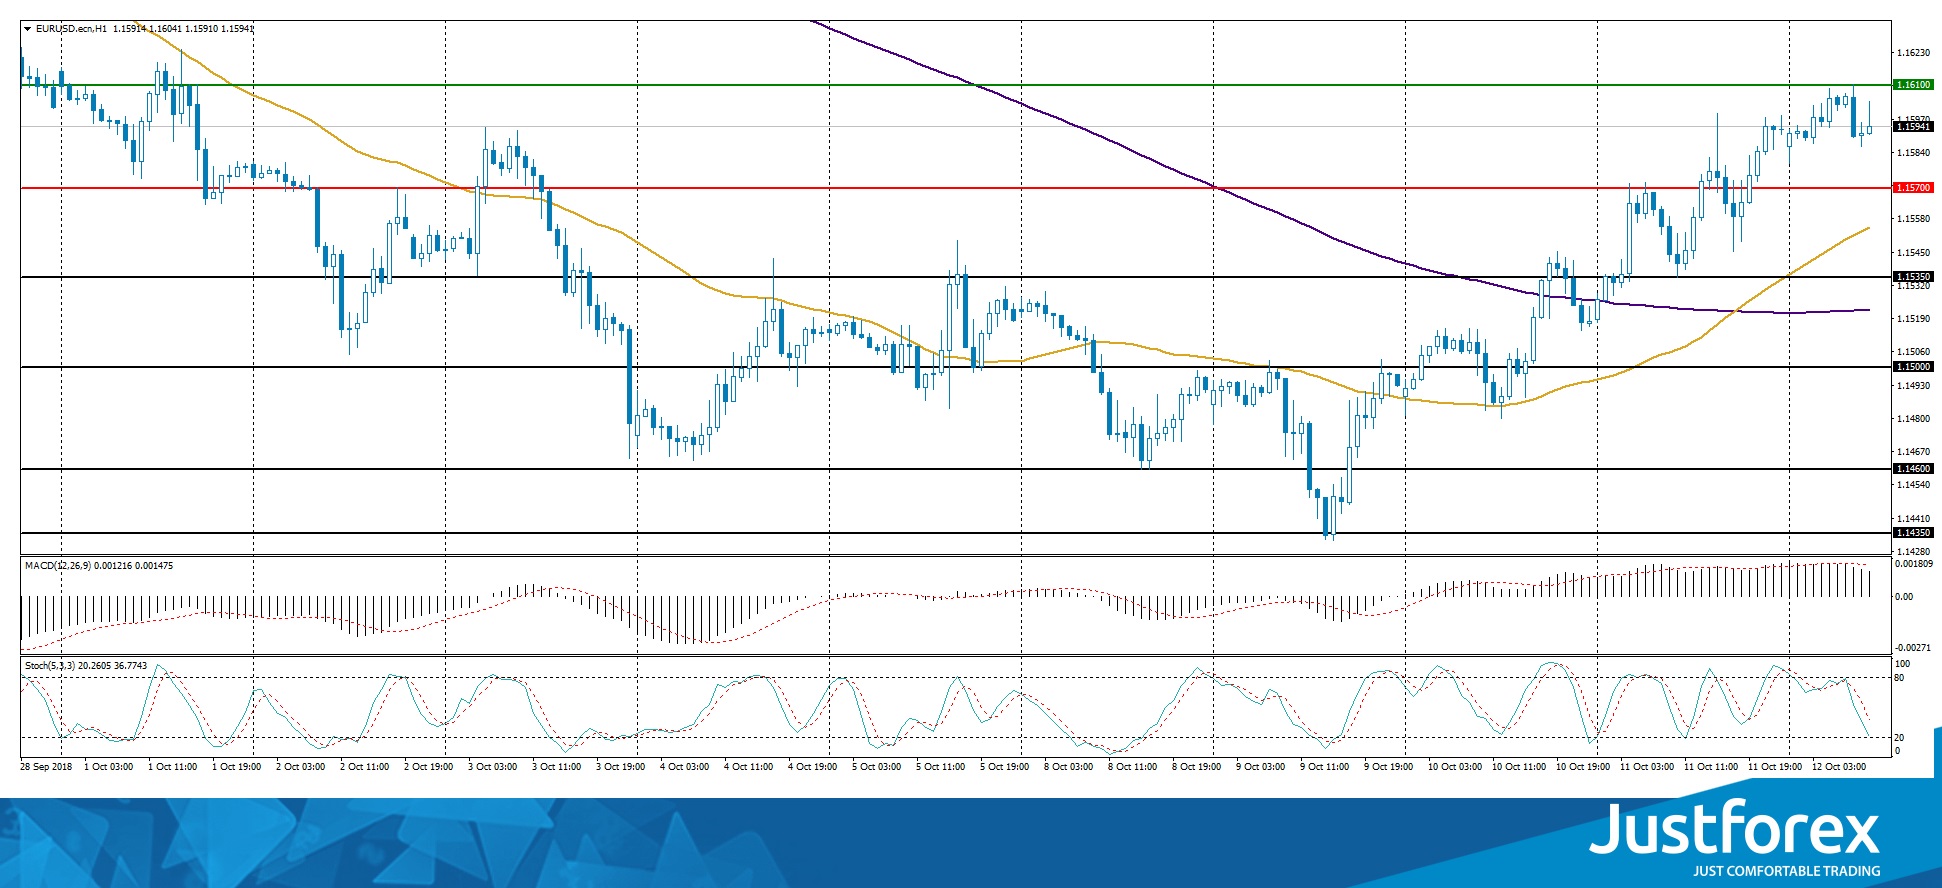
The price has fixed above 50 MA and 200 MA, which indicates the power of buyers.
The MACD histogram is in the positive zone, but below the signal line, which gives a weak signal to buy EUR/USD.
Stochastic Oscillator is in the neutral zone, the %K line is below the %D line, which indicates the bearish sentiment.
Trading recommendations
Support levels: 1.15700, 1.15350, 1.15000
Resistance levels: 1.16100, 1.16500
If the price fixes above the resistance level of 1.16100, a further growth of the EUR/USD quotes is expected. The movement is tending to 1.16500-1.16750.
An alternative may be the decrease of the EUR/USD currency pair to the level of 1.15350-1.15000.
The GBP/USD currency pair
Technical indicators of the currency pair:
Prev Open: 1.31880
Open: 1.32190
% chg. over the last day: +0.29
Day's range: 1.32184 – 1.32579
52 wk range: 1.2361 – 1.4345
The technical pattern on the GBP/USD currency pair is ambiguous. Quotes are in a sideways trend. Unidirectional trend is not observed. The trading instrument is testing the key support and resistance levels: 1.31800 and 1.32500, respectively. Investors expect new information regarding the Brexit process. Positions should be opened from the key levels.
Today, the publication of important statistics from the UK is not planned.
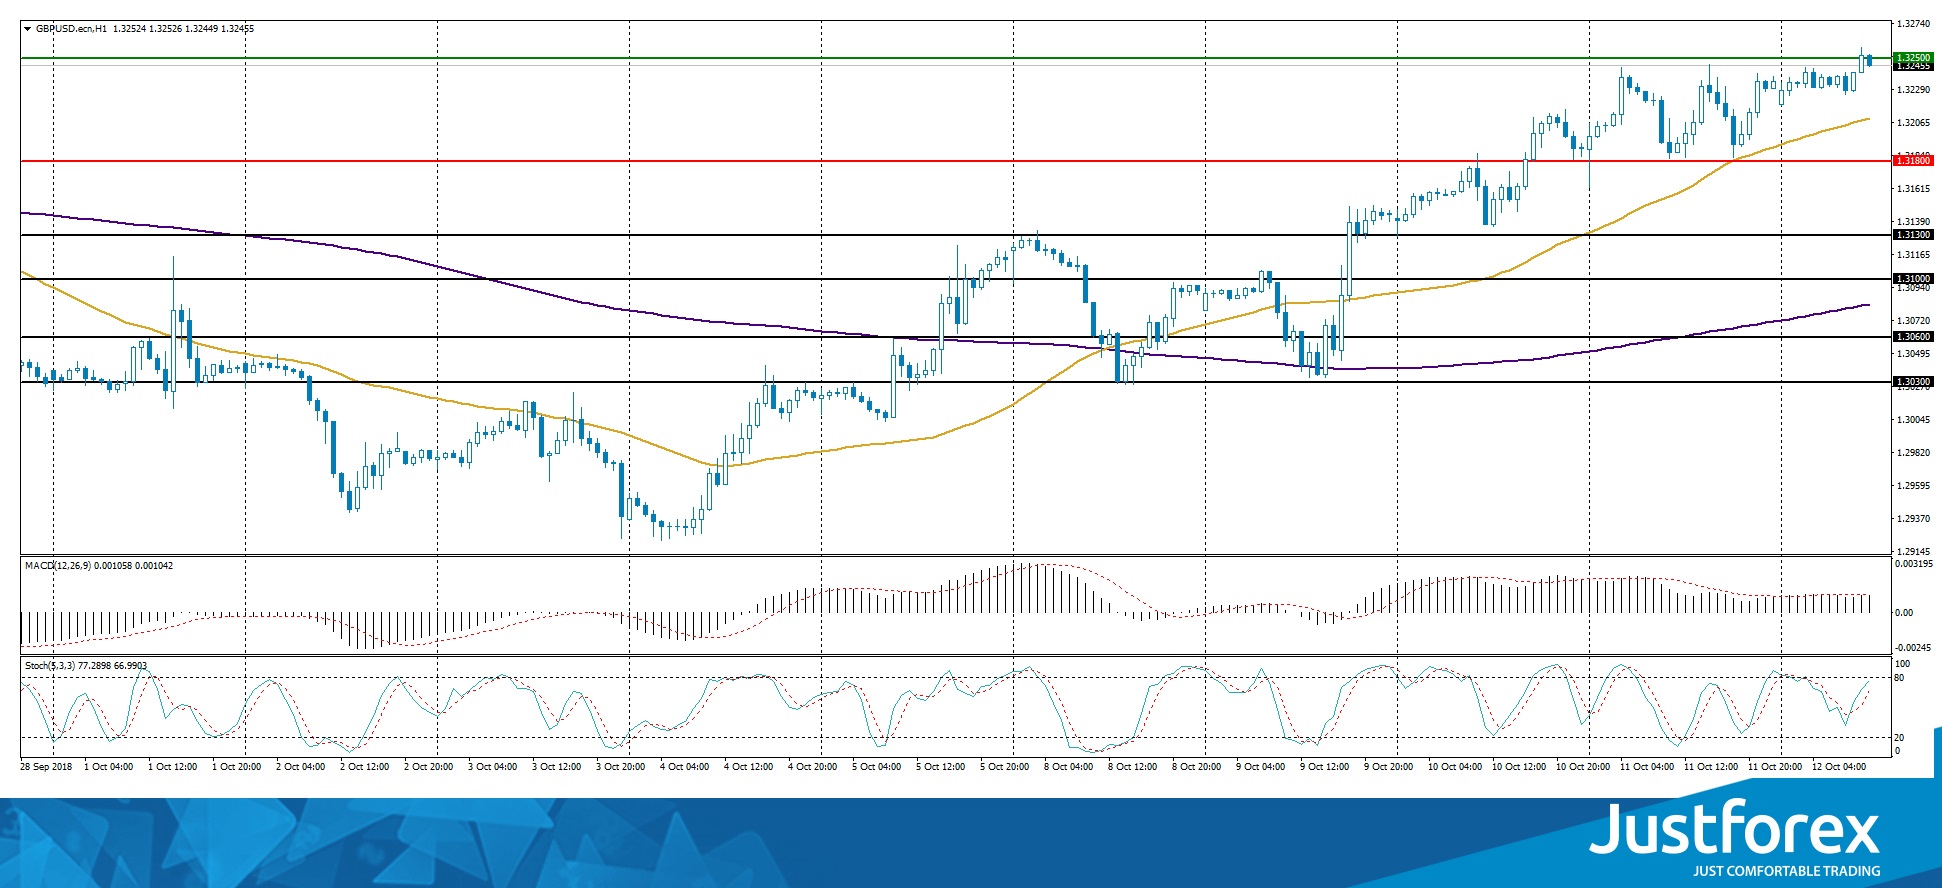
The price has fixed above 50 MA and 200 MA, which indicates the power of buyers.
The MACD histogram is in the positive zone, but below the signal line, which gives a weak signal to buy GBP/USD.
Stochastic Oscillator is in the neutral zone, the %K line is above the %D line, which indicates the bullish sentiment.
Trading recommendations
Support levels: 1.31800, 1.31300, 1.31000
Resistance levels: 1.32500, 1.33000
If the price fixes above the resistance level of 1.32500, further growth of the GBP/USD quotes is expected. The movement is tending to the round level of 1.33000.
An alternative may be the decrease of the GBP/USD currency pair to the level of 1.31800-1.31600.
The USD/CAD currency pair
Technical indicators of the currency pair:
Prev Open: 1.30601
Open: 1.30299
% chg. over the last day: -0.28
Day's range: 1.30025 – 1.30401
52 wk range: 1.2059 – 1.3795
The USD/CAD currency pair moved away from two-month highs. At the moment, quotes are consolidating. The technical pattern is ambiguous. Local support and resistance levels are: 1.30000 and 1.30400, respectively. In the near future, the correction of the USD/CAD currency pair is not excluded. Positions should be opened from the key levels.
The news feed on the economy of Canada is calm.

Indicators do not send accurate signals: the price has crossed 50 MA.
The MACD histogram is near the 0 mark.
The Stochastic Oscillator is located near the oversold zone, the %K line has crossed the %D line. There are no signals at the moment.
Trading recommendations
Support levels: 1.30000, 1.29500, 1.29150
Resistance levels: 1.30400, 1.30650, 1.31000
If the price fixes above the local resistance of 1.30400, further growth of the USD/CAD quotes is expected. The movement is tending to 1.30900-1.31250.
Alternative option. If the price fixes below the round level of 1.30000, it is necessary to look for entry points to the market to open short positions. The target movement level is 1.29600-1.29400.
The USD/JPY currency pair
Technical indicators of the currency pair:
Prev Open: 112.251
Open: 112.114
% chg. over the last day: -0.17
Day's range: 112.002 – 112.497
52 wk range: 104.56 – 114.74
The USD/JPY currency pair is being traded in a flat. The technical pattern is ambiguous. The USD/JPY quotes are testing the key support and resistance levels: 112.500 and 113.000, respectively. Positions should be opened from these marks. Trading instrument has the potential for further decline. We recommend paying attention to the US government bonds yield.
Publication of important economic reports from Japan is not planned.
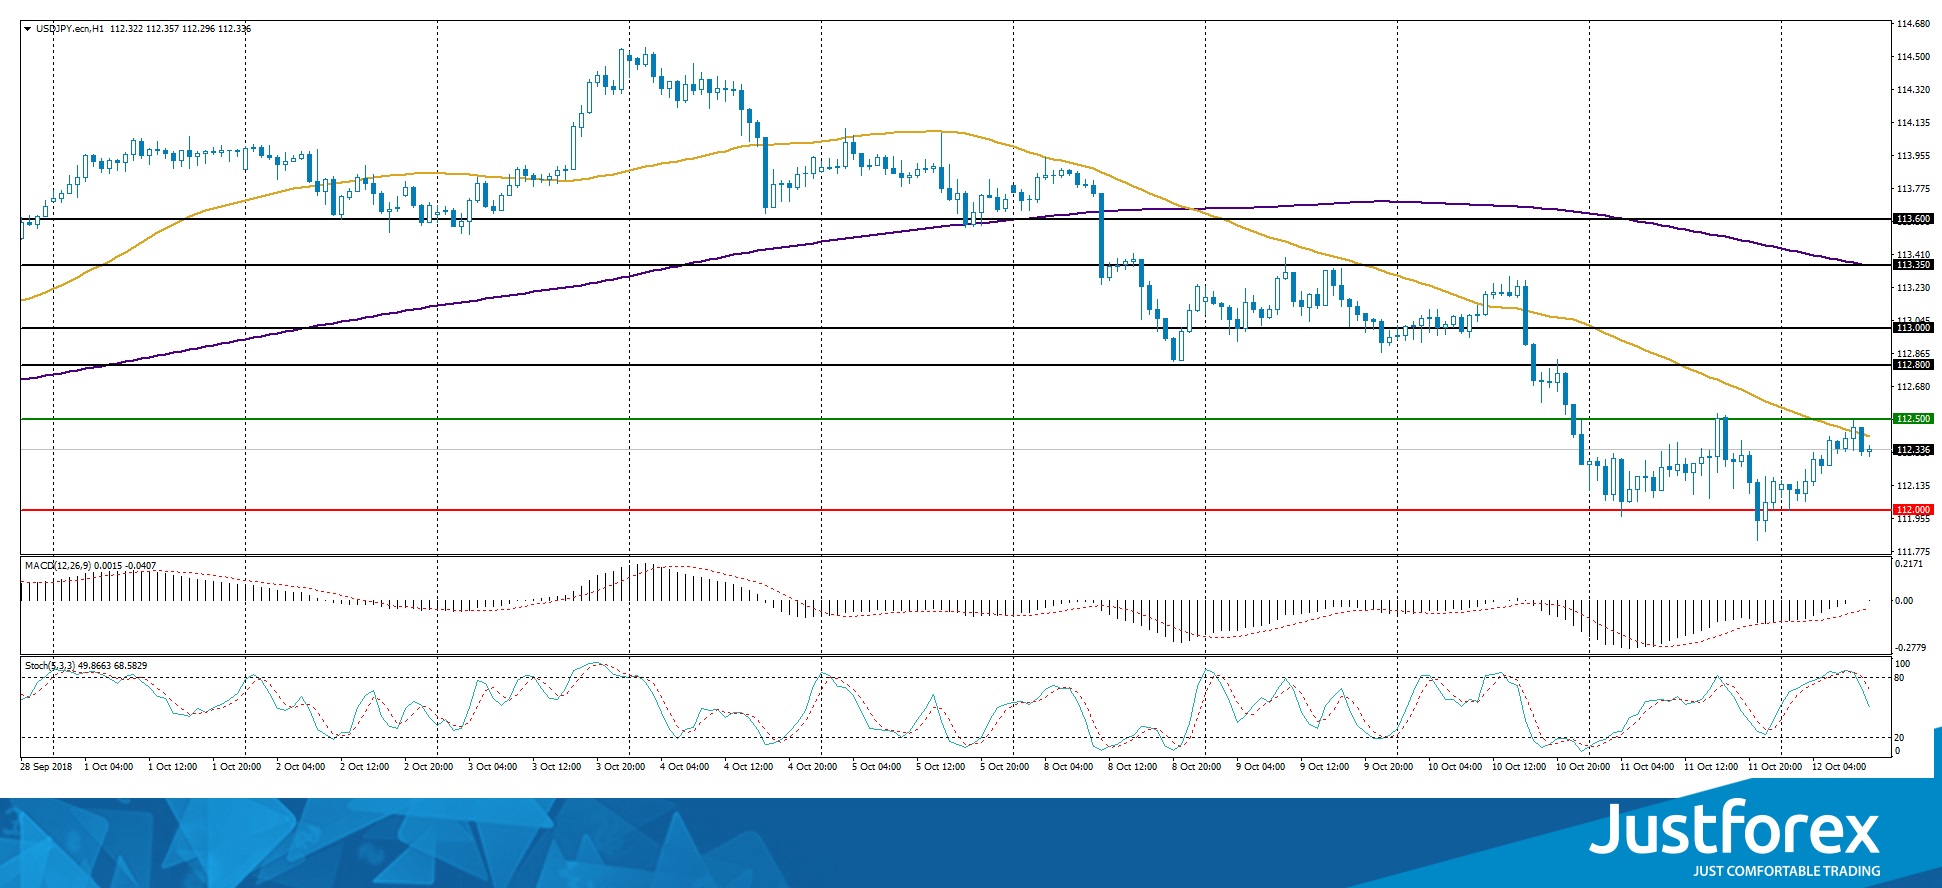
Indicators do not send accurate signals: the price is testing 50 MA
The MACD histogram is located near the 0 mark.
Stochastic Oscillator is in the neutral zone, the %K line is below the %D line, which indicates the bearish sentiment.
Trading recommendations
Support levels: 112.000, 111.500
Resistance levels: 112.500, 113.000, 113.350
If the price fixes below the round level of 112.000, a further fall in the USD/JPY quotes is expected. The movement is tending to 111.600-111.400.
Alternative option. If the price fixes above 112.500, we recommend looking for entry points to the market to open long positions. The target movement level is 112.800-113.250.
The Dollar Index Has Updated Local Lows
During yesterday's trading session, the US dollar continued to lose ground relative to currency majors. The dollar index (#DX) closed the trading session in the negative zone (-0.49%). The American currency was under pressure due to aggressive sales in the stock market and weak data on US inflation. In September, core consumer price index counted to 0.1% (m/m), which is below market expectations of 0.2% (m/m).
Donald Trump criticized the Fed policy once again. The US President called the Central Bank officials "crazy" because they plan to follow the interest rate raising. The President of the Federal Reserve Bank of St. Louis, James Bullard, believes that interest rates have reached the optimal value. The ECB protocol indicated that the regulator planned to adhere to the current rate of monetary policy. Investors expect new information regarding the Brexit process.
Oil quotes show positive dynamics. At the moment, futures for the WTI crude oil are testing a mark of $71.80 per barrel.
Market Indicators
Major US stock indices continue to show negative dynamics: #SPY (-2.20%), #DIA (-2.26%), #QQQ (-1.24%).
The 10-year US government bonds yield moved away from seven-year highs. At the moment, the indicator is at the level of 3.18-3.19%.
Today, the news feed is rather calm:
Export and import price indices in the US at 15:30 (GMT+3:00);
Michigan consumer expectations and sentiment at 17:00 (GMT+3:00).
FTSE100 Index Has Extreme Reading, A Buy Opportunity?
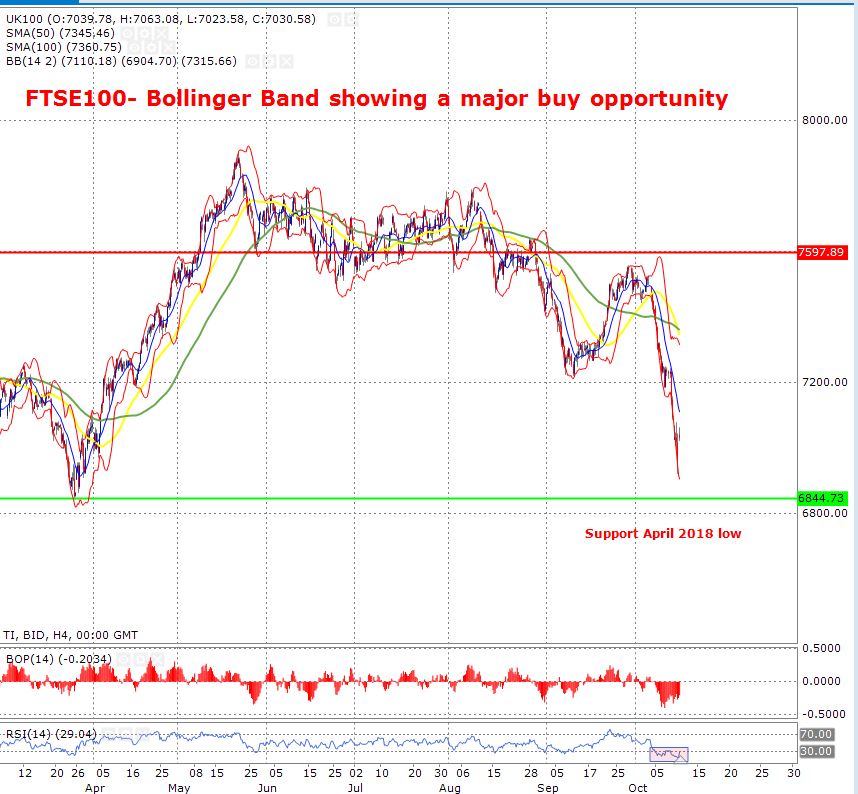
There is one clear signal when you look at the FTSE 100 4-hour chart. The price is way oversold and a rebound trade or at least the price consolidation is strongly on the cards. The reason behind this argument is that the price has pierced the lower line of the Bollinger band which generally generates a buy signal. When such an extreme signal takes place, the price usually moves towards its mean (the 20-day moving average shown in blue). At the same time, the Relative Strength Index is also showing that the price is oversold and the RSI is trading below the 30-mark. A reading which is near 30 or below 30 shows that the price is oversold and a reading above 70 or near 70 shows that the price is way overbought and a correction may take place.
Leaving the Bollinger band and the RSI on one side, the strength of the downtrend can also be measured by looking at the 50-day and 100-day moving averages. The 50-day moving average is shown in yellow and the 100-day moving average is shown in green. The 50-day moving average has dropped below the 100-day moving average and this shows that the downtrend is very strong.
The major support is 6844 and the resistance is 7597
DAX Is Over Sold, The Price Can Bounce Back
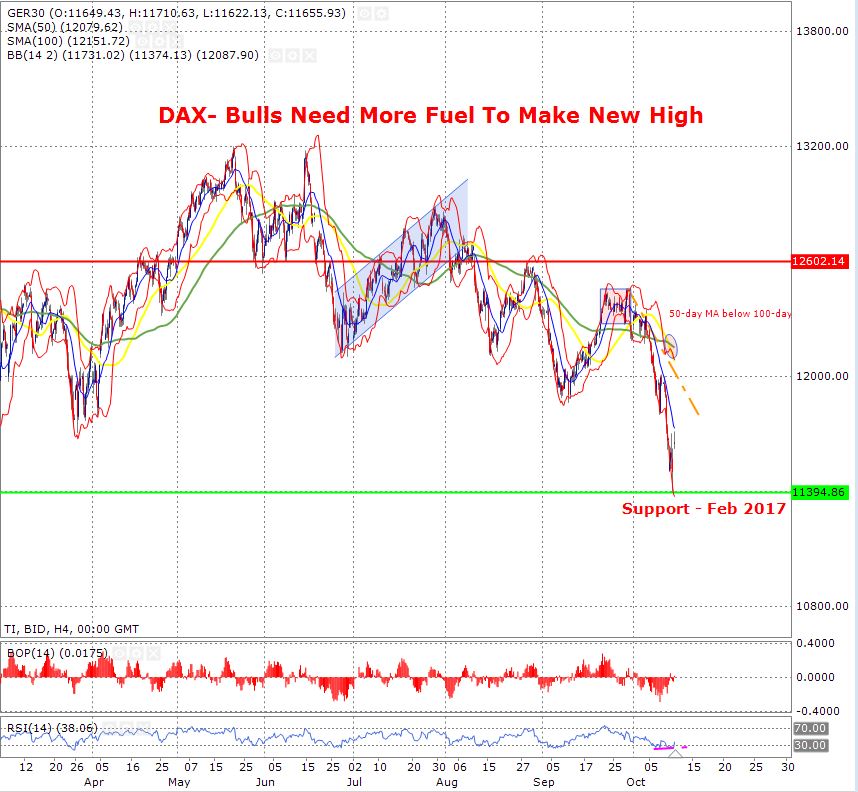
The intra-day chart for the Dax index is very similar to that of FTSE 100. The 4-hour time frame chart shows that the price is also oversold and the confirmation is coming from the Bollinger band. When the price pierces the lower band of the Bollinger band, it shows that the price is oversold and when the price pierces the upper line of the Bollinger band, it shows that the price is oversold. However, one important thing to note is that the price of DAX index has moved back into the Bollinger band fairly quickly and the upcoming resistance for the price is the 20-day moving average (shown in blue).
The Balance of Power indicator shows that the bears are losing control of the price and bulls have started to handle things much better. Having said this, the price needs to break above the downward trend line and this will give us a confirmation that we have an upward trend.
The major support is at 11394 and the resistance is at 12602
Forex Technical Analysis: EUR/USD, USD/JPY, GBP/USD
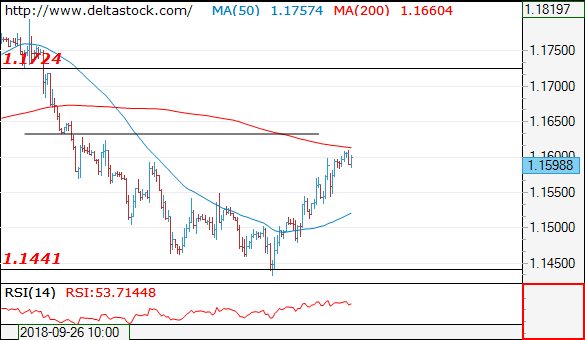
EUR/USD
Current level - 1.1598
Allow a test of 1.1640, before drowning towards 1.1550 static support.
| Resistance | Support | ||
| intraday | intraweek | intraday | intraweek |
| 1.1640 | 1.1835 | 1.1550 | 1.1300 |
| 1.1720 | 1.2010 | 1.1440 | 1.1100 |
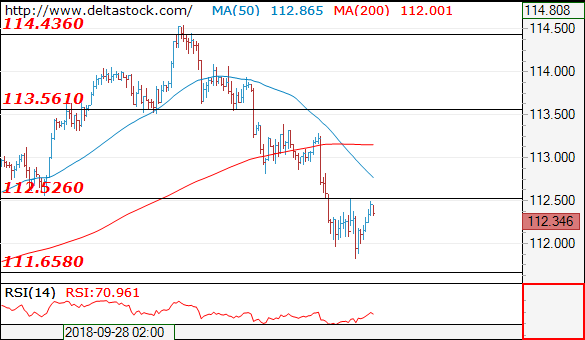
USD/JPY
Current level - 112.34
The intraday bias is already positive, for a break through 112.50, towards 113.50 zone.
| Resistance | Support | ||
| intraday | intraweek | intraday | intraweek |
| 112.50 | 114.40 | 111.65 | 111.65 |
| 113.50 | 114.40 | 111.65 | 110.40 |
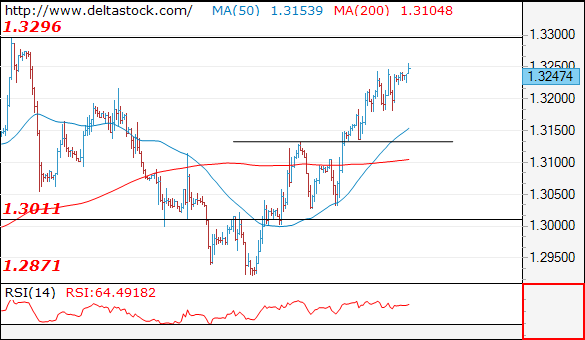
GBP/USD
Current level - 1.3247
The bias is positive, for a tight test of 1.3295 peak and my outlook is bearish below the mentioned hurdle, for a slide towards 1.3130.
| Resistance | Support | ||
| intraday | intraweek | intraday | intraweek |
| 1.3295 | 1.3440 | 1.3130 | 1.2570 |
| 1.3295 | 1.3440 | 1.2870 | 1.2570 |
Brent Oil Outlook: Bears Are Taking A Breather, Downside Remains Vulnerable While 20SMA Caps Recovery
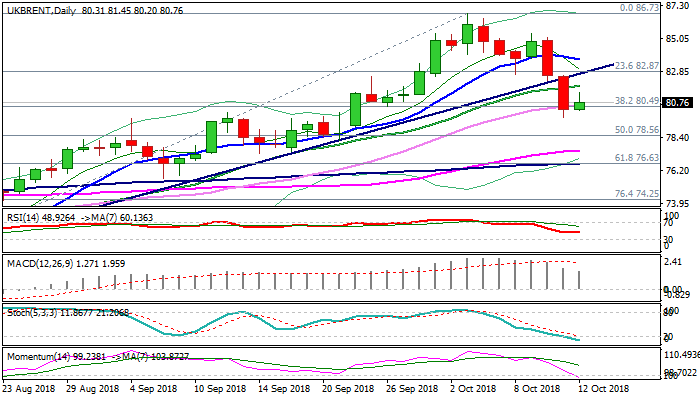
Brent price moved higher on Friday after strong fall in past two days, when the contract registered losses of 5.4%, on strong fall in equity markets, as well as fading supply concerns.
Stronger than expected rise in US crude stocks (EIA report showed build of 5.98 million barrels vs 2.62 million barrels forecast) added pressure on oil price.
Positive data from China which showed robust Chinese crude imports, offered support to oil prices and provided temporary relief, however, oil is on track for strong bearish weekly close (the first weekly loss after four consecutive weeks in green), which marks negative signal.
Also, Thursday’s marginal close below pivotal $80.50 support (Fibo 38.2% of $70.39/$86.73 / 30SMA) and rising bearish momentum on daily chart, add to negative outlook.
Weekly close below $80.50 would generate fresh bearish signal for extension of pullback from $86.73 (03 Oct high).
Corrective upticks so far look like positioning for fresh weakness, with rising 20SMA ($81.88) expected to cap.
Only return and close above broken bull-trendline ($82.60) would sideline downside risk and signal stronger recovery.
Res: 81.45, 81.88, 82.60, 83.67
Sup: 80.50, 80.00, 79.79, 79.16
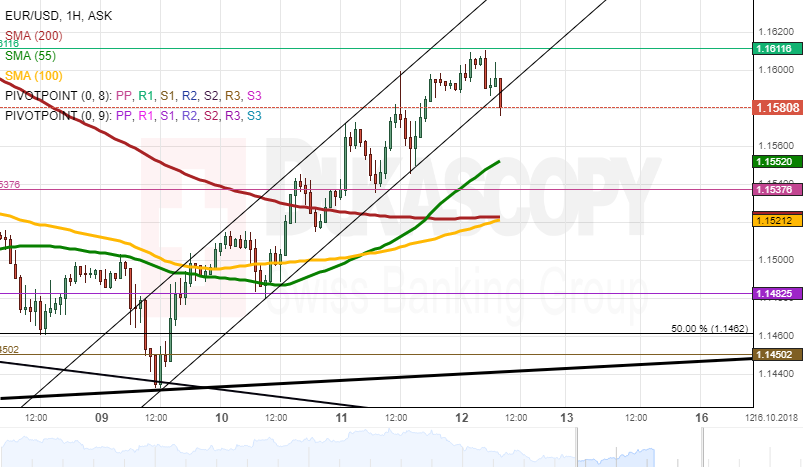
EURUSD Analysis: Trades At 1.1580 Level
The European Single Currency appreciated 0.56% against the US Dollar since Thursday's session. During the previous session, the currency rate surged to the weekly R1 at the 1.1611 mark. During Friday's morning hours, the rate almost reached the weekly R1 to trade at the 1.1587 mark.
In regards to the near-term future, most likely, the European Single Currency will try to break the resistance of the weekly R1 to trade near the monthly PP at the 1.1620 level during the trading session.
However, the weekly R1 resistance could stop the rate from surge to change the rate's direction to move the currency pair to trade at the 1.1580 level on Friday.
GBPUSD Analysis: Will Surge To 1.3260
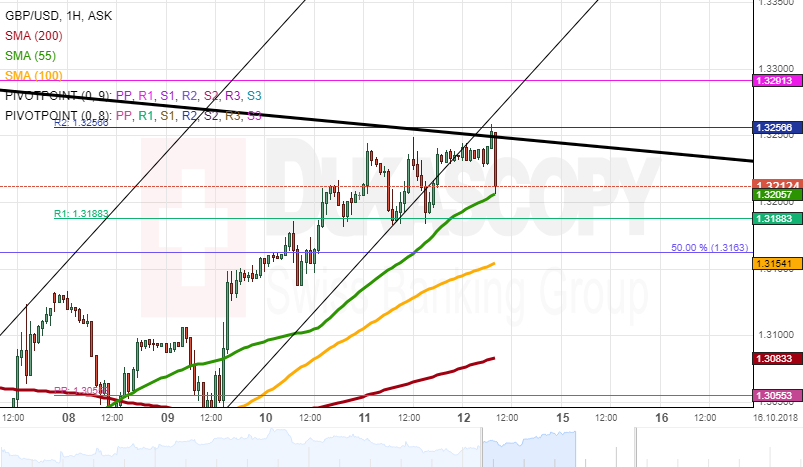
The British pound appreciated 0.27% against the US Dollar since Thursday's session. During Thursday's trading session, the rate broke the upper boundary of the large descending pattern to trade at the 1.3200 level. On Friday, the British pound was located below the weekly R2 at the 1.3240 mark.
In regards to the near-term future, most likely, the currency exchange rate will break the resistance of the weekly R2 at the 1.3256 due to the support of the 55-hour SMA and the support of the large pattern line to trade at the 1.3260 level.
On the other side, the British pound might get resisted by the weekly R2 to move the rate to trade sideways at the 1.3220 level during the trading session.