Sample Category Title
Week Ahead – FOMC Minutes, EU Brexit Summit & Trade War
U.S. yields have stabilized after the sell-off and this will be a key focus for next week
The Sell-Off in equities continued with very high volumes and VIX index climbed to the highest level since February. However, U.S. yields have stabilized after the sell-off and this will be a key focus for next week. Italy continues to be under the spotlights. China September exports surged and this confirmed that the country isn’t going to fall off the cliff. China still has record surplus with the U.S. despite the new tariffs. Oil has it is the biggest weekly drop since May.
Technical Analysis:
EURUSD
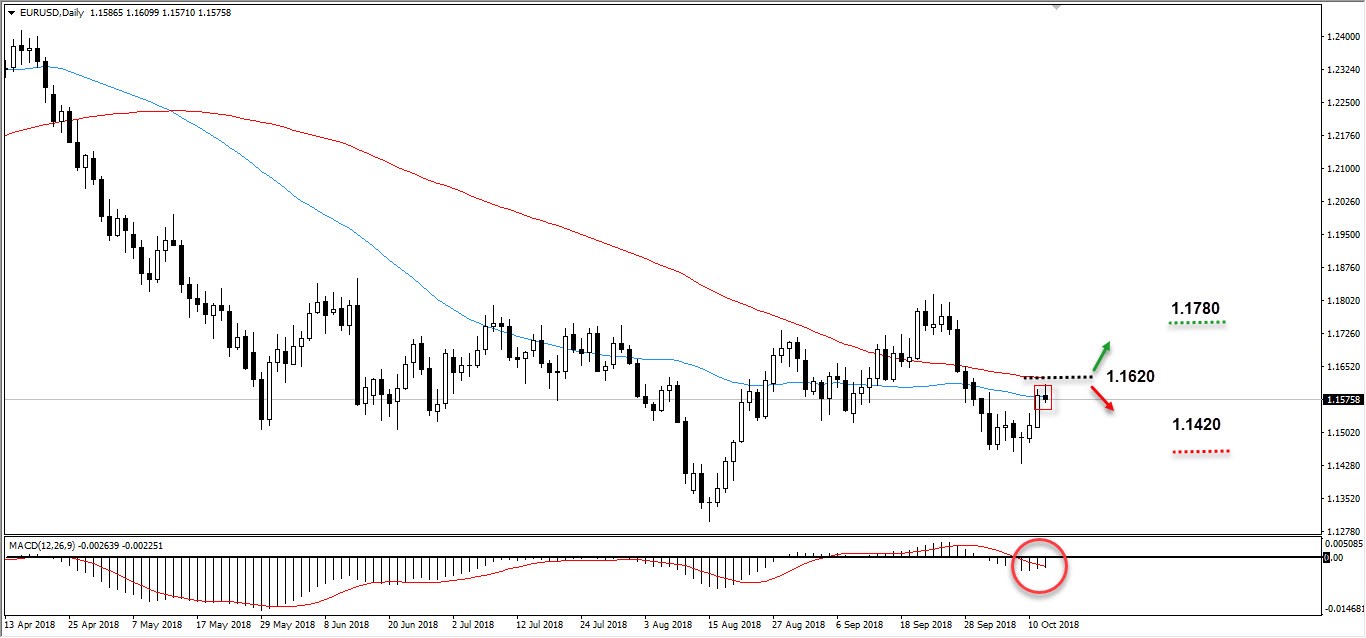
EURUSD has rebounded from major support at 1.14s levels on a daily time frame. The price is below a critical level at 1.1620/1.1650 and this confirms that the trend is skewed to the downside. Having said this, the price is firmly trading below the 50 and 200-day moving averages which shows that the there are higher chances that the price may continue its downward move. Currently, there is a battle between the price and the 50/200-day moving average and if the price breaks towards the upside it will strength the odds for the uptrend.
The Balance of Power shows that the bears are still controlling the momentum, we need to see this momentum to continue next week and this would support the above argument.
All the important support and resistance zones are shown on the chart below.
GBPUSD
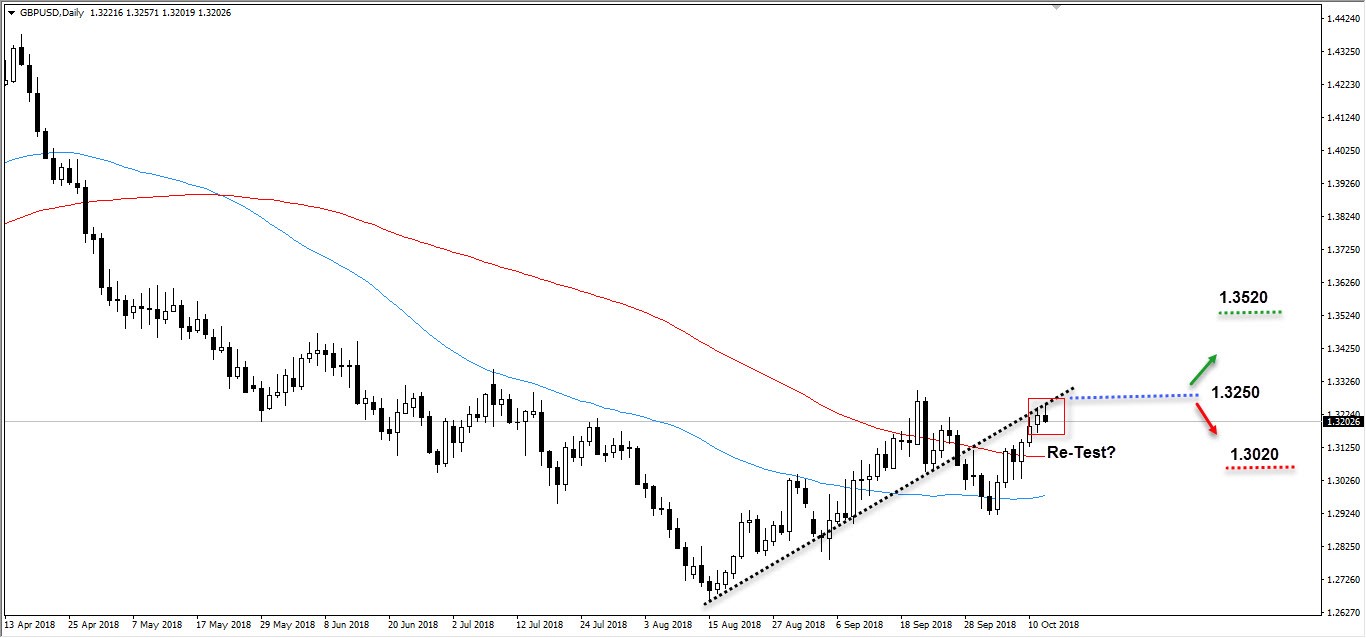
GBPUSD is trading near the broken short-term up trend on its daily time-frame. The price is trading below 1.3250 and recent high of 1.3250s and this confirms that the trend is skewed to the downside. Currently, there is a battle between the price and the major resistance and if the price breaks towards the upside, the odds will be even stronger that the uptrend will shape up from there.
The Balance of Power shows that the bulls are still controlling the momentum, we need to see this fading and that would support the above argument.
The resistance is shown by the green horizontal line which is the highest point which the price made on the 14th of June. The support is show by the red line which is the lowest point formed on the 5th of October.
XAUUSD
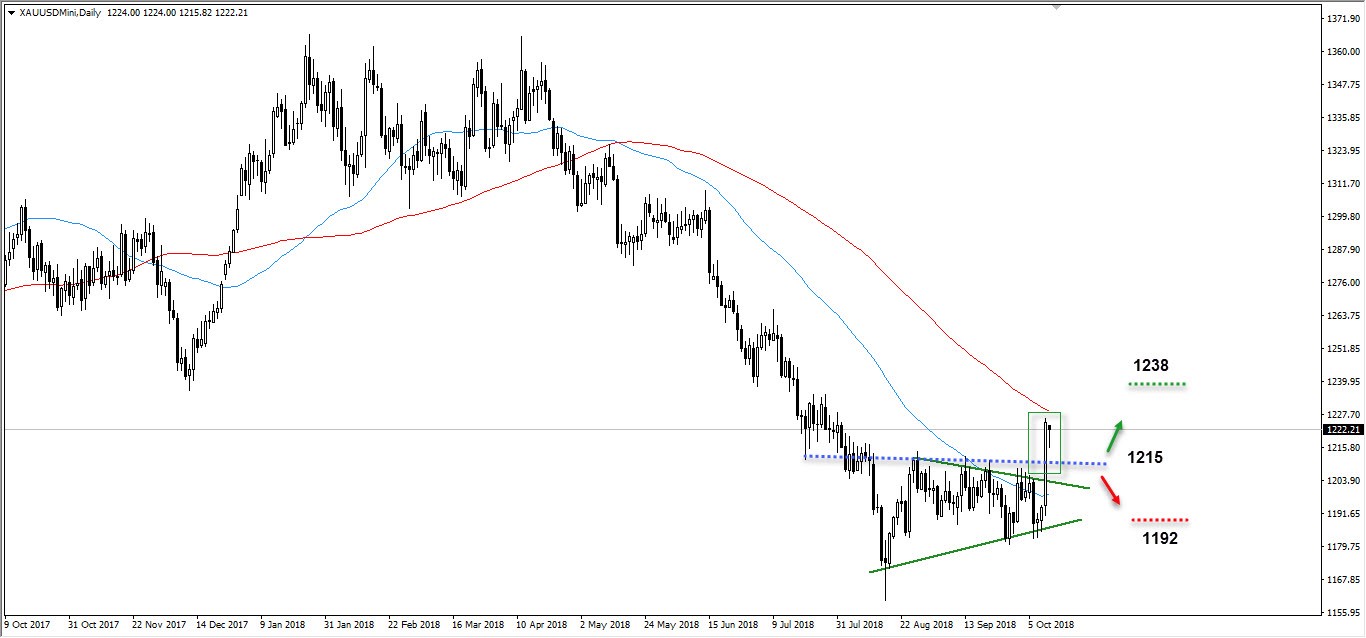
The yellow metal has broken-out the symmetrical triangle on it daily time frame. The price is trading in a bullish momentum and this confirms that the trend is skewed to the upside. Having said this, the price is firmly trading above the 50-day moving averages which shows that the there are higher chances that the price may continue it bullish move. Currently, there is a battle between the price and the 200-day moving average and if the price breaks towards the upside, the odds will be even stronger that the uptrend will shape up from there.
The Balance of Power shows that the bulls are still controlling the momentum, we need to see this continues and that would support the above argument.
The resistance is shown by the green horizontal line which is the highest point which the price made on the 17th of July. The support is show by the red line which is the lowest point formed on the 10th of October.
Oil
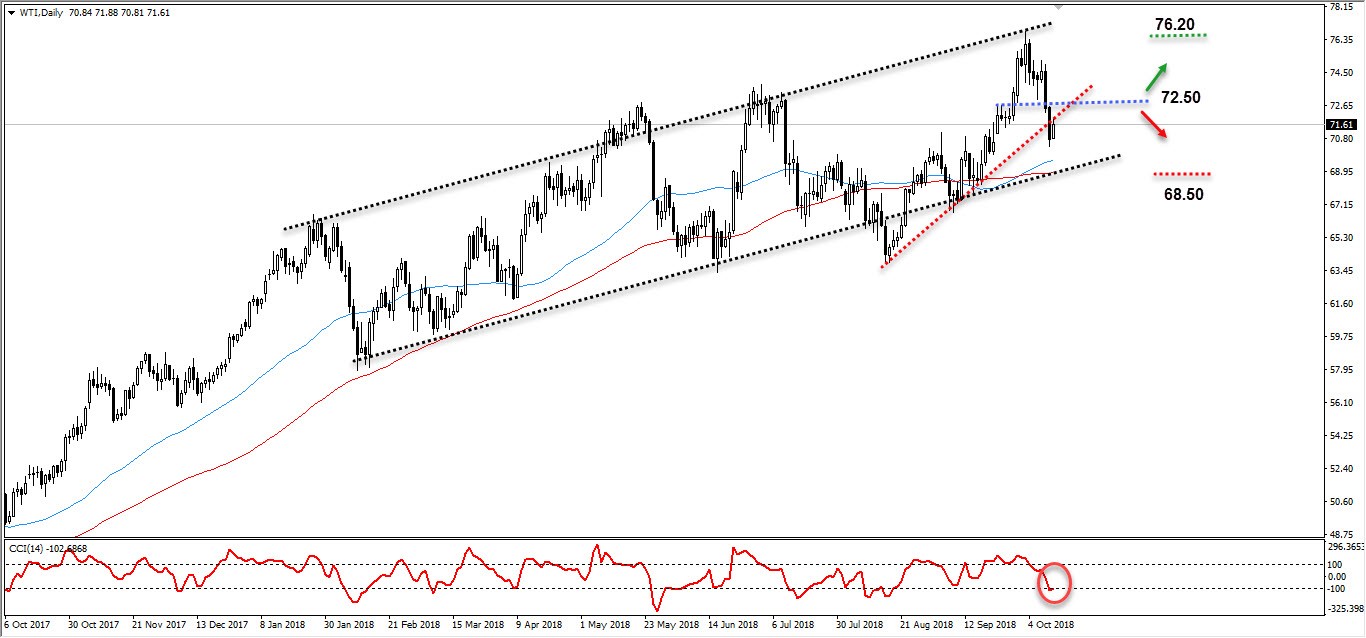
Oil is trading within its upward channel on a daily time frame. After, touching the upper line of the channel, it is moving toward the bottom line of this channel. This shows that the bears are taking back the control but the uptrend is still intact. Currently, there is a battle between the price and the resistance level (shown by blue horizontal line as shown on the chart) and if the price failed to break it to the upside, the odds will be even stronger that the downward move will continue from there.
The Balance of Power shows that the bears are still controlling the momentum, we need to see this continue and that would support the above argument.
The resistance is shown by the green horizontal line which is the highest point which the price made on the 3rd of September. The support is show by the red line which is the lowest point formed on the 17th of September.
Australia & New Zealand Weekly: Credit Spreads and Monetary Policy Cycles
Week beginning 15 October 2018
- Credit spreads and monetary policy cycles.
- RBA: minutes, RBA Deputy Governor Debelle speaks.
- Australia: Westpac-MI Leading Index, employment,
- NZ: CPI.
- China: GDP, new loans.
- Europe: EU Summit.
- US: FOMC meeting minutes, retail sales.
- Other central banks: BoK policy decision, BoE Carney speaks, BOJ Kuroda speaks.
- Key economic & financial forecasts.
Information contained in this report current as at 12 October 2018.
Credit Spreads and Monetary Policy Cycles
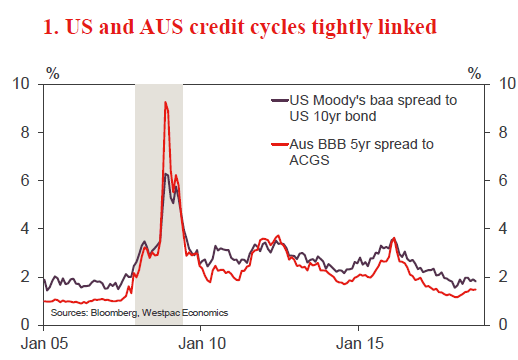
Though credit spreads in the US are off their lows, they have remained relatively impervious to the heightening global risks surrounding trade and geopolitics. This partly reflects the strength in the US economy which has continued to support corporate earnings. With credit spreads in the US and Australia tightly linked, our spreads have also held at a low level.
As the Fed continues to push the federal funds rate higher, we are approaching the 'neutral' policy rate and therefore nearer the top of the cycle. It is rare policy remains at its plateau for a sustained period, and so it is not premature to start considering a turning point in the current expansion.
In assessing the risks, this piece will examine the historic dynamic between the US 10 year bond yield and credit spreads and questions why the relationship may be different in the current cycle. As Australian credit spread indexes only date back just over ten years, this analysis uses Moody's Baa index as a proxy for general credit spreads*. While it references longer dated assets than the US 10 year, and comprises of US assets rather than Australian, chart 1 shows that it is a suitable substitute data series for the Australian 5y BBB index for the purposes of assessing cyclical trends.
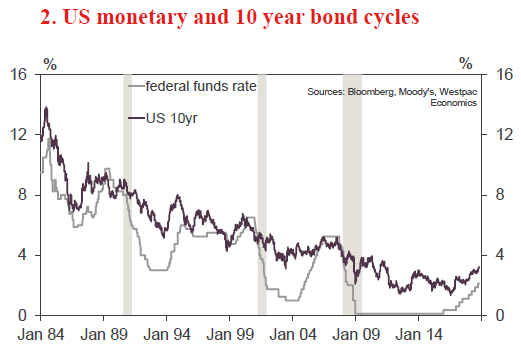
In the post-stagflation era, credit spreads and the 10 year bond have shown a close negative relationship. Credit spreads typically lift from their bottom at around the same time the 10 year bond yield falls from its cyclical peak. As such, fixed rate corporate credit often tends to be in part naturally hedged with movements in the credit spread offset to varying degrees by movements in the 'risk-free' component.
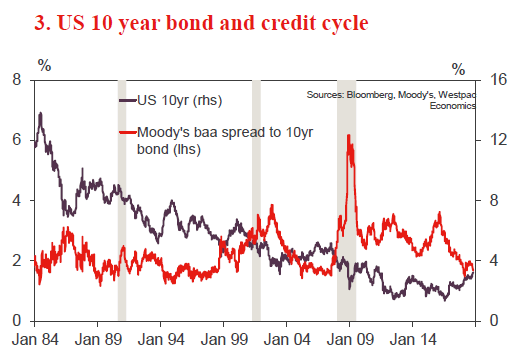
A clear feature of chart 3 is the downward structural trend in the US 10 year yield as opposed to stationarity in the credit spread which has shown a firm support around 1.5% over the past three and half decades. On the other hand, the 10 year yield has moved lower on the back of the structurally lower federal funds rate and associated lower 'neutral rate'. Therefore a clearer way to visualise the relationship between credit spreads and the 10 year bond is to look at the change in rates rather than the outright level. Chart 4 shows the weekly change in the US 10 year bond yield and the Baa credit spread from 1998.
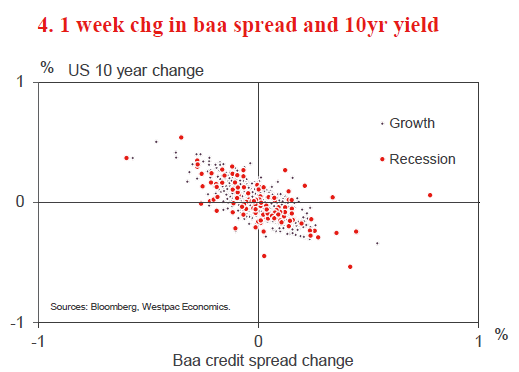
There appears to be a fairly consistent negative relationship in times where the economy is expanding. But note the cluster of outliers to the right of the chart which emphasise the potential for outsized widening in credit spreads relative to the fall in bond rates during a credit crunch such as the GFC. Also, the extent that the purple dots (reflecting non-recessionary periods) are scattered shows that the bond rate and spreads can experience smaller financial cycles within the broader overarching economic cycle. The table overleaf shows the trough and peak of recent 'risk-off moves' in credit spreads and the coinciding move in the 10 year bond rate over the period.
In the 'risk-off' periods up to the GFC, the moves in credit spreads have generally approximated the moves in bond rates. However, the GFC saw an exceptionally large widening in credit spreads, well in excess of the decline in the bond rate over the period, which emphasises the potential for non-linear reactions.
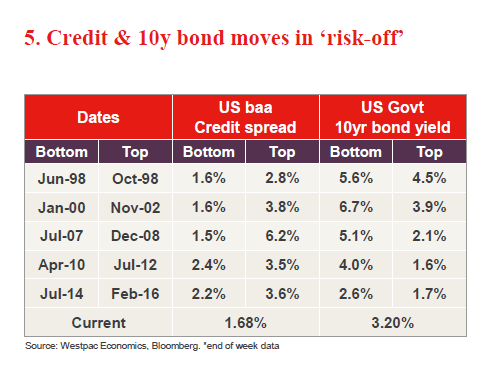
The latest example through 2014-16 when a more moderate widening in spreads was met by a lesser decline in the bond rate bears of most interest for what may be ahead of us.
From July 2014 to February 2016, the Baa spread rose by around 1.4% whereas the bond rate fell by only 0.9%. Notable in this cycle was the starting rate of the bond rate which was much lower than that of previous ones – 2.6% compared to 4-7%. With the neutral federal funds rate having structurally trended closer to the lower bound, there is less room for bond rates to fall in an economic downturn. Consequently, the relationship between credit spreads and the US 10 year bond yield is likely to become increasingly non-linear even in less severe 'risk-off' environments.
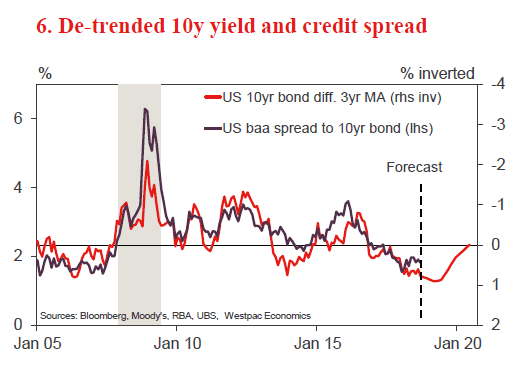
To illustrate the above point, chart 6 looks at the Baa credit spread and the 10 year bond yield de-trended by taking the difference between the actual rate and its trailing three year moving average. The relationship has been very tight over the last thirteen years but there are two notable exceptions. The first was mentioned before, the 2014-16 period, and the second was the taper tantrum in 2013 where bond yields rose but credit spreads were relatively stable. It is likely that in the latter, higher bond yields were driven by flow effects (or expectation of flow effects) rather than strength in fundamentals which would typically see lower credit spreads. That has important implications for today's environment given that the Fed is still quantitative tightening.
Conclusion
Our base case forecast for the US 10 year bond rate is a rise in the short-term to 3.5% in June 2019 followed by a decline back to 2.8% in December 2020 as the Fed stops hiking. Based on the historical negative relationship, this would see general credit spreads reach their lows by June 2019 and then start to widen from thereon.
It is important to note that our anticipated retracement of the US 10 year yield is quite shallow and is conditioned on a softlanding for the US economy. That then would be associated with only a moderate rise in credit spreads.
If a worse scenario were to take place and credit spreads were to widen more significantly, it is likely that the protection from a coinciding decline in the US 10 year bond yield would be more muted than in past crises. This is because we are closer to the lower bound in interest rates and there is less room for the 10 year to fall. On the other hand, credit spread widening is far off any potential limits to the upside.
Nevertheless, we consider the risks to the timing of our outlook are skewed to the upside. An extension of the hikes into the second half of 2019 would imply a lengthening of the current expansion and allow greater room for the 10 year to fall.
A second word of caution relates to the scope of this analysis. The history is deliberately chosen from the post-stagflation era. The unlikely (albeit still possible) return of stagflation would see higher and more uncertain inflation expectations, higher bond yields and higher credit spreads.
The week that was
It has been a tumultuous week for the global economy, with higher US term interest rates; fears over global growth; and some ill-considered words from President Trump resulting in a dramatic sell-off for global equity markets. Brexit negotiations are ongoing, with positive rumours but little fact. Ahead of next week's European Council Summit, angst over Italy's budget also lingered. Back in Australia, abstracting from market tremors, businesses remain in a strong position, but consumers are circumspect over housing and spending.
Albeit underpinned by strength in the US economy, last week's rise in the US 10yr yield to its highest level in seven years at 3.25% clearly unnerved investors across the world. Higher interest rates in the US combined with a higher currency are tightening financial conditions and creating a headwind for US growth into 2019. This is not only of significance for the US. Investors are also clearly concerned over the effect higher US interest rates and reduced US dollar liquidity will have on emerging markets, particularly as the US/ China tariffs come into full effect; Turkey and Argentina's woes persist; and a number of emerging Asian nations have to increase policy rates further to offset potential inflation shocks from the dramatic currency depreciations experienced over the past year.
These are all legitimate concerns and reason for a reversal of some of global markets' recent gains. But arguably the veracity of the declines (now almost 8% for the S&P500 from the latest peak) has as much to do with remarks by President Trump. Late on Wednesday and Thursday, President Trump labelled the Fed as "out of control"; "ridiculous"; and "loco" given their recent decision to raise interest rates for a third time in 2018 and guidance that further rate hikes will be seen through 2019 and into 2020. Thursday's "they're making a big mistake" subsequently amplified concerns, being a stark contrast to the optimism and confidence that Chair Powell and the FOMC have been communicating in recent months.
We at Westpac continue to hold that 2.875% is more likely to be the peak in the federal funds rate – 50bps below the FOMC's own median forecast. Our lower end point is a consequence of the continued absence of a wage/ inflation threat and a belief that GDP growth in the US will slow back to trend at the end of 2019 – where it will remain thereafter. The past 7 days have supported this view. While the September US employment report was another blockbuster in terms of job creation, hourly wages growth remained modest. The September CPI report subsequently disappointed, with headline and core inflation coming in at just 0.1%. For the latter, while one-off negatives held down inflation in September, there was no real evidence of underlying inflation pressures building in the detail. Looking ahead, US inflation will run higher on the back of rising tariffs; higher energy costs; and replacement spending after hurricane season, but these are also one-offs which the FOMC will look through. The FOMC will only follow through with rate hikes past our forecast of 2.875% if the underlying strength of the economy (activity; wages and inflation) warrant it. On the economics of the situation, there is therefore cause to be broadly sanguine on the outlook for markets. Politics however will remain a source of material uncertainty.
Coming back to Australia, there have been two key releases this week: the NAB business survey; and our own Westpac–MI consumer sentiment survey.
For business, both conditions and confidence rose in September, signalling a stabilisation after the first half's deceleration and the political shock to confidence that came from the Liberal leadership spill in August. At current levels, confidence is around average, and conditions well above. While forward orders and investment intentions both fell in the month, broadly they are still positive for the outlook. Employment intentions are also constructive for growth, remaining at an elevated level. The industry breakdown continues to show mining, construction and business services as the stand-out sectors. Retail in contrast continues to lag, though momentum for recreational and personal services is promising.
Australian consumers are also positive on the economy, with views on the one and five-year outlook above average. That said, though this confidence has translated through to optimism over the labour market, family finance expectations remain subpar. This is particularly the case for the year-ahead view, which is about 5% below average. This disconnect is, in part, due to persistent weakness in wages growth, but also the ongoing housing market deterioration. Price declines are continuing, and our sentiment survey suggests there is further declines to come, with house price expectations 20% below average overall and Sydney and Melbourne particularly weak. Understandably, 'time to buy a house' and 'a major household item' are respectively 14% and 6% below average. The latter highlights the significance of price declines and higher interest rates not only for housing construction, but also for consumption.
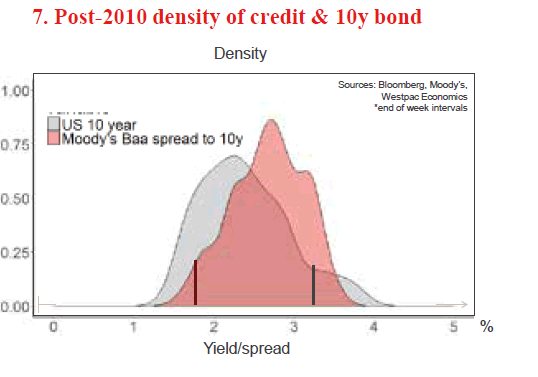
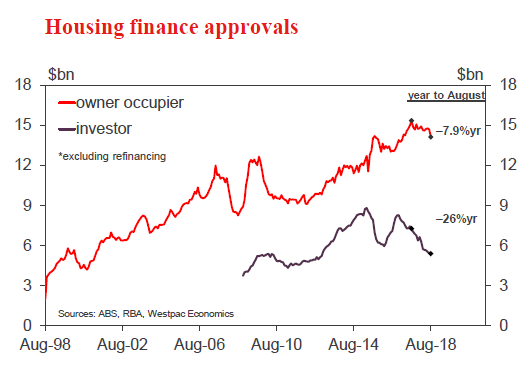
Chart of the week: Australian housing finance
Australian housing finance approvals continued to soften in August. The headline number of owner occupier loans fell 2.1%, -10.2%yr, and excluding refinancing, the decline amounted to 2.9%, 13.9%yr. The value of investor loans were also lower, down 1.1% to be 20.5% lower over the past year to August (an estimated -26% excluding refinancing).
The total value of housing finance approvals including investors but excluding owner occupier refi, fell 2.7% in August and is down 13.6% in annual terms.
New Zealand: week ahead & data wrap
Rolling along
After last week's weak business confidence headlines, we had several reminders this week of why we're actually looking for the "hard data" to show a tick up in momentum over the next couple of months. Most notably, retail spending growth exceeded expectations for a second month in a row, and the Government's books for the year to June are in even better shape than forecast. Looking ahead to next week, we outline what we expect to see in the September quarter CPI release.
While weak confidence data continues to hog the headlines, other indicators of how the New Zealand economy is tracking still paint a more resilient picture of economic activity. This week's electronic transactions data showed retail spending beat expectations for a second consecutive month. While part of the lift was down to higher fuel prices, that wasn't the entire story. Core retail spending (which excludes spending on fuel and other auto-related spending) was up a healthy 1.1% in September, and 5.1% higher than a year ago. So while we remain on alert for signs record high fuel prices are putting the squeeze on household spending, the data suggests that's not happening yet.
One reason spending seems to be holding up reasonably well in the face of rising petrol prices might be the boost low and middleincome households are receiving from the Government's flagship Families Package. A number of elements of this package came into effect on July 1, and the package will pump $1.2bn dollars into household incomes in the year to June 2019, rising to $1.5bn a year by the time the package is fully implemented in 2020/21.
The release of the final fiscal accounts for the year to June 2018 showed that the package was certainly one the Government can afford. The Government's books were in much better shape than expected, with higher than forecast revenues and less spending than planned leading to a $5.5bn surplus. That's $2.4bn higher than was forecast in the May Budget. This larger than expected surplus meant that net core Crown debt fell by $2bn over the June 2018 year, taking net debt down to 19.9% of GDP. That's already inside the 20% of GDP level the Government set as a self-imposed debt target under its Budget Responsibility Rules. What's more it has met this target 4 years ahead of schedule.
Delays in capital spending also contributed to the lower borrowing requirement. This is not a new trend. As we have been pointing out, spending as much as they'd like on infrastructure has proved difficult for governments in recent years, with capacity constraints the main hindrance to a lift in infrastructure spending. So far politicians have been keen to hose down expectations of a spending spree on the back of the better than expected fiscal accounts. However, these calls will no doubt intensify in the lead-up to the 2019 Budget, especially if the economy continues to trundle along at a reasonable pace. This could allow the Government to announce even more spending than it already has planned. The stronger than expected starting point also provides some leeway if economic growth fails to live up to the Treasury's upbeat forecasts.
Another reason household spending may hold up reasonably well as we head into the end of the year is slightly more positive news on the housing front. The latest housing market data for September suggested that the New Zealand housing market remains steady, with nationwide prices rising slowly. While we remain downbeat on the long-run outlook for the housing market due mainly to tax changes and the foreign buyer ban, in recent weeks the more dovish tone from the RBNZ has resulted in a sharp drop in fixed mortgage rates. This is likely to support a modest pickup in housing market activity in the coming months. It's probably too early to see an impact from this change yet but, there were a few hints in the REINZ September data. Auckland house prices (which seem to be most sensitive to changes in mortgage rates) increased 0.5% in the month – the first monthly lift in prices in the region since February 2018.
Looking ahead to next week, the focus will be on the September quarter CPI release on Tuesday. We expect a 0.7% rise in the Consumer Price Index (CPI) for the September quarter, taking annual inflation up to 1.7%. That's well above what the RBNZ was thinking back in August when it forecast 1.4% annual inflation in September. However, unlike our forecast, the RBNZ's pick won't fully account for the lift in fuel prices we've seen since August.
This lift in fuel prices will make a significant contribution to September quarter inflation. However the weaker NZ dollar is also playing a broader role, pushing up prices for imported goods. Both these factors are also likely to feature in December quarter, which could mean inflation briefly nudges above the 2% mid-point of the RBNZ's target band. Inflation above 2% could make rate cuts a harder sell for the RBNZ in the near term. Despite this the RBNZ remains squarely focused on risks to the growth outlook. Should growth falter, we don't think inflation marginally above the midpoint of the target band would stop the RBNZ cutting the OCR.
Data Previews
Aus Sep Westpac–MI Leading Index
- Oct 17, Last: –0.02%
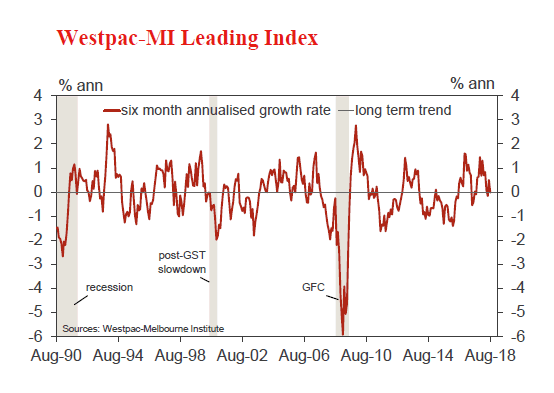
The six month annualised growth rate in the Westpac– Melbourne Institute Leading Index, which indicates the likely pace of economic activity relative to trend three to nine months into the future, fell from 0.5% in July to -0.02% in August. While the signal has been volatile this year, the signal points to slowing growth momentum heading into year end and early 2019.
The September read will again include a mixed bag of updates. Components with weaker reads include: dwelling approvals, down sharply by -9.4%; the ASX200, down -1.8% vs 0.6% last month; and the Westpac-MI Unemployment Expectations Index which deteriorated marginally after a significant improvement last month. This will be balanced by more positive reads for the Westpac-MI Consumer Expectations Index (up 0.9%); commodity prices (up 2% in AUD terms); and a modest widening in the yield spread (+7bps).
Aus Sep Labour Force, employment '000
- Oct 18, Last: 44k, WBC f/c: 15k
- Mkt f/c: 15k, Range: 5k to 30k
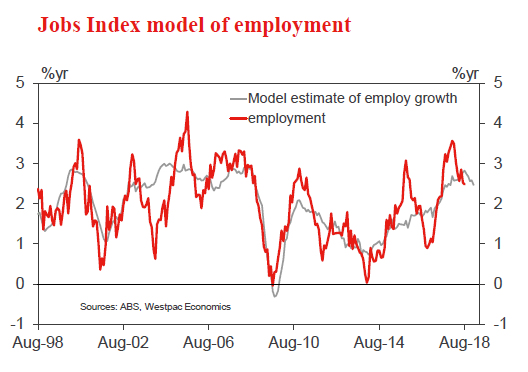
Employment lifted 44.0k in Aug with full-time rising a solid 33.7k (+20.1k in July) and part-time putting in a sound gain of 10.2k (not fully reversing the Jul –24.4k). The annual pace was flat at 2.5%yr (+310.4k in the year) with the six month annualised pace lifting to 2.2%yr from 1.4%yr. The momentum in employment has eased from its above trend pace but is likely to hold around 2%yr to end 2018.
Our Jobs Index, and Westpac-MI Unemployment Expectations, both suggest that the current positive employment momentum can be maintained at least until year end. Our forecast for a 15k rise in employment will see an annual, and a six month annualised, pace of 2.4%.
The ABS notes that the outgoing rotation group in the September Labour Force Survey has a lower employment to population ratio than the average for the sample as a whole. As such the risk to our forecast lie to the upside.
Aus Sep Labour Force, unemployment %
- Oct 18, Last: 5.3%, WBC f/c: 5.3%
- Mkt f/c: 5.3%, Range: 5.1% to 5.4%
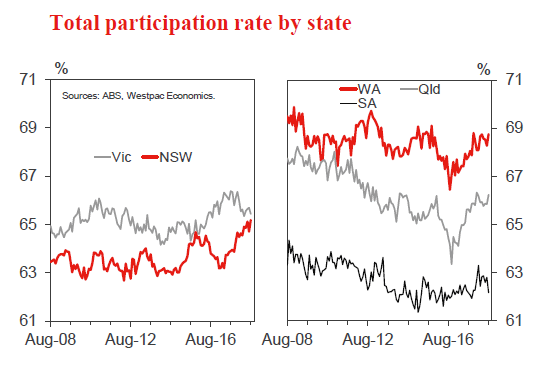
The robust Aug employment gains were matched by a rise in participation to 65.7%, from 65.6%, boosting the labour force by 49.6k. This was enough to hold the unemployment rate flat at 5.3%. The record high for participation is 65.8% set in November 2010. August saw solid gains in both male (71.1% from 70.9%) and female (61.5% from 60.4%) participation and this mix saw male unemployment fall to 5.2% (from 5.3%) while female unemployment rose to 5.4% (from 5.2%).
The rise in participation has been driven by NSW, and in particular, females in NSW where it is hitting record highs. While we may be nearing the peak for participation in NSW, other states have room to grow. As such, we expect participation to hold at 65.7%, leaving the unemployment rate at 5.3%.
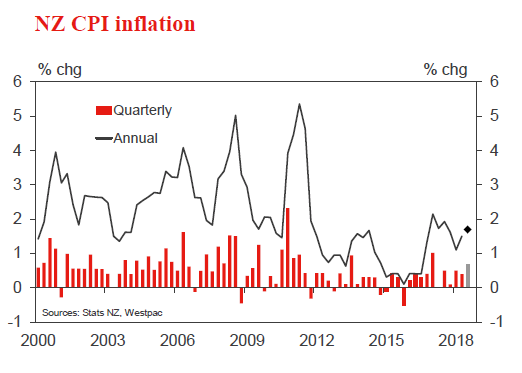
NZ Q3 CPI
- Oct 16, Last: 0.4%, Westpac f/c: 0.7%, Mkt f/c: 0.7%
We expect a 0.7% rise in consumer prices for the September quarter, taking annual inflation up to 1.7%.
Higher fuel prices account for much of the quarterly rise. We also expect the lower exchange rate over the last year to have an impact on prices of imported goods.
Inflation is set to rise above the 2% midpoint of the Reserve Bank's target range by year-end. A petrol-induced rise in inflation could make OCR cuts a harder sell in the near term, though it certainly wouldn't preclude rate cuts if the economy faltered.
China Q3 GDP
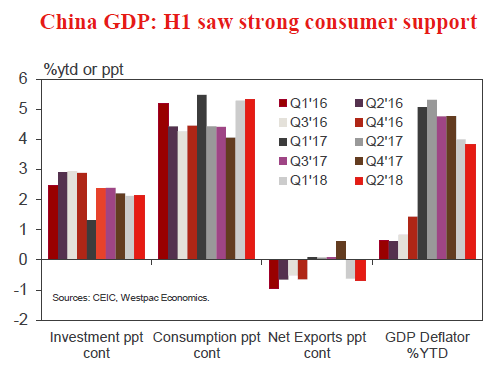
- Oct 19, last 6.7%, WBC 6.6%
2018 has been a year of change for China's economy, some voluntary, some forced upon it. Throughout, we have held to a sub-consensus view on growth to highlight the risks to investment (a result of ongoing structural change in their financial system and a clear focus on the quality of growth) and, more recently, from building tensions with the US and slower global growth.
Come Q3, we believe a softer pulse for the consumer (after a particularly strong first half) along with lingering weakness in business and government investment will weigh on growth. However, the race to minimise the cost of tariffs on exporters should see net exports add to momentum, having been a negative early in 2018. The net effect should be an annualised pace of gain consistent with our sub-consensus view of 6.3% for the year (1.6% q/q), but an annual rate at 6.6%yr.
US Sep retail sales
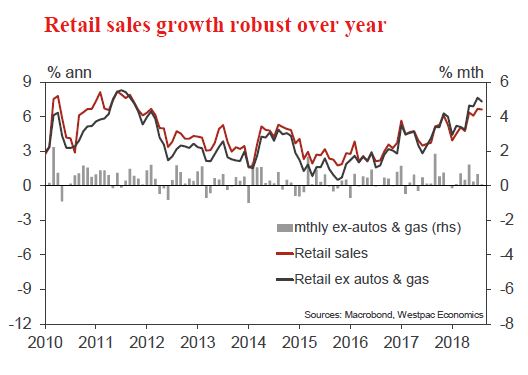
- Oct 15, last 0.1%, WBC 0.8%
US retail sales have been decidedly mixed of late, with negative revisions offsetting an upside surprise to the latest actual or vice versa. Growth over the year remains robust though, at 6.6%yr in August.
The underlying supports for US consumption remain strong, with employment growth continuing at pace; wages growth firming; and consumer confidence strong. The elevated price of oil is a partial offset to these long-running positives.
Come September, we look for a bounce in spending, a 0.8% gain for headline sales and a 0.5% rise for core activity. From those two forecasts, apparent is that spending on autos and gasoline will be positive in the month. This is also likely to be the case into year end, particularly for autos in regions hit by the 2018 hurricane season.
Weekly Focus: The Return of Volatility
Market movers ahead
- Higher US yields and sharp stock market declines have been two major topics this week. Volatility may persist in the short term as the earnings season continues next week but we still expect equities to move higher over 3-12M (see also page 5).
- Brexit negotiations enter a crucial week with the EU summit coming up. Both the EU27 and the UK seem optimistic.
- On Monday, the Italian government is due to submit its 2019 budget proposal to the EU. Eventually, we expect the Commission to voice a negative opinion and ask for a revision.
- We do not expect the US Treasury to declare China a currency manipulator when it publishes its FX report, due out next week.
- In Sweden, we expect Valueguard prices to show Stockholm flat prices fell by a minor 0.2% m/m. We still look for further price declines down the road, on the back of the pent-up supply of newly produced flats.
Global macro and market themes
- Equity self-off is temporary, equities are still set to move higher in 3-12M.
- China has eased monetary policy but does not want the CNY to depreciate too quickly.
- The IMF has cut its global GDP growth forecasts slightly.
- Brexit optimism has led to an appreciation of the GBP.
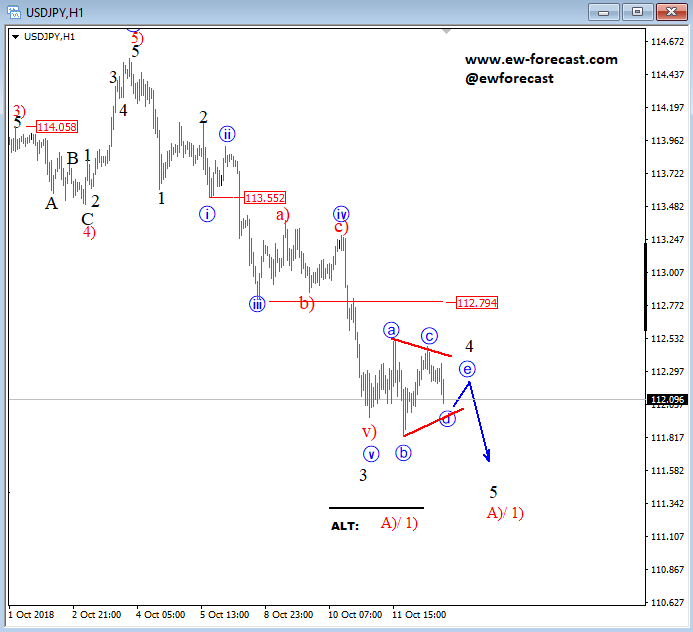
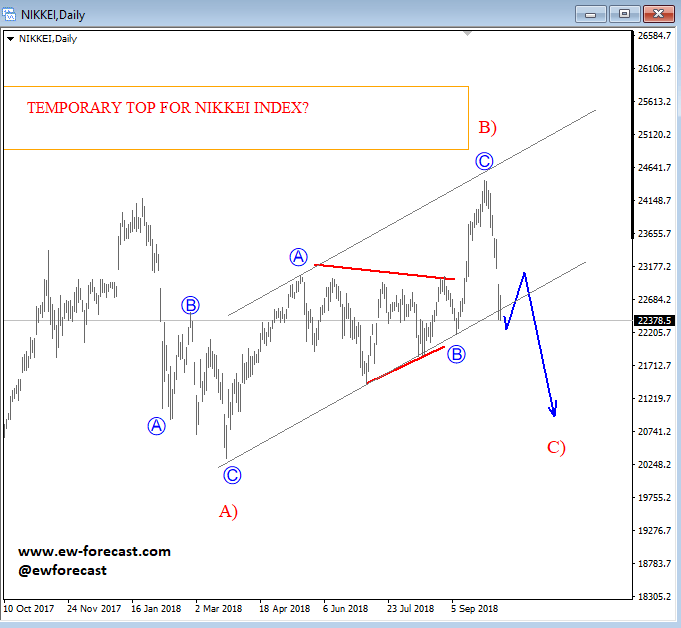
USDJPY and Nikkei225 Both Looking Bearish – Elliott wave Analysis
The stock market remains under pressure at the start of the US cash market, so USDJPY cannot break above 112.50 resistance. Therefore, I am looking for a triangle pattern which may cause another leg down soon into wave 5 of A)/1) towards 111.50. At the same time we see also Nikkei225 breaking below the channel support; decisive move through it would be very bullish for JPY next week.
USDJPY, 1h
Nikkei225, Daily
USDTRY Outlook: Lira Falls after Turkey Court Decision But Keeps Bullish Bias
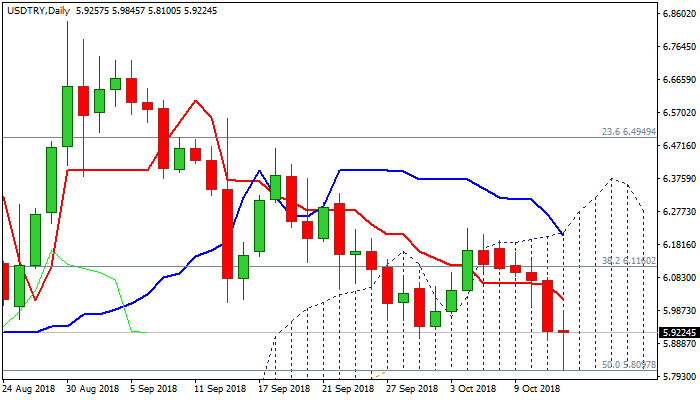
Turkish lira fell around 1.5% against dollar after news that Turkey's court released US pastor from prison. This scenario was widely expected, and market reaction was on ‘buy rumor – sell fact' mode as lira rose to the highest since mid-Aug in days prior to court decision and was sold after the verdict. Improvement in US – Turkey relations is now expected, which could further boost Turkish currency in coming days / weeks. The USDTRY pair holds in the downtrend for over one month, with lira being additionally supported by more radical action of Turkish central bank in September and the pair tested one of key supports at 5.8097 (daily cloud base) which resisted initial attack, but is expected to remain under pressure. Bearishly aligned daily techs add to pair's negative outlook. Eventual break below thick daily cloud would provide fresh bearish signal for test of next key support at 5.6875 (16 Aug low of pullback from new record high at 7.1043). Bear-cross of 10/55SMA's (6.0500) marks strong resistance which is expected to cap upticks and keep bearish bias.
Res: 5.9845; 6.0500; 6.0910; 6.1160
Sup: 5.8097; 5.6875; 5.5336; 5.5035
Friday Night Roundup from Singapore
Singapore: Monetary Authority of Singapore
The most important news from my neck of the woods, SGD rallied after the central bank continued on their path to normalise. MAS steepened just 0.5%-pts to 1.0% p.a, and this normalisation supports a bullish near-term view for SGD versus regional peers
Oil markets
Crude is off to a positive start in New York trade. Oil had a strong recovery in Asia as risk sentiment stabilised.
While oil prices were plagued by a massive unwind of riskier assets, we are still at the intersection that barrel losses due to Iranian sanctions and coupled with Venezuela shortcoming; the drops are too significant for OPEC to recompense.
But the emotional impact of equity market melting down with virtually every volatility gauge sending off alarm bells, it was a tough week to be an oil bull.
The IEA released their Monthly Oil Market Report, in which the agency cut its demand forecasts, but still sees prices as generally remaining at elevated levels supporting the bullish narrative
Gold markets
The precious complex is trading off the intersession highs as one would expect after the most significant jump in years. In reflection, the move was a combination of a haven and short covering momentum. But leaves the current landscape extremely shaky if both stocks and US rates markets recovered significantly in the days ahead
Fed Speak
Fed member Evans is speaking on CNBC and generating as some positive US dollar headlines but merely outline the recent Fed communique, but dollar bulls are eating it up none the less
*EVANS: SLIGHTLY RESTRICTIVE MAY MEAN 50 B.P.S. ABOVE NEUTRAL
*EVANS: JOBLESS RATE HEADING TO 3.5% SO NEED TO BE ABOVE NEUTRAL
The message is loud a definite; however, even in the absence of inflation, the current employment levels suggest nudging into restrictive policy would be appropriate. Music to the USD’s ears and support my consensus EUR lower given the Italy risk. Continue to favour selling into short positions squeezes like what happened in early London
University of Michigan Survey
USD trades a bit firmer in the wake of the latest University of Michigan Sentiment survey, despite its softer results: the index declined from 100.1 to 99.00 versus 100.5 expected. But markets are focusing on the inflation expectations which notched up . 1 % in one year frame while .2 % in the 5 to 10-year forecast
Global Equity Markets
Bottom picking can be a dangerous past time.
It’s amazing how quick everyone is seizing on today market stability to suggest that equities have bottomed out. We have seen a convincing rebound on Asia market sentiment helped by reports overnight that Mnuchin may not name China as a currency manipulator. Still, given how fragile market sentiment has been, let’s leave the nonsense of bottom picking to the experts, cognoscenti’s and pundits. But given the intraday volatility its next to impossible to say the “lows are in.”And while the worst appears to be behind us, it’s always tricky to determine if this is the calm before the storm or we’re merely in the eye of the hurricane. But ultimately where US bond yields settle will be the next significant signal for equity investors.
Still, there’s a lot is riding President Trump accepting the US Treasury currency report at face value. But President Trump has been unwavering in this about China exchange rate regime. And given the unpredictable nature of the commander-in-chief does raise the level of uncertainty. And who is to say he won’t go rogue on the US Treasury if he doesn’t like what he hears and labels them as coco locos? Just saying!
If you thought this week was madness, next week wouldn’t be a walk in the park with US Treasury report, Fed meeting minutes, the possibility of a Brexit deal, Eurozone final CPI and Italy’s deadline to submit the draft budget to the EC. Now, what possibly could go wrong with everyone still flying by the seat of their pants.
Sunset Market Commentary
Markets
Global core bonds are little changed from yesterday with general risk sentiment stabilizing. German Bunds fell lower at openings as it played catch-up with the overnight movements in US Treasuries, but paired the losses throughout the day to even gain some ground. Treasuries first lost some ground but are currently trading at negligible losses. Global core bonds mirrored sentiment on equity markets. European indices recovered from losses in the last couple of days and edged up with modest gains ranging around 0,5%. US equity futures hinted a continuation of that sentiment and eventually opened in dark green. After Trump lashed out at the Fed, Treasury Secretary Mnuchin said Fed chairman Powell is doing a good job. He sees normalization in the yield curve. EU-Italy bickering continued. European Commission President Juncker said Italy is not keeping its word and that the country already received some “flexibility” from the Commission. Italian BTP futures gain some ground. The German yield curve edges lower. Yield changes range from -1.4 bps (30-yr) to -2.0 bps (5-yr). US yield curve moved north but remained close to unchanged. Moves range from +0.45 bps (20-yr) to +0.7 bps (30-yr). Italian 10-yr spread vs Germany closes 2 bps. Portuguese (+ 3bps) and Spanish (+4 bps) spreads widen over Germany.
This morning, Asian equities rebounded and European equities entered calmer waters, too. Eco data were second tier had hand no big impact on global FX trading. Of late, the status of the dollar in the global FX framework become a bit misty. The dollar wasn’t able anymore to play its safe haven role as higher US yields triggered an outright risk off correction on global markets, including on US equities. In this context, what will be the reaction function of the dollar in case of risk-on rebound (or in case of further turbulence). Markets clearly haven’t found out yet. EUR/USD tried to regain the 1.16 barrier this morning, but the move stalled. The pair settled in the upper half of the 1.16 big figure. The dollar gained some traction as US traders got involved. US bank earnings published today mostly were stronger than expected. Fed Evans in an interview indicated that the Fed interest rate approach remains on track and that raised might need to be raised above neutral. A solid equity performance and the Evens’ comments are slightly USD supportive. EUR/USD trades in the 1.1560 area. USD/JPY hovers in the lower half of the 112 area.
Recently, there were ever more rumours that the UK and EU were very close to reaching a Brexit deal, including some kind of backstop for the issue of the Irish border. The hope on a Brexit deal before October 17 EU summit triggered a cautious comeback of sterling. EUR/GBP dropped to the 0.8725 area earlier this week. Yesterday and today, the rally slowed. Headlines on a possible deal persisted, but the risk of discord within May’s government returned to the forefront, preventing further GBP-gains. This debate whether the glass is half empty rather than half full will probably continue into this weekend. In this context of lingering uncertainty, the rebound of sterling stalled. EUR/GBP trades currently in the 0.8765 area. Cable hovers near the 1.32 pivot
News Headlines
In the wake of recent comments from President Trump on monetary policy, Chicago Fed’s Evans said he is looking at a very strong economy, strong fundamentals and that the Fed is adjusting the policy stance. Evans said that the Fed may need to raise the policy rate 50 bps above neutral. He estimates neutral rate to be in the 2.75%-3.0% area.
Andrew Branson, the US pastor that has been detained in a Turkish prison cell for the last months, was convicted by a court, but is freed on time served in Turkey. The Turkish lira rallied already earlier today as officials had indicated that a positive outcome was possible. EUR/TRY trades currently in the 6.83 area.
Fed Evans: With procyclical fiscal policy and a very strong economy, interest rates might have to go above neutral
Chicago Fed President Charles Evans reiterated his stance that interest rate might have to go to a bit restrictive. He said in a CNBC interview that "after many, many years of accommodative policy, which I have supported strongly because inflation's now up at 2 percent, it's time to readjust the policy stance at least to neutral." Then, "let's see how the economy is performing at that point and then we might have to do a little more after that."
He further explained that "I would say that with the unemployment rate headed to three and a half percent, we're in a more normal environment where an accommodative stance of policy, when we've got procyclical fiscal policy and a very strong economy, we probably need to be a little bit on the above-neutral side, but I don't know that we need to be a lot."
EURUSD Outlook: Fresh Risk Appetite Pushes Euro Back into Daily Cloud
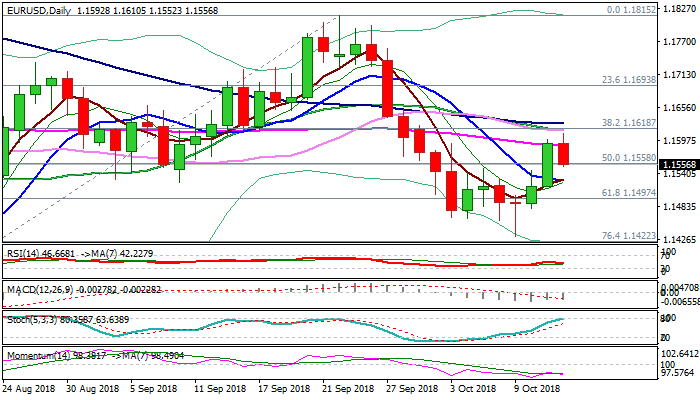
The Euro enters American session in negative mode and returned into daily cloud after failing to hold gains above daily cloud top / 55SMA (1.1574/90) and stalled on approach to converged 20/30SMA's at 1.1615, as trong EU industrial production and German CPI, in line with expectations, released earlier today, failed to boost Euro. Fresh risk appetite lifted dollar, with profit-taking of strong rally in past two days, adding to renewed pressure on the single currency. Fresh easing weakened near-term structure and increasing risk of return and close below daily cloud, which would generate bearish signal. Daily momentum turned lower and created bear-cross, softening daily techs, which are still in mixed mode. Friday's close below daily cloud would turn near-term bias lower and risk further weakness. Bullish scenario requires close above cloud to keep focus at the upside.
Res: 1.1574; 1.1590; 1.1618; 1.1627
Sup: 1.1545; 1.1529; 1.1518; 1.1479
USD/JPY Mid-Day Outlook
Daily Pivots: (S1) 111.82; (P) 112.18; (R1) 112.53; More...
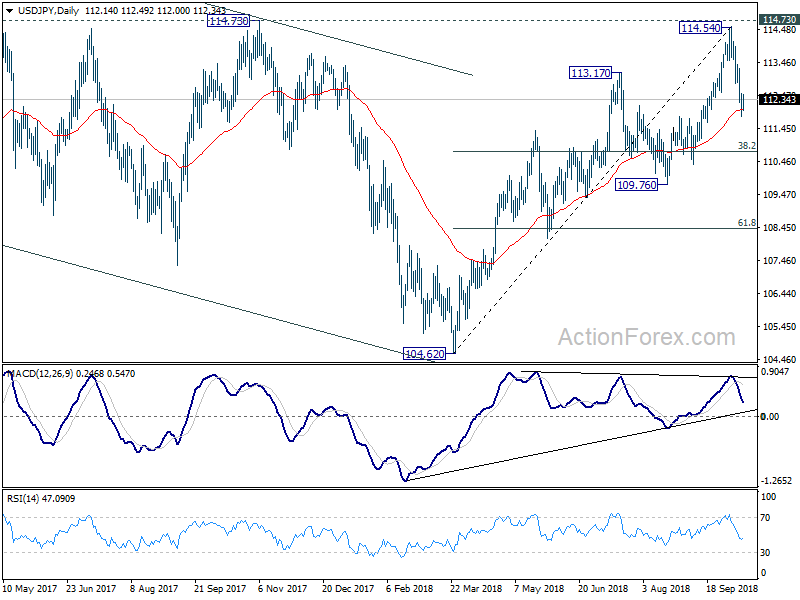
Intraday bias in USD/JPY remains neutral for consolidation above 111.82 temporary low. Further decline is expected as long as 113.28 resistance holds. Fall from 114.54 is seen as correcting whole up trend from 104.62, after rejection by 114.73 resistance. Below 111.82 will target 38.2% retracement of 104.62 to 114.54 at 110.75. We'll look for bottoming signal above 109.76 key support.
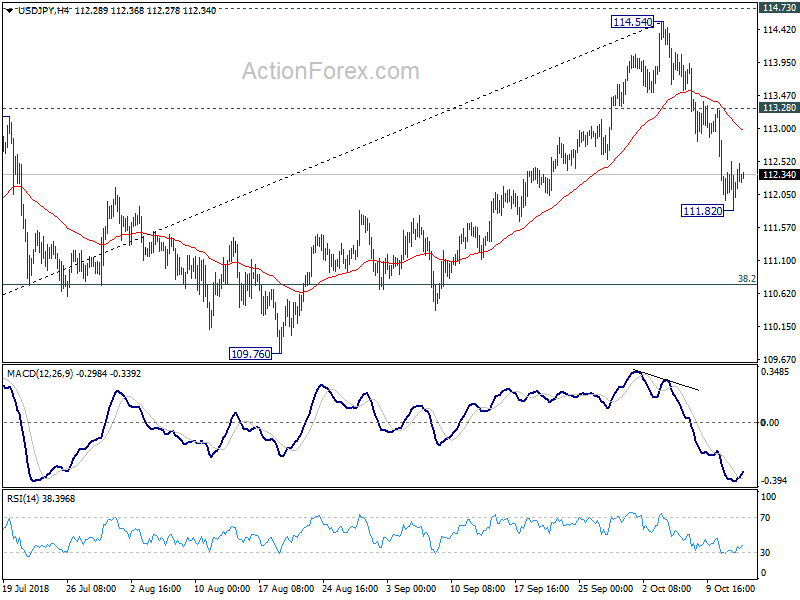
In the bigger picture, corrective fall from 118.65 (2016 high) should have completed with three waves down to 104.62. Decisive break of 114.73 resistance will likely resume whole rally from 98.97 (2016 low) to 100% projection of 98.97 to 118.65 from 104.62 at 124.30, which is reasonably close to 125.85 (2015 high). This will stay as the preferred case as long as 109.76 support holds. However, decisive break of 109.76 will dampen this bullish view and turns outlook mixed again.