

Sample Category Title
EUR/AUD Weekly Outlook
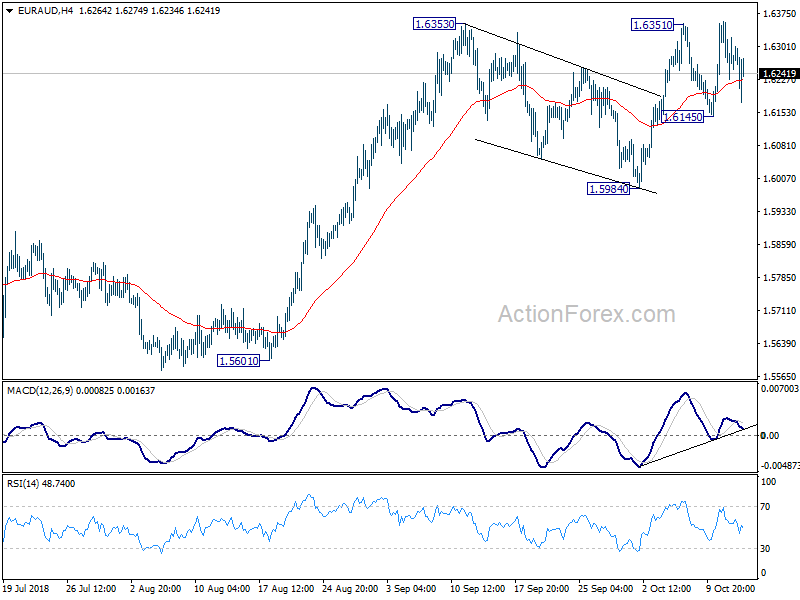
EUR/AUD had another attempt at 1.6353 last week but failed again. Initial bias stays neutral this week first. On the upside, sustained break of 1.6353 will resume larger up trend and target 1.6587 key resistance next. On the downside, however, break of 1.6145 support will likely extend the corrective pattern from 1.6353 with another leg back to 1.5984.
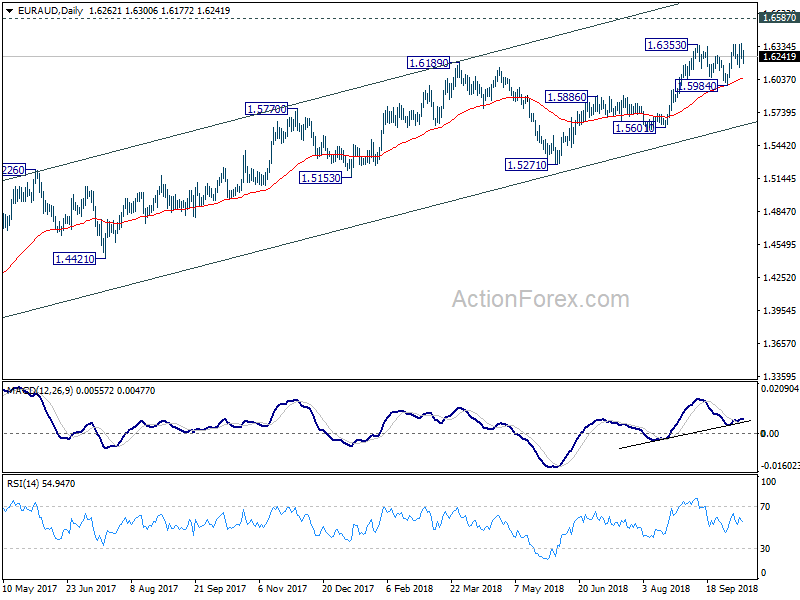
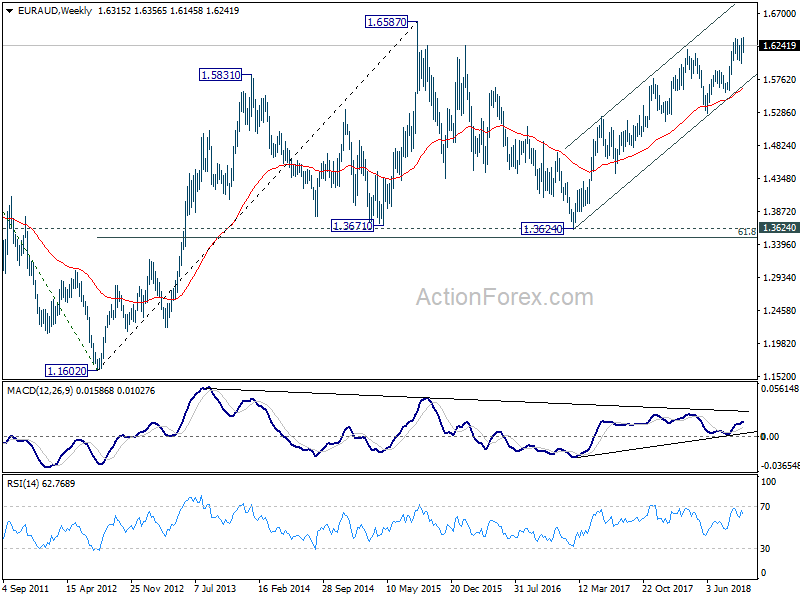
In the bigger picture, up trend from 1.3624 (2017 low) is still in progress. Further rise should be seen to retest 1.6587 (2015 high). Decisive break there will resume the long term rally and target 1.7488 fibonacci level. On the downside, break of 1.5984 support is need to be the first sign of medium term reversal. Otherwise, outlook will remain bullish in case of deep pull back.
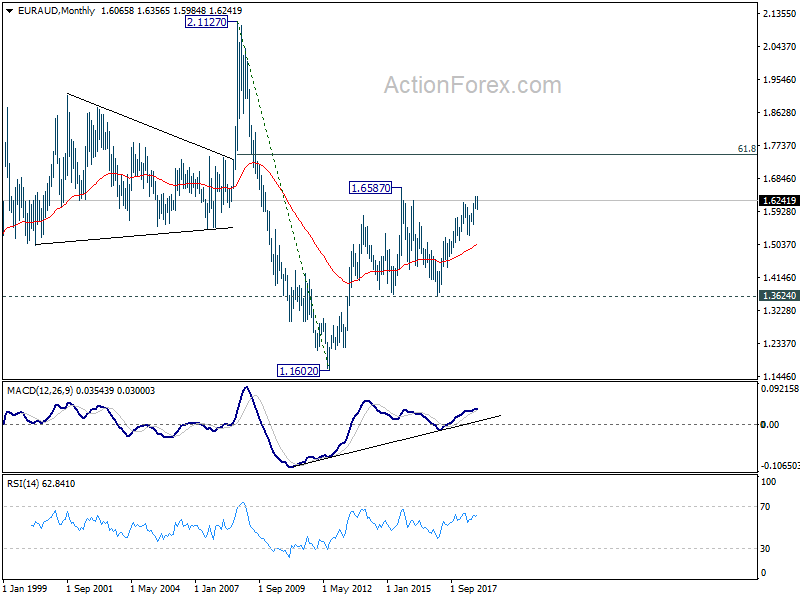
In the longer term picture, the rise from 1.1602 long term bottom (2012 low) isn't over yet. We'll keep monitoring the development but there is prospect of extending the rise to 61.8% retracement of 2.1127 to 1.1602 at 1.7488 and above. However, sustained trading below 1.3624 key support should indicate long term reversal and target 1.1602 long term bottom again.
EUR/CHF Weekly Outlook
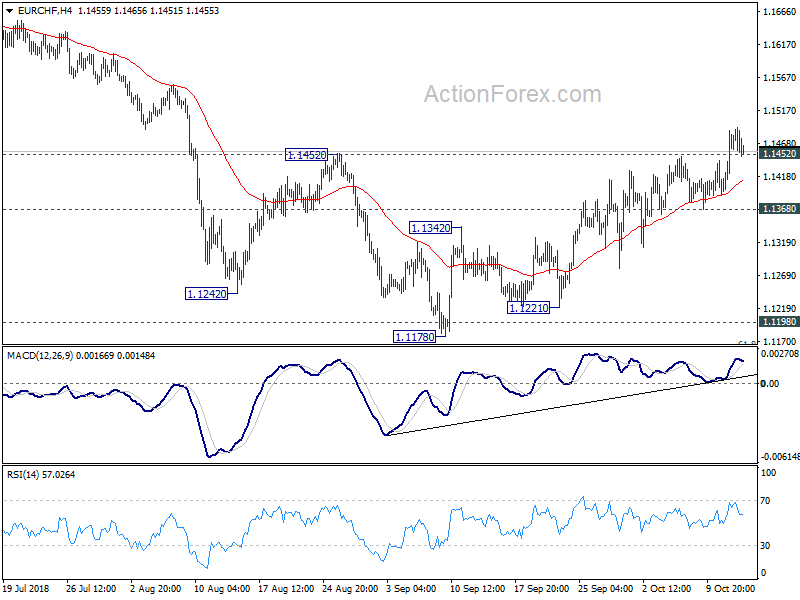
EUR/CHF's break of 1.1452 resistance last week affirms the case of bullish trend reversal after being support from 1.1154/98 zone. Initial bias stays on the upside this week for 1.1713 resistance for confirmation. Break there will target a test on 1.2004 high next. Meanwhile, note that upside momentum is not to convincing so far. Break of 1.1360 minor support will argue that the rebound has completed and turn bias back to the downside for 1.1154/98 zone again.
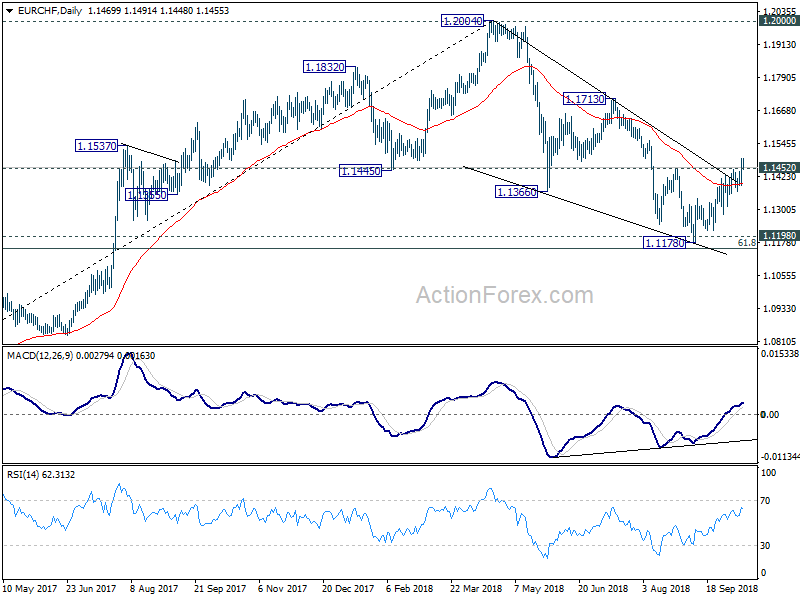
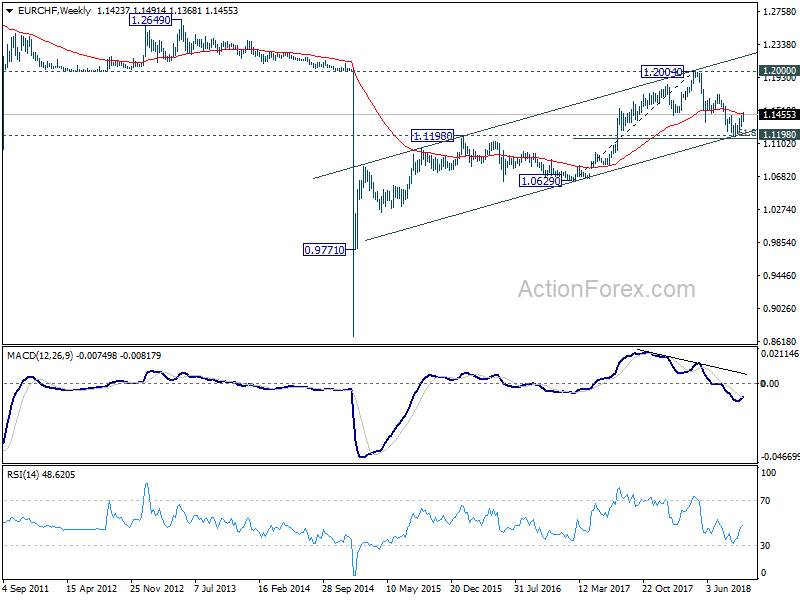
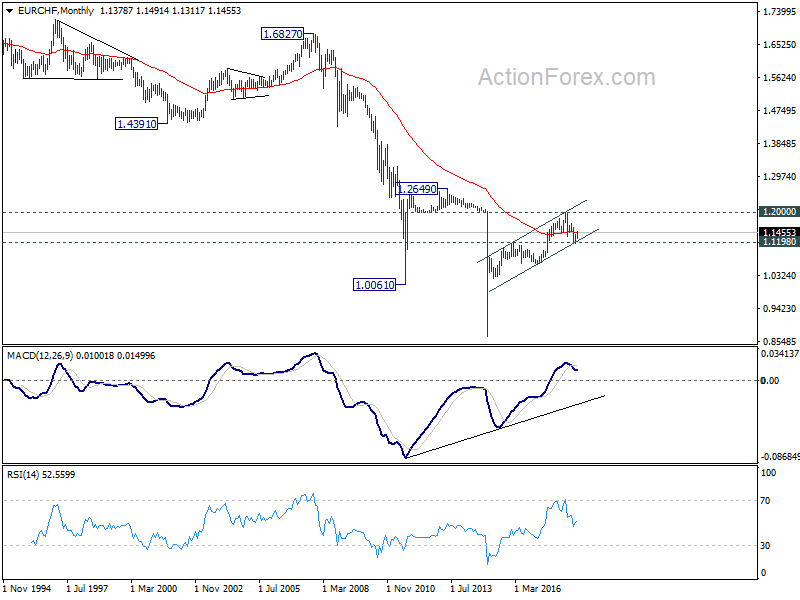
In the bigger picture, price actions from 1.2004 medium term top is seen as a correction only. Downside should be contained by support zone of 1.1198 (2016 high) and 61.8% retracement of 1.0629 to 1.2004 at 1.1154 to complete it and bring rebound. This cluster level is in proximity to long term channel support (now at 1.1234) too. A break of 1.2 key resistance is still expected in the medium term long term. However, sustained break of the mentioned support zone will mark reversal of the long term trend. In that case, 1.0629 key support will be back into focus.
Conditions Still in Place for Further Dollar Rally Despite Trump’s Crazy Fed Attack
Global stock market crashed last week as the US finally joined the others. It should be reminded that as DOW made record high in early October, all other major markets suffered selloff already. It's stretched to blame rising US treasury yields as a factor as it's easy to see that yields haven't took out prior week's high before US stock market crash. To put the blame of the selloff on Fed is even more far-fetched. Just look at what happened. DOW enjoyed only a brief recovery when US released tamer than expected CPI reading on Thursday. US indices then ended another day in deep red. After all, the world is so interconnected that what goes around will almost certainly comes around. IMF's downgrade of global growth forecasts is a proof of the impact of trade tensions started by the US, as also reflected in deteriorating German and Japanese investor sentiments. Such deterioration just went back to haunt the US and will continue to do so.
In the currency markets, Dollar ended the week broadly lower, except versus Canadian, after Trump attack the Fed as going crazy, wild, loco for rate hikes. Though, the greenback reclaimed some ground with a general consensus that Fed will continue with its professional world based on economic data, and ignore the ignorable. Swiss Franc was the third weakest despite risk aversion. Gold looked like the better safe haven asset. Yen ended the week as the strongest one, which was rather natural based on risk averse sentiments. But in a rare development, New Zealand Dollar was the second strongest, Australian the third.
As we discussed below, investors have just slightly pared back bets on Fed's rate hikes despite Trump's crazy attack on Fed. The retreats in US treasury yields are seen as nothing more than retreats in up trend. Such developments will continue to support Dollar and give it the strength for another rally eventually. Meanwhile, Euro will be weighed down, relative to Dollar, on sluggish German yield, which Italy is a constant drag. US stocks have entered into medium term correction and risks will continue to stay on the downside despite some interim recoveries, in tandem with global stocks. Japan 10 year JGB yield, currently at 0.15, would continue to find it very hard to move further away from BoJ's allowed band of -0.1 to 0.1%. But risk aversion, in particular in Asia, could help support the Yen.
Markets pare back bet of 2019 hikes, but still more aggressive than a month ago
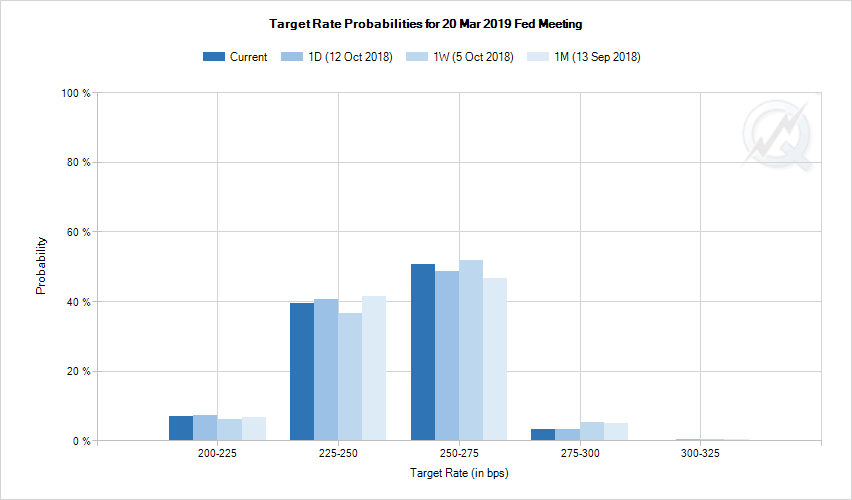
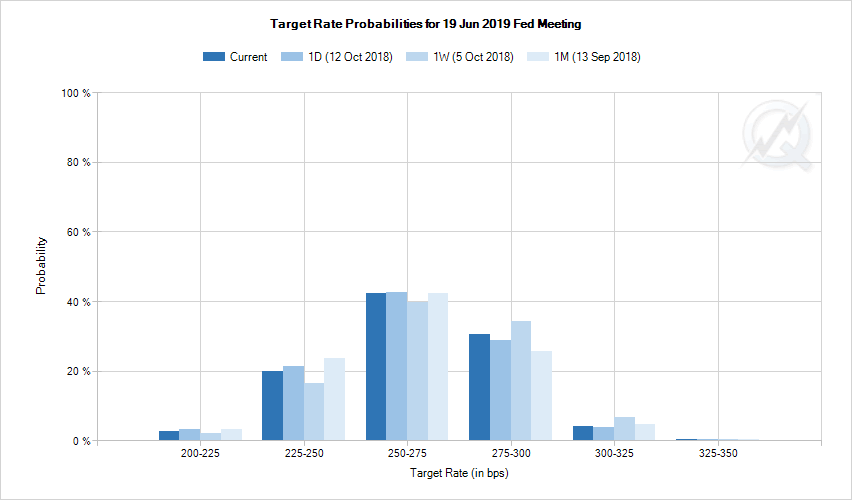
Let's have a look at fed funds futures first. After Trump's attacked on Fed and tamer than expected inflation reading, markets are paring some bets on Fed's rate hikes next. But still, they remained relatively firm comparing to a month ago.
For March 2019, fed fund futures are pricing in 53.7% chance of two more hikes from now to 2.50-2.75%. That's slightly lower than 57.1% a week ago but remained above 51.7% a month ago.
For June 2019, fed fund futures are pricing in 35.3% chance of another hike to 2.75-3.00%. That's also slightly below 41.2% a week above but remained above 30.4% a month ago.
For September 2019, fed fund futures are pricing in 16.6% change of yet another hike to 3.00-3.25%. That compares to 23.3% a week ago and 13.8% a month ago.
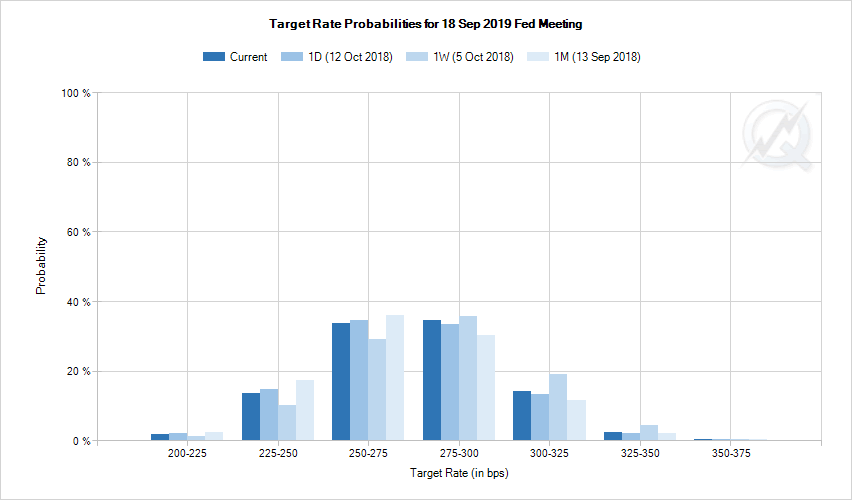
We read that investors are relatively sure on Fed's continuing of rate hike till hitting neutral zone. But beyond that, they're not committing yet.
30-year yield and 10-year yield stay in up trend despite retreats
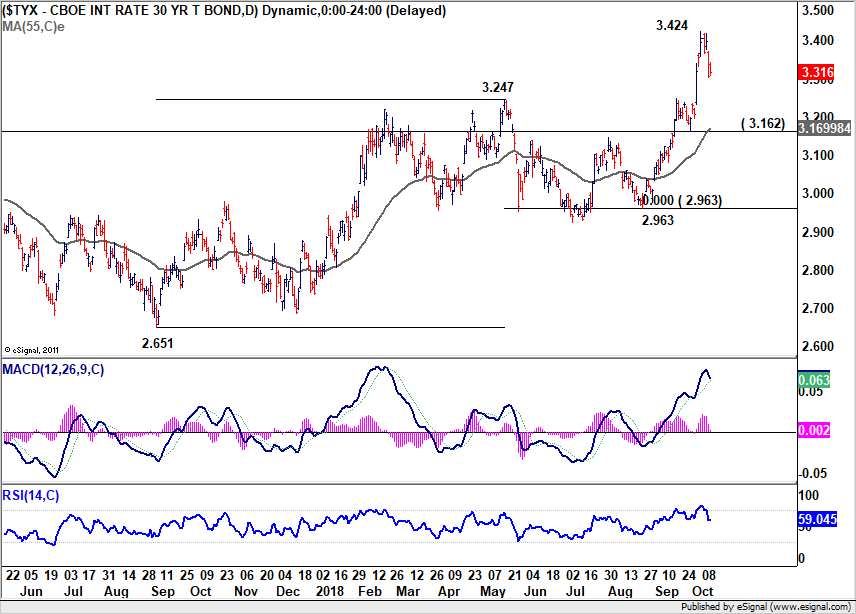
Now, let's have a look at treasury yields. 30 year yield suffered quite a steep retreat after hitting 3.424. But so far, there is no clear sign of topping in TYX yet. It's kept well above 3.247 resistance turned support. There is no divergence seen in daily MACD nor RSI. Current price structure suggests that rise from 2.925 is in an acceleration phase. Overall, as long as 3.162 support holds, we'd expect further rally in TYX to 100% projection of 2.651 to 3.247 from 2.963 at 3.559 in near term.
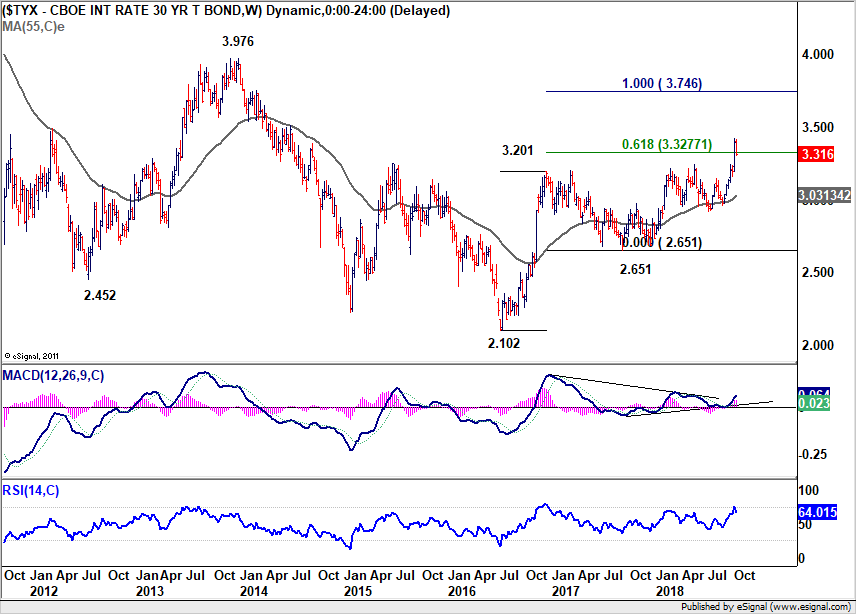
In the larger picture, TYX has just drew strong support from 55 week EMA. Some resistance is seen after hitting 61.8% projection of 2.102 to 3.201 from 2.651 at 3.327. But weekly MACD suggests that it's actually building upside momentum again. So, there is no clear sign of topping. And we'd expect TYX to target 100% projection of 2.102 to 3.201 from 2.651 at 3.746 in medium term.
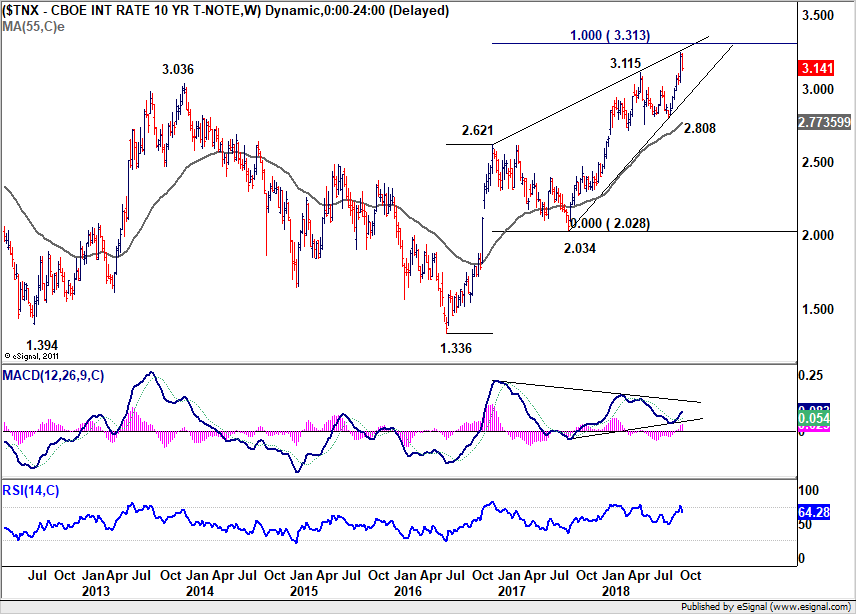
The picture in 10 year yield is a bit tricky. And, that's why we presented the view on TYX first for better comparison. One might argue that firstly, TNX is facing strong resistance from the upper trend line. Bearish divergence is also seen in weekly MACD. And most importantly, it looks like rise from 2.808 is the fifth wave from 1.336. So there is risk of a major top.
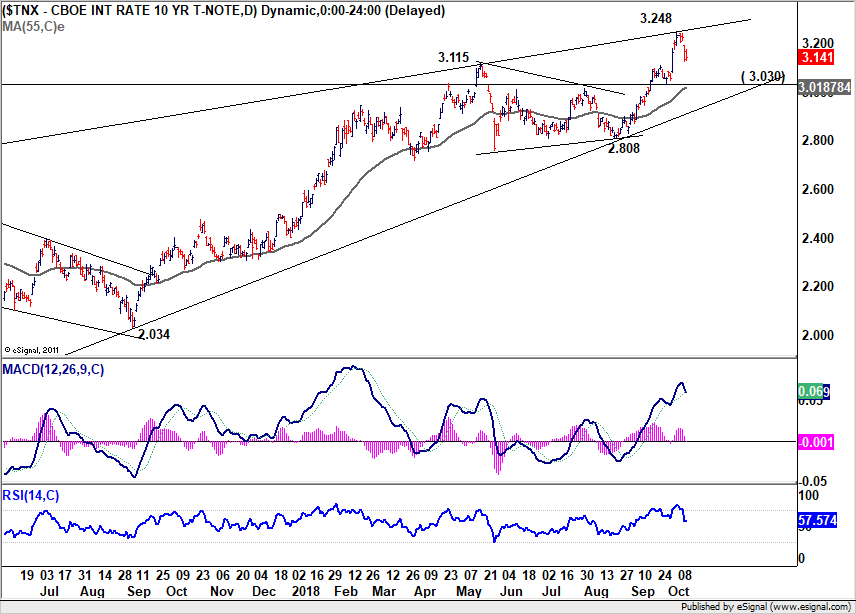
It's actually quite tempting to view it in the above bearish way. However, we'd like to point out that TNX's consolidation from 3.115 to 2.808 is equivalent to TYX's consolidation from 3.247 to 2.963. Rise from 2.651 to 3.247 is definitely not the third wave from 2.102. And TYX has already negated bearish divergence in weekly MACD. Therefore, rise from 2.808 is unlikely the fifth wave in TNX. Rally in TYX could instead help pull TNX through 100% projection of 1.336 to 2.621 from 2.034 at 3.313. And this will remain the favored case as long as 3.030 near term support holds.
So, overall, we haven't seen the end of up trends in US treasury yields yet.
S&P 500 in medium term correction, more downside after interim consolidations
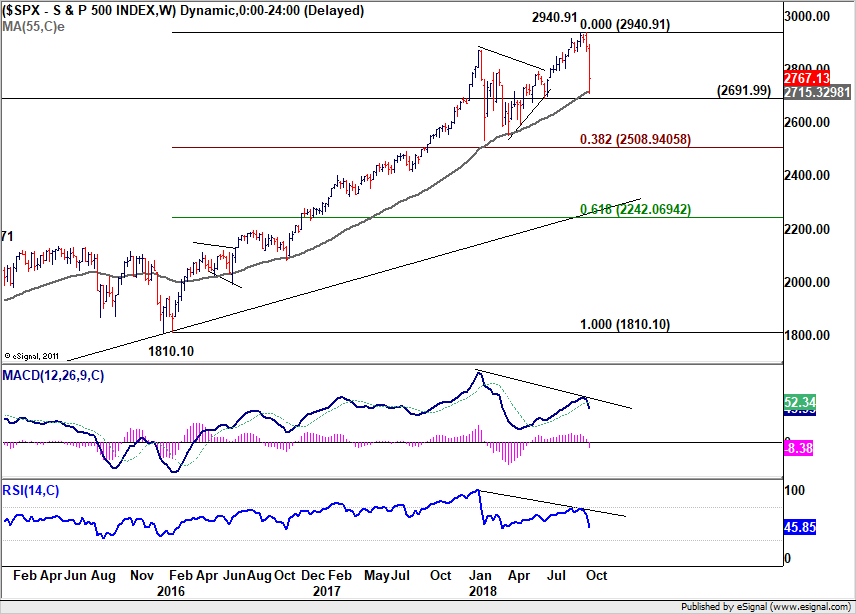
Now, let's have a look at stocks. While we expected pull back in global equities, it was actually much worse than we've anticipated a week ago. And the development is very bearish. In a bearish yet not the worst view, S&P 500 has completed a five way up trend from 1810.10 to 2940.91. There was a beautiful wave four triangle that completed at 2691.99 and followed by a short wave five to 2940.91. Bearish divergence conditions appear in both weekly MACD and RSI. So, S&P 500 is now correcting the up trend from 1810.10 to 2940.91.
Initial support was seen after touching 55 week EMA and slightly above 2691.99 structure support. Some consolidations would now be seen but that should be relatively brief. We'd expect another fall soon that would send SPX to 38.2% retracement of 1810.10 to 2940.91 at 2508.94, to complete the first leg of a long term corrective pattern. That is, the worst in US stocks is far from being over.
DAX could break 11405 fibonacci level to 10888 before bottoming
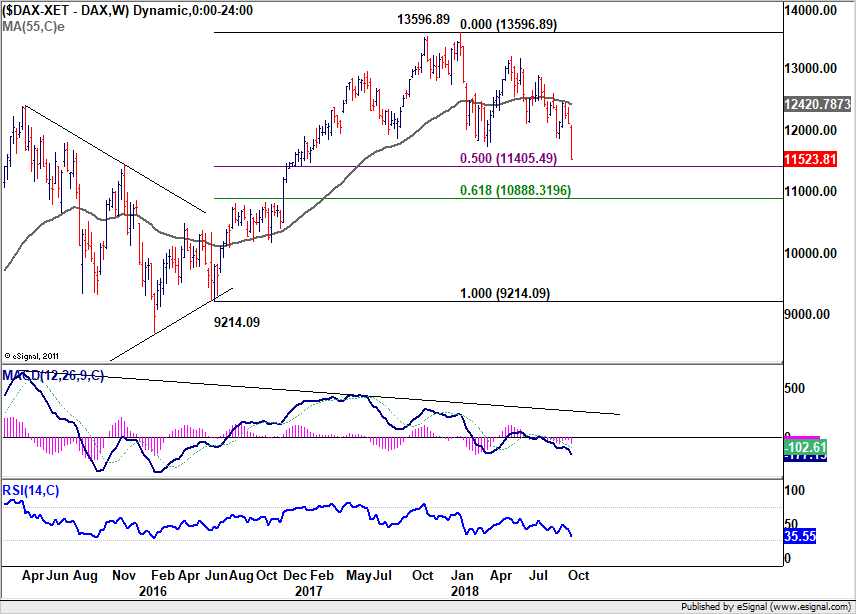
DAX's strong break of 11726.62 support last week confirmed resumption of the medium correction from 13596.89. In a less bearish scenario, DAX is now correcting the up trend from 9214.09 only. Based on current downside momentum, 50% retracement of 9214.09 to 13596.89 at 11405.49 should be taken out with relative ease. Strong support could only be found at around 61.8% retracement at 10888.31.
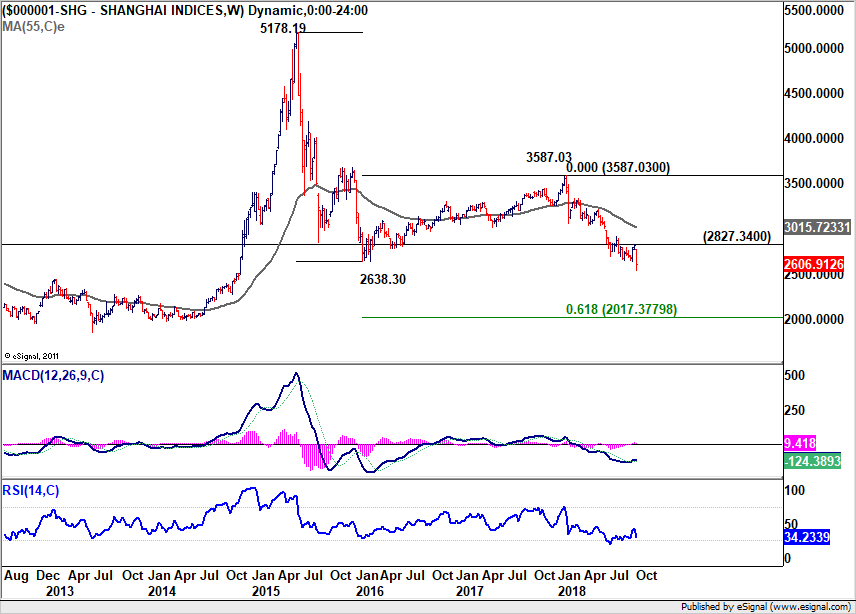
Shanghai SSE broke 2638.30 key support, resumed long term down trend
China Shanghai SSE has suffered steep selling despite PBoC's measures to stabilize the markets. Key support level at 2638.30 (2016 low) was taken out. Downside risks are rather heavy if SSE cannot reclaim 2638.30 soon. But even so, outlook will stay bearish as long as 2827.34 resistance holds. Barring any government intervention (which is impossible to predict in a closed market with authoritarian government), the down trend should extend to 61.8% projection of 5178.19 to 2638.30 from 3587.03 at 2017.37, which is close to 2000 psychological level, in medium to long term.
Dollar index retreated well ahead of 96.98 high, drawing support from 55 day EMA
Now, back to Dollar index, It retreated quite notably last week and it's now trying to draw support from 55 day EMA. For now, as long as 55 day EMA holds, we'd expect rebound from 93.81 to extend to retest 96.98 high. But we'd also maintain our view that there is not enough evidence to suggest up trend resumption yet. Hence, we'd be cautious on topping below 96.98 high. And the level is equivalent to 1.1300 bottom in EUR/USD.
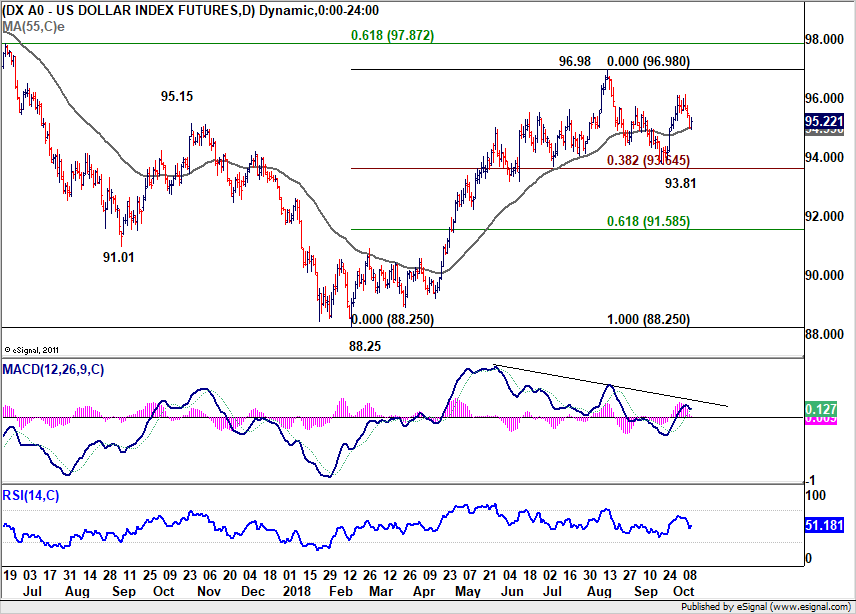
On the downside, sustained trading below 55 day EMA might indicate completion of the rebound from 93.81. That would extend the consolidation pattern from 96.98 with another falling leg. But again, the range of the consolidation should have been set already. That is, another downside attempt should be contained by 38.2% retracement of 88.25 to 96.98 at 93.64, which is also close to 55 week EMA.
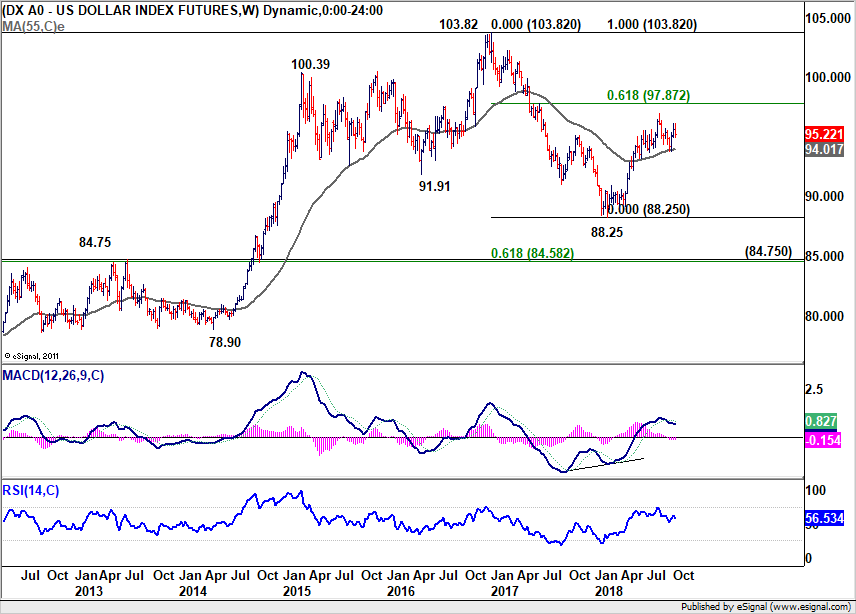
Overall, there is no deviation from our view last week. An eventual upside break out in Dollar index is expected. It's just a matter of time.
Position trading strategy
We've reinstated our AUD/USD short strategy last week as China's PBoC measures didn't trigger much movements in the markets. AUD/USD short was entered at 0.7100 as the consolidation from 0.7040 extended. The position is last updated in this post, and you can trace back the updates from there.
The position is actually quite a disappointment to us. Global stocks tumbled, far worse then we expected. Chinese stocks even broke a key support level. But AUD/USD basically didn't move at all. Looking back, it could be partly because AUD/USD was oversold in the prior week. And, some traders might start to rethink how far monetary policy divergence between Fed and RBA would extend to. But as we analyzed above, we' continue to expect further rise in US yield and decline in global stocks. Thus, the conditions are still there for more decline in AUD/USD.
Technically, the corrective price actions from 0.7040 also affirmed our bearish view. So, we'll hold on to the short position for now. The consolidation could have completed at 0.7139 with late Friday decline. But it's not necessary to rush into such conclusion. Hence, we'll keep the stop unchanged at 0.7185, slightly above 50% retracement of 0.7314 to 0.7040 at 0.7178.
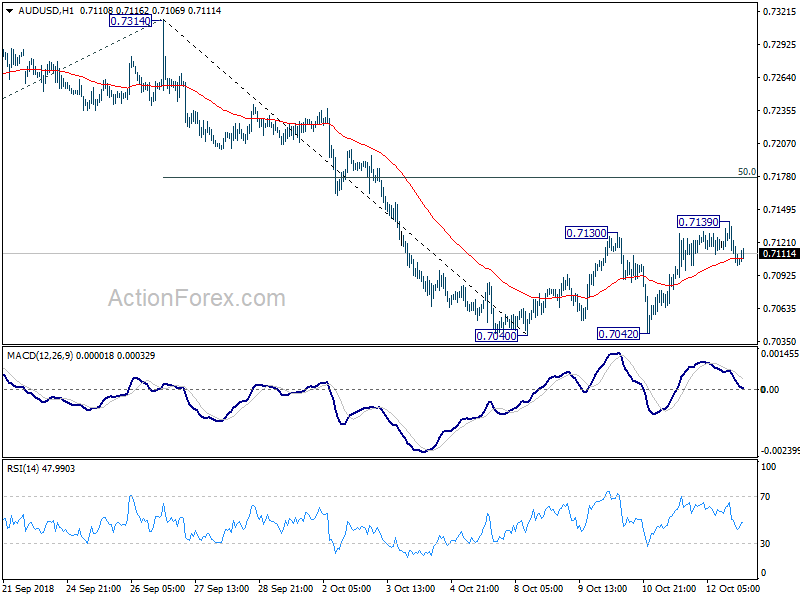 Our overall view is unchanged that medium term fall might be resuming long term down trend from 1.1079. Whether this more bearish view is right or wrong, there is realistic prospect of a test on 0.6826 low. The next move, after break 0.7040, should reveal how much downside momentum AUD/USD is having. And by then, we should be able to determine whether to exit the position around 0.6826 low, or hold it through.
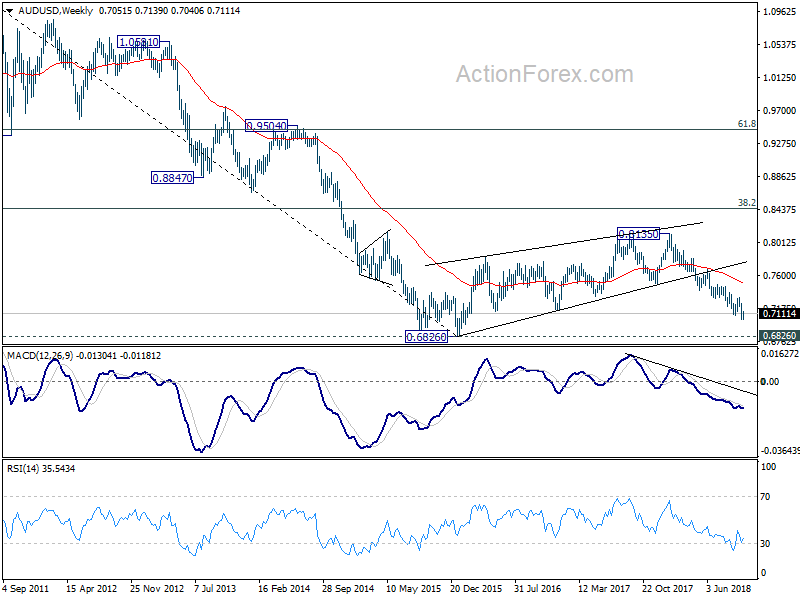
So to summarize, hold short with stop at 0.7185, target to be determined later.
We'd refrain from adding other position first.
EUR/USD Weekly Outlook
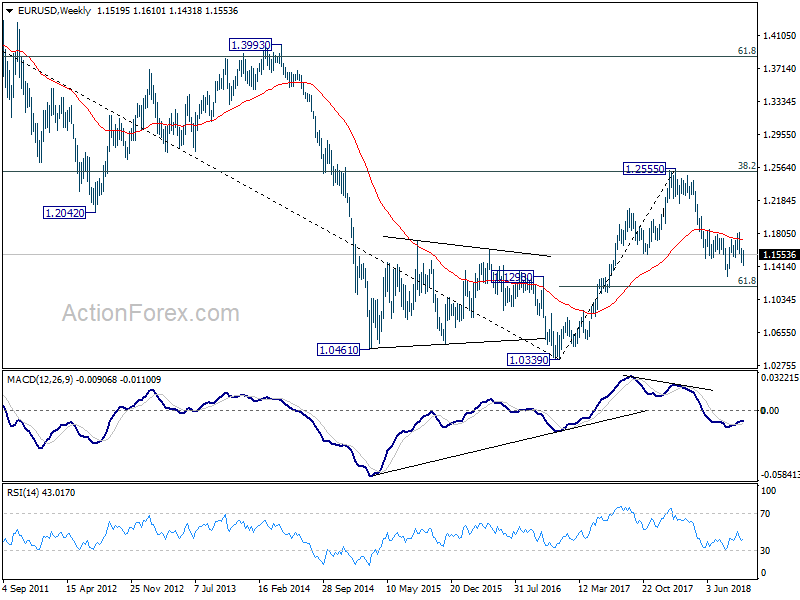
EUR/USD edged lower to 1.1431 initially last week but then recovered to 1.1610 before losing momentum after that. Initial bias remains neutral this week first. Another rise cannot be ruled out as long as 1.1534 minor support holds. Above 1.1610 will target 1.1814 resistance. But we'd expect upside to be limited by 1.1779/1814 resistance zone to bring down trend resumption eventually. On the downside, below 1.1534 minor support will indicate completion of rebound from 1.1431. Intraday bias will be turned back to the downside for 1.1431 and then 1.1300 low.
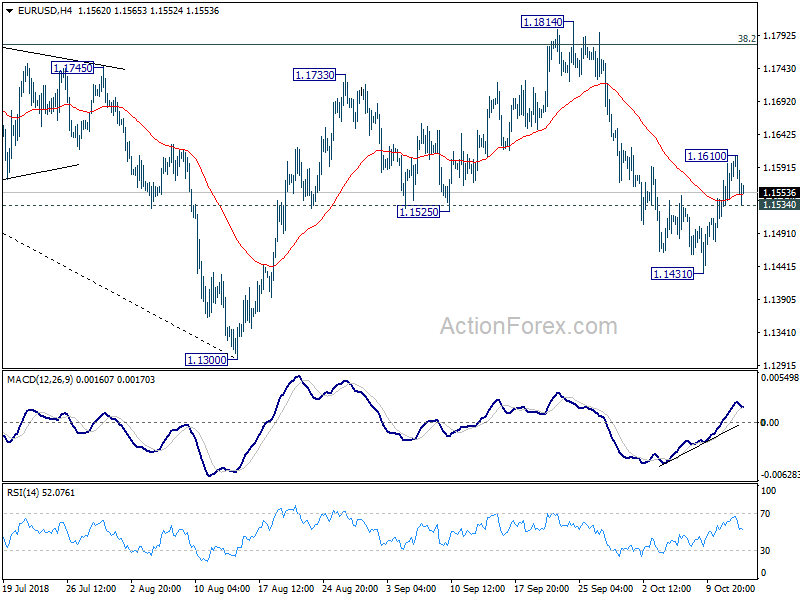
In the bigger picture, corrective pattern from 1.1300 could have completed at 1.1814 after hitting 38.2% retracement of 1.2555 to 1.1300 at 1.1779. Decisive break of 1.1300 will resume the down trend from 1.2555 to 61.8% retracement of 1.0339 (2017 low) to 1.2555 at 1.1186 next. Sustained break there will pave the way to retest 1.0339. On the upside, break of 1.1814 will delay the bearish case and extend the correction from 1.1300 with another rise before completion.
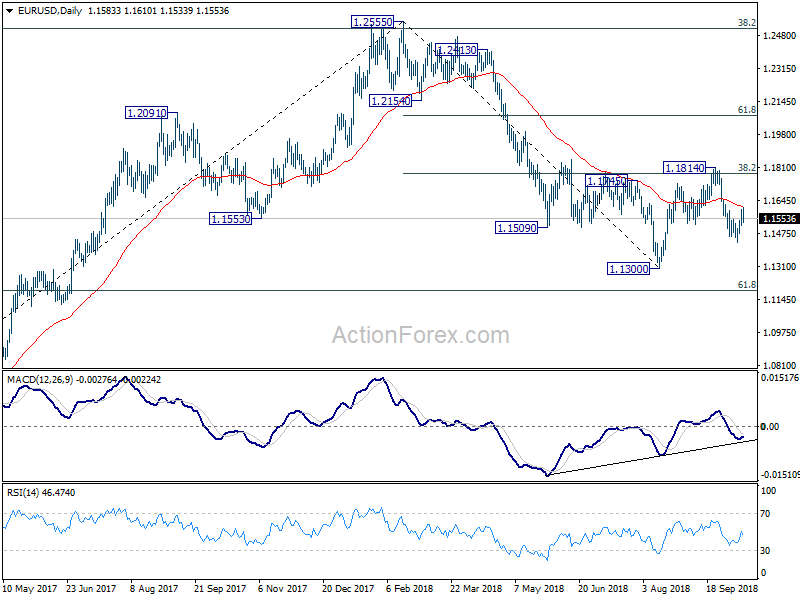
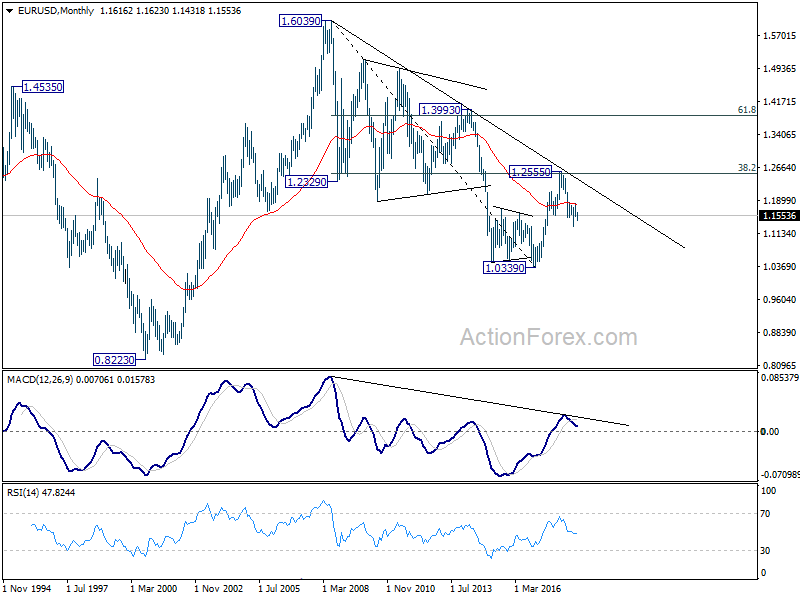
In the long term picture, the rejection from 38.2% retracement of 1.6039 to 1.0339 at 1.2516 argues that long term down trend from 1.6039 (2008 high) might not be over yet. EUR/USD is also held below decade long trend line resistance. Firm break of 61.8% retracement of 1.0339 to 1.2555 at 1.1186 should at least bring a retest on 1.0339 low.
Summary 10/15 – 10/19
Monday, Oct 15, 2018
[php_everywhere instance="1"]
Tuesday, Oct 16, 2018
[php_everywhere instance="2"]
Wednesday, Oct 17 2018
[php_everywhere instance="3"]
Thursday, Oct 18, 2018
[php_everywhere instance="4"]
Friday, Oct 19, 2018
[php_everywhere instance="5"]
Weekly Economic and Financial Commentary: September Inflation Keeps Fed on Track
U.S. Review
September Inflation Keeps Fed on Track
- While most of the fresh September inflation data came in more or less as we had expected, higher oil prices and recently enacted tariffs have caused us to increase our outlook for inflation.
- Due to the nature of the increase stemming from a one-time upward level shift in prices, we still see the Fed on track to raise rates once a quarter through Q3-2019.
- Producer prices rose 0.2%, while consumer prices were up a more modest 0.1%. A surge in petroleum prices caused import prices to rise 0.5% in September.
September Inflation Keeps Fed on Track
It was a quiet week in terms of economic data, but we did receive fresh September data for three inflation measures, the producer price index (PPI), the consumer price index (CPI) and the import price index. While most of the data came in more or less as we had expected, higher oil prices and recently enacted tariffs have caused us to increase our outlook for inflation. Due to the nature of the increase, we still see the Fed on track to raise rates once a quarter through the third quarter of 2019.
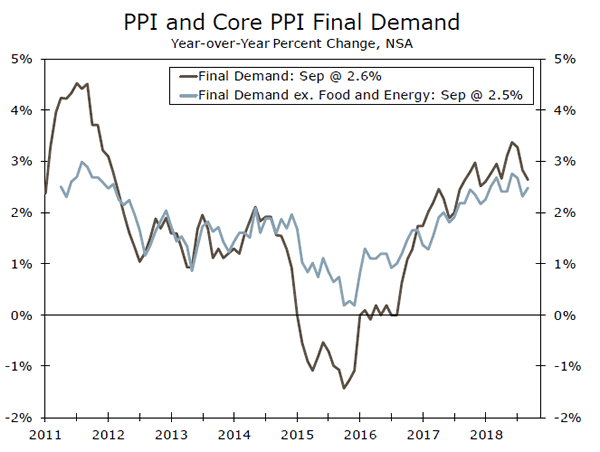
Producer prices rose 0.2% in September, but moderated to 2.6% on a year-over-year basis (top chart). The gain was led in large part by services, up 0.3% over the month, as transportation & warehousing prices rose a whopping 1.8%. This caused our preferred measure of core inflation, which excludes food, energy and trade services, to grow a larger-than-expected 0.4%. Over the past 12 months, however, "core-core" remained at 2.9%. With input prices running ahead of final prices, consumer price inflation will likely continue to gradually rise.
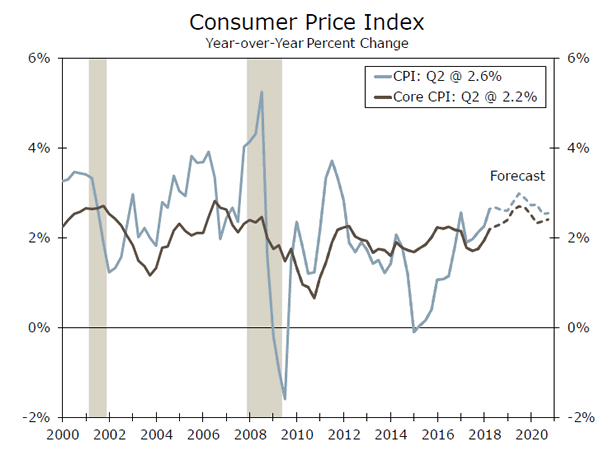
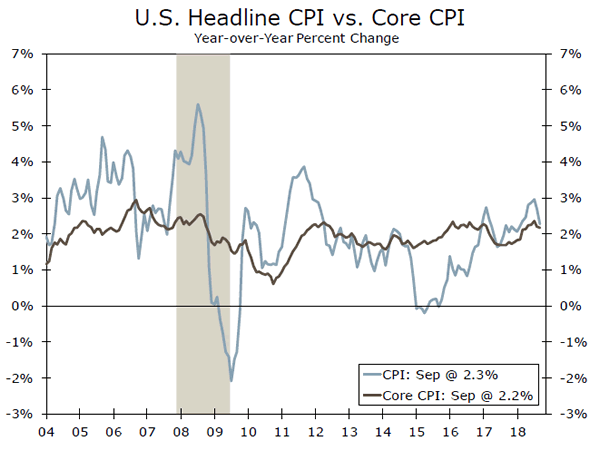
On the consumer front, prices came in a bit softer than expected, growing 0.1% for both the headline and core CPI measure. A 0.5% drop in energy held down headline inflation, while the similarly modest pick-up in core prices can be tied to a 0.3% drop in core goods. The weakness here was largely due to a 3.0% decrease in used auto prices. But, we do not expect this weakness to persist given the Manheim used car index has increased in recent months, and the recent hurricanes will likely spur replacement demand. Core services remained strong, however, up 0.2% over the month. While core inflation remained at 2.2% on a year-over-year basis, the headline CPI rose 2.3%, a more modest reading given the past few months, but in-line with the average rate over the past two years (middle chart).
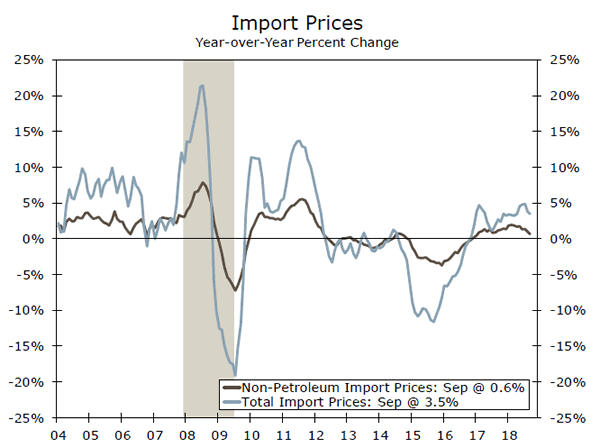
Import prices rose 0.5% in September. Higher oil and food prices were behind the gain, however, as, excluding fuel, prices were flat and excluding both food and fuels, prices were down 0.1%. Over the past 12 months, import prices were up 3.5% (bottom chart).
Despite the mixed inflation data for September, higher oil prices and effects of the more recently enacted tariffs cause us to expect inflation to strengthen in coming months. We have upwardly revised our inflation forecast, and look for CPI to rebound to 2.6% in Q4, before climbing to 2.8% in 2019 (chart on page 1).
Supply and transportation constraints are causing oil prices to be higher than originally thought through the rest of this year and into next. While, unlike the initial round of tariffs, which were primarily concentrated on intermediate products, the more recent $200 billion of imports from China now subject to tariffs involve finished goods. Due to many businesses having price contacts in place, or some having the ability to absorb part of the increased costs, the impact of tariffs likely will be drawn out.
These dynamics likely will push up consumer prices in the final months of the year and into the first few months of 2019. However, while the lift stems from one-time upward level shifts in prices, we anticipate the Fed likely will look through the inflation pickup unless inflation expectations become unanchored.
U.S. Outlook
Retail Sales • Monday
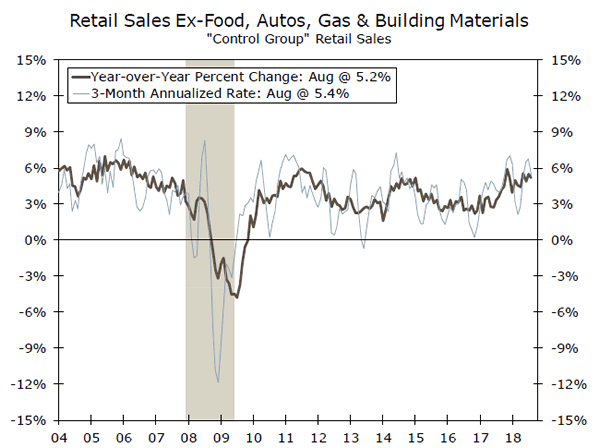
Next week begins with another look at the strength and durability of consumer spending in the final month of Q3. The 0.1% August rise in headline retail sales missed expectations of a 0.4% rise, but prior months were revised significantly upward. That said, there is clear evidence that interest-rate-sensitive sectors of the economy are beginning to cool; August marked the third consecutive monthly decline in auto sales (one-fifth of retail sales). But, nine categories of spending still increased in August, with only furniture, clothing and department stores declining. There could also be a potential boost in September spending related to the aftermath of Hurricane Florence.
The balance of data still suggests that consumer spending will be supportive of above-trend GDP growth in Q3. Consumer confidence and small business optimism remain a shade off of all-time highs. With interest rates rising, consumers still see no time like the present to spend, and we expect retail sales to rise 0.6% in September.
Previous: 0.1% Wells Fargo: 0.6% Consensus: 0.7% (Month-over-Month)
Industrial Production • Tuesday
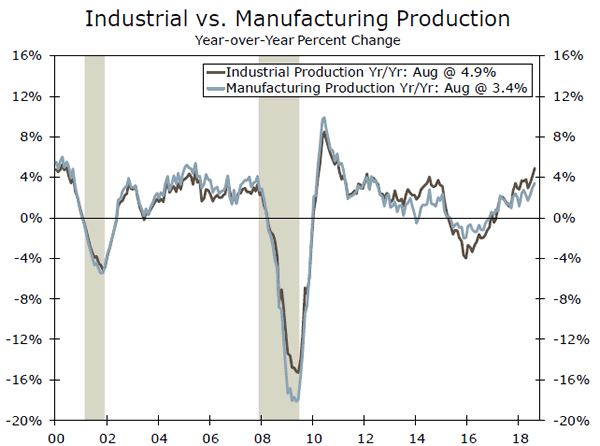
On Tuesday attention will shift to the industrial sector, where production was up a solid 0.4% in August. More impressive was the 4.9% year-over-year gain, which marked the strongest pace since 2010. Mining—14% of industrial production—saw an outsized gain of 14.1% year-over-year, as energy production has ramped up to record highs. Manufacturing output was more modest, up 0.2% on the month. However, business equipment production was up 1.2%, which bodes well for our call for real equipment spending to expand at around a 4% pace in Q3. The ISM Manufacturing survey has been sky high, and regional Fed surveys have also pointed to continued sector strength. We will also get some more insight into the nation's industrial sector from the Empire Manufacturing survey on Monday.
Moving forward, we expect dollar appreciation, higher interest rates and trade uncertainty to weigh on equipment spending, which should moderate slightly in coming quarters.
Previous: 0.4% Wells Fargo: 0.2% Consensus: 0.2% (Month-over-Month)
Housing Starts • Wednesday
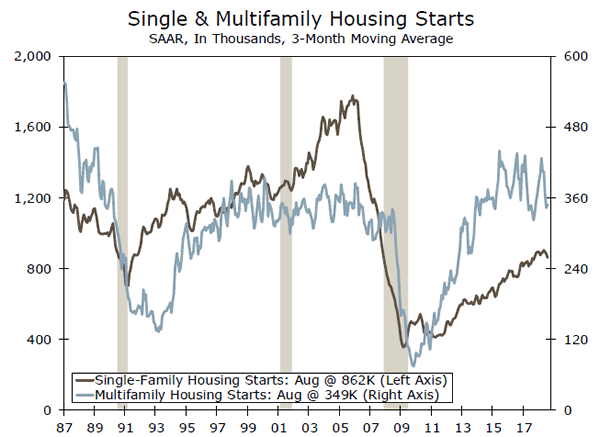
The week concludes with more data on the laggard housing market, with housing starts on Wednesday and existing home sales on Friday. Starts in August were up 9.2% on the month, but this was largely due to a 29.3% jump in the volatile multifamily category. Behind this noise, however, is perhaps a signal—that the underlying strength in apartment building has been a result of affordability and supply concerns limiting the ability of renters to buy. Furthermore, permits fell 5.7% in August and are now running below starts. This weakness in starts data contrasts with the ongoing sanguine readings from homebuilder surveys.
We still expect homebuilding to improve over coming quarters, but have taken down the degree of improvement in our forecast. Still, the remainder of the fall could see a rebound in starts. Lumber prices have fallen significantly from recent highs, and inventories of units authorized but not yet started continue to climb.
Previous: 1,282K Wells Fargo: 1,221K Consensus: 1,210K
Global Review
Global Growth Slightly Weaker Despite U.S. Strength
- In what was a relatively quiet week for international economic data, the International Monetary Fund (IMF) released its biannual World Economic Outlook.
- The IMF noted a theme we have highlighted in numerous recent reports: global growth has been a bit softer-thanexpected this year despite a robust showing from the United States.
- Encouragingly, the economic data of late have been a bit better out of some advanced economies, such as the United Kingdom, while despite the troubles in emerging markets there are some bright spots there as well, such as robust growth in India.
Global Growth Slightly Weaker Despite U.S. Strength
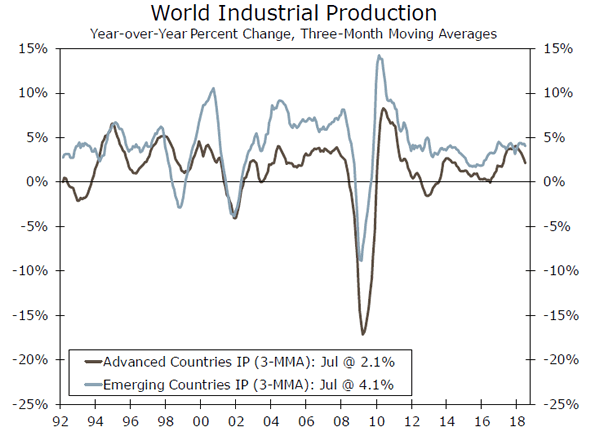
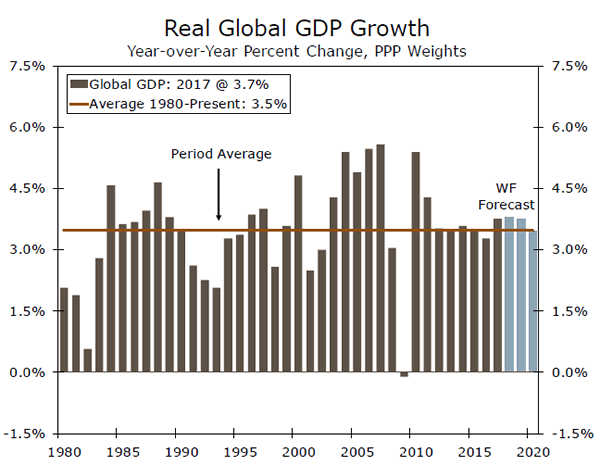
In what was a relatively quiet week for international economic data, the International Monetary Fund (IMF) released its biannual World Economic Outlook. The IMF noted a theme we have highlighted in numerous recent reports: global growth has been a bit softer-than-expected this year despite a robust showing from the United States. More specifically, the IMF downshifted its global real GDP growth forecast by 0.2 percentage points for both 2018 and 2019 relative to its April projections.
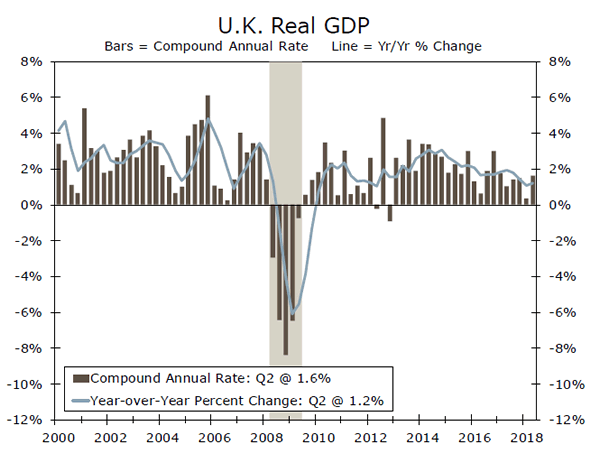
Developed economies for the most part synchronously accelerated in 2017, but 2018 has seen more of a divergent trend. Economic growth in the United States has picked up this year, and the IMF left its 2.9% U.S. growth projection from April unchanged. Growth projections for the euro area this year fell 0.4 percentage points, however, with broad-based weakness among the core countries. Similarly, economic growth in the U.K. has disappointed this year, and the IMF downwardly revised its forecast to just 1.4% for 2018.
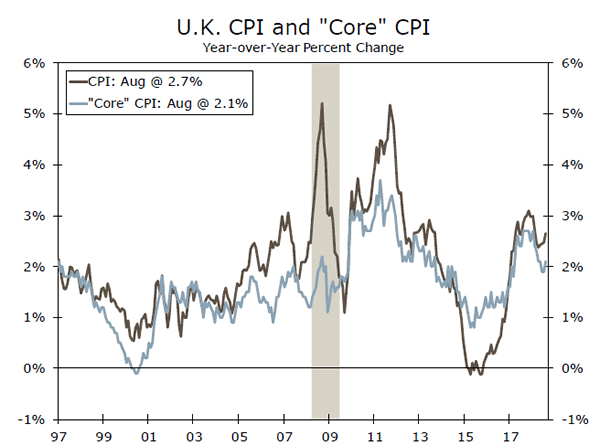
Encouragingly, economic data out of the United Kingdom have been a bit stronger of late (middle chart). Data released this week showed manufacturing output was a bit stronger than expected on a year-over-year basis through August, and a monthly GDP series also released this week suggests Q3 GDP growth in the U.K. is tracking around 0.7 percent (sequential and not annualized). While far from robust, the stabilization in growth in the U.K. is encouraging. With the March 2019 Brexit deadline looming, stable if modest growth in the U.K. is better than an economy that continues to decelerate in the face of considerable uncertainty.
The IMF also marked down its growth projections for developing economies by 0.2 percentage points in 2018 and 0.4 percentage points in 2019. The IMF cited a variety of factors for its revisions, such as increasingly protectionist trade policies, tighter financial conditions and higher oil prices. We have highlighted the challenges facing emerging market economies in other reports, but one bright spot of late has been the Indian economy.
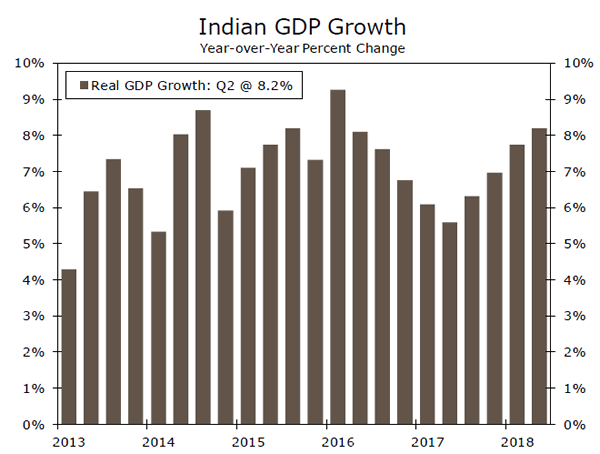
Real GDP in India has accelerated for four consecutive quarters, reaching a robust 8.2 percent year-over-year pace in Q2-2018. Indian policymakers undertook a series of structural economic reforms over the past few years that, in part, led to the slowdown in growth exhibited in the bottom chart. The drag to growth from these disruptions is clearly fading, however, and the long-term benefits combined with India's favorable demographics suggest a positive outlook for both the near-term and for potential growth.
That said, the Indian economy is not without its challenges. Despite stronger growth and rising real interest rates, the rupee has depreciated against the dollar this year. Budget deficit concerns continue to linger, and, at present, consumer price inflation is a bit below the Reserve Bank of India's target band of 4-6%. While higher oil prices could be a catalyst for higher inflation, it could also worsen the external deficit, as India is a net energy importer. Even with the favorable tailwinds mentioned above, the IMF took down its forecast for Indian real GDP growth amid the broader challenges facing emerging markets.
Global Outlook
United Kingdom CPI • Wednesday
Inflation has been receding in the United Kingdom as the run-up in price growth that occurred after the pound's steep decline has begun to fade. The August CPI data bucked this trend, however, as both headline and core CPI were much stronger than the Bloomberg consensus, leading to the uptick seen in the chart to the right.
Like most economic data, inflation prints can be noisy on a monthto- month basis. A return to the declining trend would help put Bank of England (BoE) policymakers at ease. Economic growth appears to have rebounded in the third quarter, so faster-than-expected inflation would put policymakers in an awkward spot given the looming Brexit deadline in March 2019. We expect inflation to resume its downward trend and look for the BoE to remain on hold until Q3-2019, at which point we expect the uncertainty around Brexit to have started easing, making the BoE more receptive to hiking rates.
Previous: 2.7% Wells Fargo: 2.6% Consensus: 2.6% (Year-over-Year)
Japan CPI • Thursday
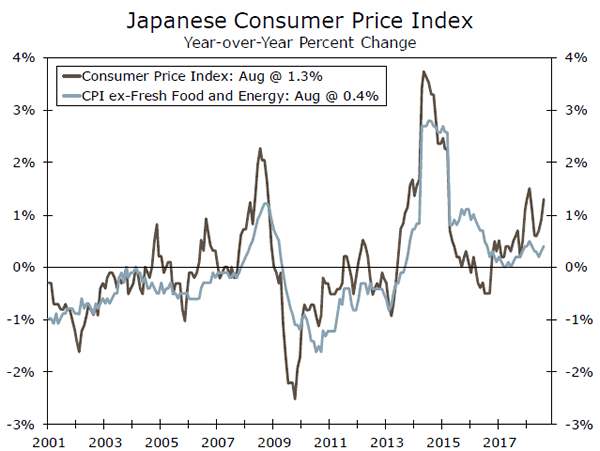
Unlike the United Kingdom, monetary policymakers in Japan continue to battle too low, rather than too high, inflation. Headline CPI inflation has been volatile in Japan in recent months, while core inflation (excluding fresh food and energy) has remained well shy of the Bank of Japan's (BoJ) 2% target.
The BoJ will meet later this month on October 30, and this meeting will include an update to the central bank's outlook for economic activity and prices, which occurs once a quarter. In its July update, policymakers downwardly revised their inflation forecast for the year and noted the challenge of materially altering persistently low inflation expectations. There are a few encouraging signs for higher inflation, such as accelerating wage growth amid an increasingly tight labor market. Even were this scenario to spark faster inflation, however, the move higher would likely be a slow grind, as would any gradual removal of monetary policy accommodation by the BoJ.
Previous: 1.3% Wells Fargo: 1.3% Consensus: 1.3% (Year-over-Year)
China GDP • Thursday
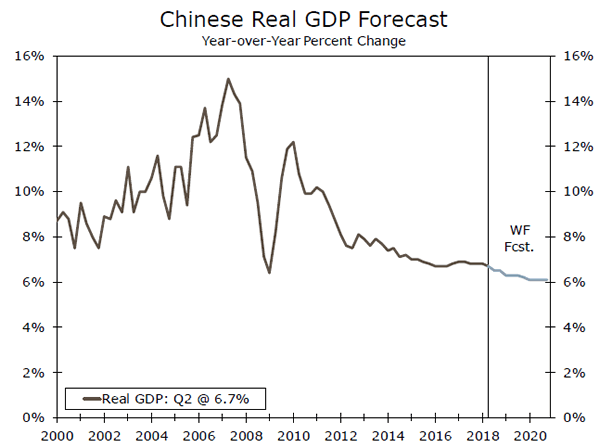
The third quarter saw some significant developments in the Chinese economy, as the trade war between the United States and China continued to ramp up. Though the most recent round of tariffs on $200 billion of Chinese exports to the United States only took effect towards the end of the quarter, other tariffs such as those on steel, aluminum, and another $50 billion in Chinese goods were in effect for most of Q3.
Chinese policymakers have reacted with measures to help stimulate growth, with the most recent move being a 100 bps cut to the reserve requirement ratio earlier this week, which should help inject liquidity into the financial system and push down interbank interest rates. As we have written previously, we do not expect the recently enacted tariffs to completely derail the Chinese economy. We do expect economic growth to slow, however, from 6.6% this year to 6.3% in 2019 and 6.1% in 2020.
Previous: 6.7% Wells Fargo: 6.5% Consensus: 6.6% (Year-over-Year)
Point of View
Interest Rate Watch
The Sanity of the Federal Reserve
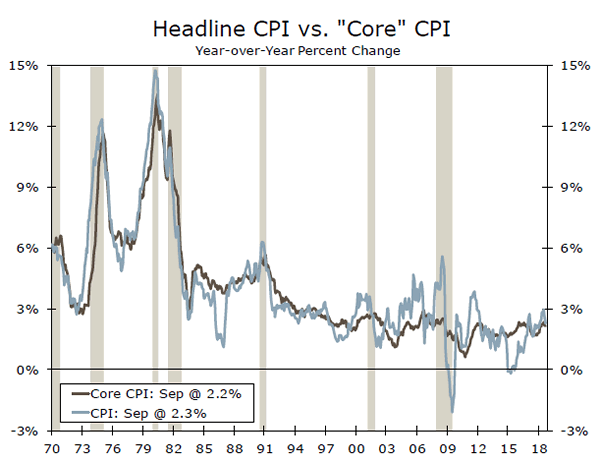
Recent Fed tightening is nothing compared to earlier periods. Between 1976 and 1980, the year-over-year rate of CPI inflation in the United States went from less than 5% to north of 14% (top chart). Near the end of that era (1979), President Carter appointed Paul Volker to head the Federal Reserve.
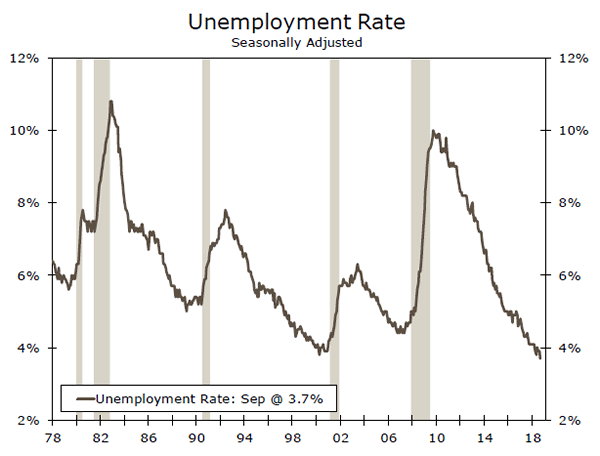
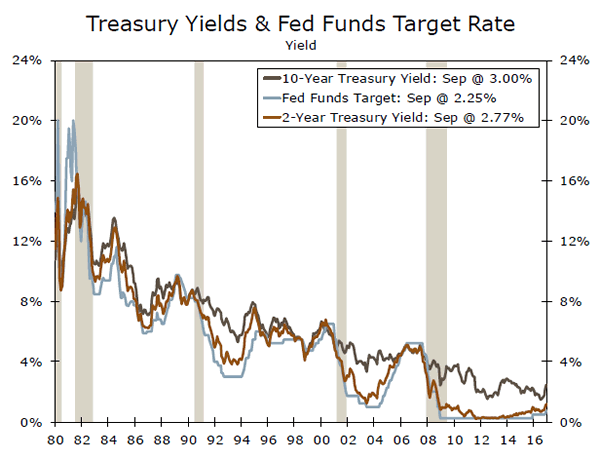
As Fed Chair, Volcker took steps to target both interest rates and the money supply. After years of "easy credit" the cost of borrowing swiftly became very expensive. The prime lending rate soared above 20% and 30-year mortgage rates climbed above 18%. Amid Volker's policies, the value of the dollar fell significantly, the unemployment rate climbed into the double-digits and the twin recessions of the early 1980s followed (middle chart).
At the time many might have reasonably thought "the Fed has gone crazy." But without his bold change in monetary policy and gritty determination to stick with it through several painful years, the U.S. economy would have continued the trend decline and stagflation of the 1970s.
Volker brought immense credibility to the Fed. Many market participants and scholars alike consider the measures taken by Volker to have made possible the expansions of the 1980s and 1990s. Economist Marvin Goodfriend, a Trump-nominee for the Board of Governors currently awaiting confirmation, said what Volker did in those years was "arguably the most widely discussed and visible macroeconomic event of the last 50 years of U.S. history."
The independence of the Fed and its credibility in fighting inflation is a key reason why the U.S. dollar is in practice the reserve currency of the world and the first choice for global payments.
Chairman Powell is carrying on a tradition of maintaining credibility. The incremental increases in the fed funds rate to its present 2.25% pales in comparison to a fed funds rate at 20% in 1980 & 1981 (bottom chart).
Despite the recessions and financial discomfort that accompanied Volker's tough medicine, President Reagan fought adamantly for his re-nomination and Volker began another 4-year term in 1983.
Credit Market Insights
Reconciling Consumer Expectations
Data released this week in the New York Fed's September Survey of Consumer Expectations (SCE) painted a less optimistic consumer outlook on household finances over the coming year. Consumers reported deteriorating expectations across several metrics, including income growth, future credit availability and their future financial situation.
But do lackluster consumer expectations match the current state of household balance sheets? On an aggregate basis, most consumers have continued to de-lever across credit types. For example, the household mortgage debt to disposable income ratio was 66% in Q2, well-below its pre-recession peak of close to 100%. Consumer credit liabilities have also remained at around 25% of disposable income over the past several years.
That said, looking beneath the surface of the SCE shows that these trends likely are not equal across income groups, and the most recent survey noted varying debt delinquency expectations as an example. Respondents with annual incomes under $50K see the probability of missing a debt payment in the next three months at 21.3%, higher than the 13.7% aggregate response.
Differences across income groups remains an area to watch as financial conditions tighten. While looking at consumers in the aggregate paints a brighter picture, rising borrowing costs and only modest income growth could squeeze consumers at the lower end of the income scale going forward.
Topic of the Week
Blame It On the Beans
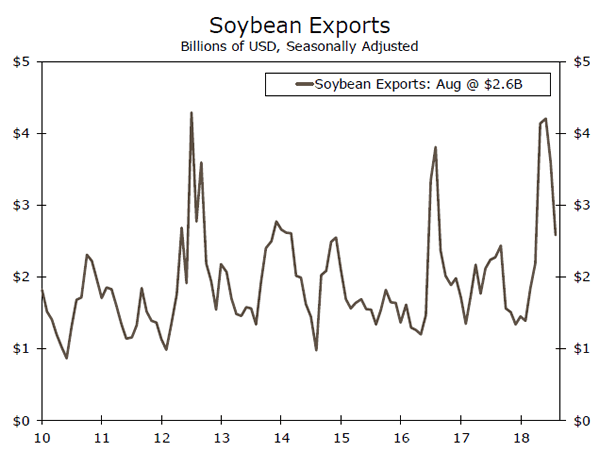
Soybean exports surged by nearly $2 billion in May, as American farmers attempted to get their beans on boats and out of the country before Chinese retaliatory tariffs took effect on July 6th. The surge in soybean exports was evident in second-quarter growth, with net exports adding a whopping 1.2 percentage points to the blockbuster headline GDP print of 4.2%. To put this contribution in perspective, other than being matched in Q4-2013, this is the only time in this expansion that net exports have contributed so much to headline GDP growth. We acknowledge this pace of contribution is unlikely to be sustained and higher frequency data confirm that key categories, such as soybeans, have already been retrenching.
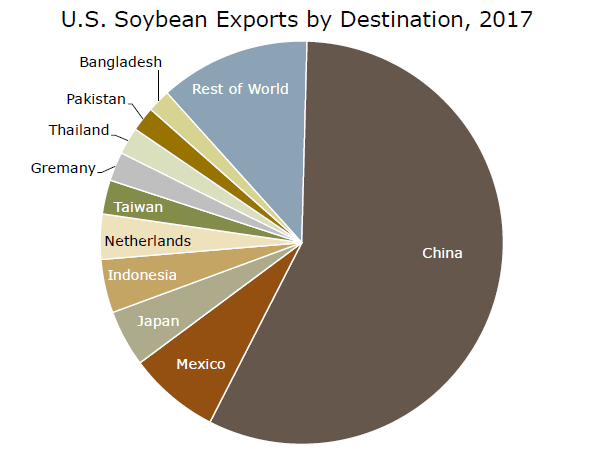
Soybean exports have since slumped by $600 million in July and by another $1 billion in August. Soybeans are only one factor in the trade report and might be exaggerated by seasonal adjustment, but they are the nation's largest agricultural export, and accounted for about 30% of total field crop production in the United States in 2017. Roughly half of that production is exported each year, and while farmers might find new markets, nearly two-thirds of those exports went to China in 2017. After China, Mexico is the United States' next largest export market for soybeans, at a distant 7% of total exports in 2017. That leaves soybean farmers in a tough spot, as the peak domestic harvesting season is just beginning, and production was already up 45% on a yearover- year basis in September. With vast increases in production and barriers to enter the United States' largest export market, farmers are already facing lower prices.
Foreign tariffs on soybeans have distorted the overall value of American exports in recent months. We expect trade to be a 1.6 percentage point drag on headline GDP in the third quarter. But, the drag from trade is expected to be more than offset by a build in inventories. Due to the big drawdown in inventories in Q2, even a modest build will translate to a big contribution to headline GDP.
The Weekly Bottom Line: Stocks Adjust to Higher Yields
U.S. Highlights
- The S&P500 has seen its biggest five-day loss since February this week. Much like then, higher bond yields have led to a repricing of stocks.
- There are few signs the U.S. economy is cooling. September consumer price inflation data showed that inflation pressures remain quite contained.
- On net, this argues for a continued gradual pace of rate hikes by the Fed. A severe tightening in financial conditions would put this at risk, but there is little evidence of that yet.
Canadian Highlights
- Canadian markets joined their global counterparts, tumbling lower as the week progressed. Fortunately, a modest recovery at Friday's market open suggests that this week's events may just be a market hiccup, rather than a signal of anything meaningful.
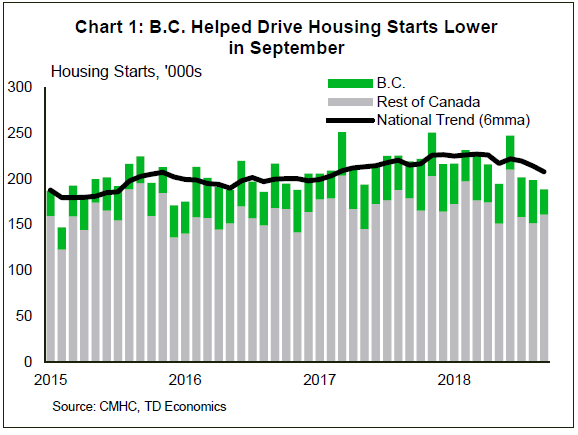
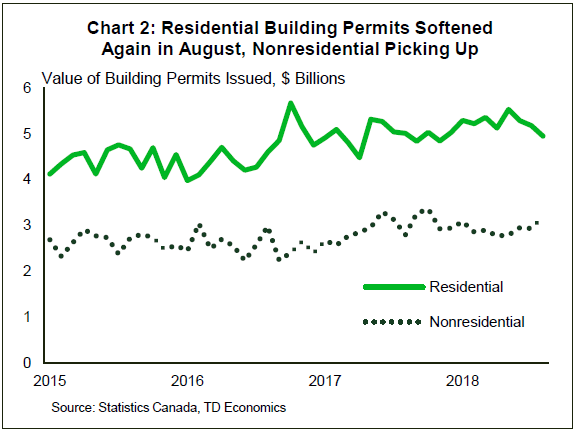
- A quiet data week saw housing starts and building permits released. Indicators of new housing activity continued to soften, but non-residential permits remain in an uptrend, a positive sign.
U.S. - Stocks Adjust to Higher Yields
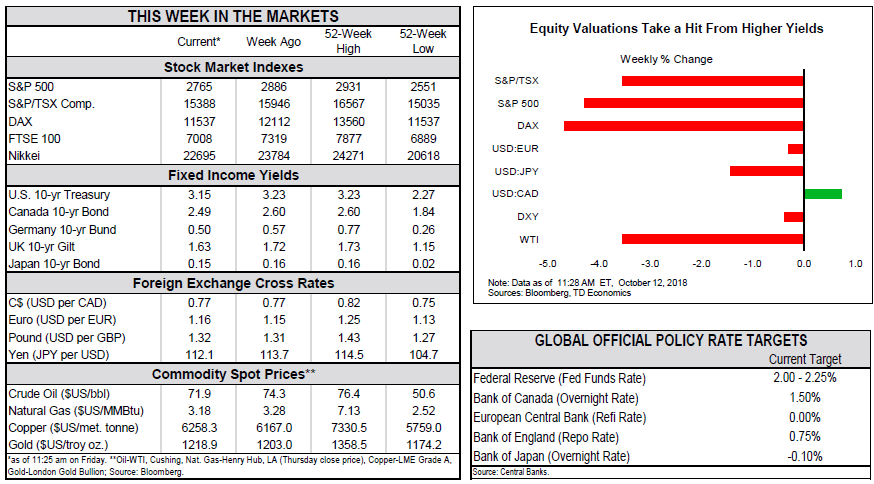
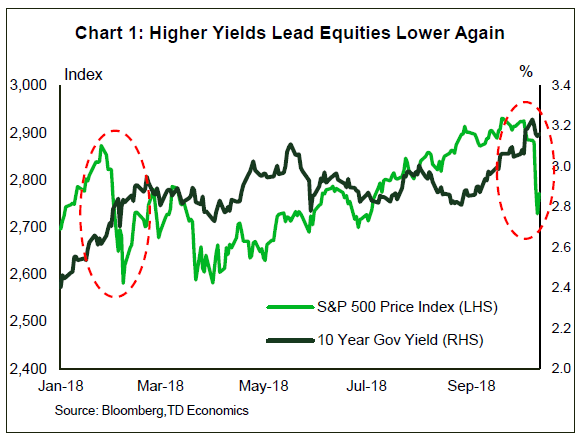
The headline story this week has been the downturn in global equity markets. The S&P500 has fallen about 6% this past week, the biggest five-day loss since February. A bond market rout was the cause then, and it was behind the move in recent days too, as equities re-price to reflect the higher yield environment (Chart 1). This is not a bear market, which is a 20% drop for at least two months, or even a correction, which the market did experience back in February.
For its part, the U.S. economy continues to do well. Indeed, stocks have weakened in part because the economy is doing well. The Fed has clearly signaled they expect strong economic growth to continue, and expect to continue raising rates over the coming year. Bond markets are increasingly taking them at their word, and investors now require a higher yield to hold bonds. When analysts value equities, they discount the expected future cash flow or dividends, and with higher rates those discounted cash flows are looking less valuable, resulting in a repricing of stocks.
There are plenty of downside risks lurking around corners for the U.S. economy: negative impacts from increased tariffs; higher government deficits could lead to a further move up in Treasury yields; and the risk of a Fed policy error. But, at the moment it must be acknowledged that the U.S. economy is growing strongly, a healthy labor market is increasing the share of people with jobs, and wage gains are occurring. At the same time, inflation pressures remain very well behaved. That helps ensure the Fed can remain patient as it raises policy rates.
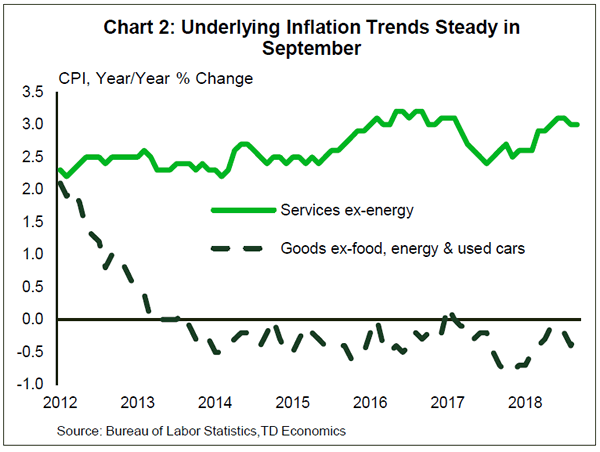
Further evidence was received this week that inflation pressures remained contained in September. The Consumer Price Index rose only 0.1% on the month both for the headline and core. Core inflation held steady at 2.2% year/year, within the range it has maintained since March. The story of core services inflation running around 3%, being offset by deflation in core goods remained unchanged (Chart 2). But, the cast of characters holding goods prices down on a month-to-month basis changed; in August it was apparel, in September, used cars. Still, the bottom line is that core goods have been firmly in deflationary territory for five years now. We had been expecting this to change, as the effects of past dollar appreciation wear off, but the more recent strength in the dollar will likely delay this. And, we haven't seen much evidence yet of tariff impact at the consumer level.
Meanwhile, services inflation has picked up from its 2017 soft patch, but it hasn't really broken new ground. We continue to expect a tight labor market, and increased wage pressures to lead core inflation higher over the next year. But, September's inflation numbers provide reassurance that an undesirable sharper upturn is not occurring. We expect the Fed to continue raising rates a quarter point at every other meeting over the next year. It would take a much more severe tightening in financial conditions than recently observed to put this pace at risk.
Canada - Housing Handing Over The Reins?
All eyes were on markets this week. A relatively benign start to the shortened week gave way to significant declines in equity markets on Wednesday and Thursday. The S&P/TSX composite index shed roughly 3.5% of its value over these days as markets sold off around the world. Not helping in the Canadian context was a price for heavy crude oil (which makes up about half of Canadian production) that continued to fall and sat around the U.S. $20 per barrel mark at the time of writing.
A slew of ex-post justifications for the sell-off are now on offer, with the most plausible being that investors, particularly in the growth space, are beginning to take higher future interest rates into account. This restores, to a degree, the 'normal' link between bonds and equities. Why this realization came this week in particular is unclear. Rates have been on the rise for a while now and the Federal Reserve has not signalled any significant inclination towards slowing the pace of rate increases. Regardless, this week's events so far seem to be a regular market 'hiccup', with major indices set for a positive end to the week at the time of writing (the TSX began Friday's trading session roughly a percentage point above Thursday's close).
Away from markets, the economic data this week was housing focused. Starts were off again in September, falling to 189k at an annualized pace. This was enough to bring the 6 month average trend down to a 19 month low (Chart 1). If there is any consolation to be taken from this disappointing number, it is that the decline can be almost entirely attributed to B.C., where housing markets continue to digest recent policy changes.
Still, there is no denying that the trend in housing activity, broadly speaking, is softening. This was confirmed in the building permit data for August, which showed a further weakening in the dollar value of residential permits approved (Chart 2). It of course bears noting that a moderation of housing markets is to be expected given the broader Canadian economic story. The policy interest rate has been moved up a full point over the last year or so, and further hikes seem likely. More expensive debt crimps household budgets, with housing the most obvious point of impact (other rate sensitive areas, like auto sales, have also been moderating).
As it stands, there doesn't seem to be too much to get worried about. Resale activity has begun to pick back up after a policy-induced slowdown at the beginning of the year, which should, with time, incent further supply. What's more, other areas of the Canadian economy are holding up well. Non-residential building permits remain in an uptrend, and USMCA removes some uncertainty from the near-term outlook (see report). Housing has been (and will continue to be) an important driver of the Canadian economy. But household finances are still stretched and interest rates are likely to continue rising. Clearly, the time has come for the reins to be passed to other growth areas.
U.S.: Upcoming Key Economic Releases
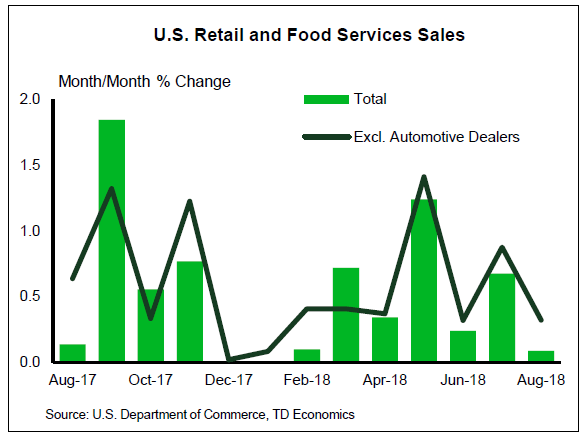
U.S. Retail Sales - September
Release Date: October 15, 2018
Previous: 0.1%, ex. auto: 0.3%,
TD Forecast: 0.9%, ex. auto: 0.4%
Consensus: 0.7%, ex. auto: 0.4%
We expect a 0.9% increase in retail sales, reflecting a strong boost from auto sales. Hurricane Florence could also lift certain categories like building materials this month consistent with past disaster episodes. This impact, along with healthy labor market fundamentals, point to a 0.5% rise in core sales with upside risk. The report would also underpin Q3 real PCE above 3%.
Canada: Upcoming Key Economic Releases
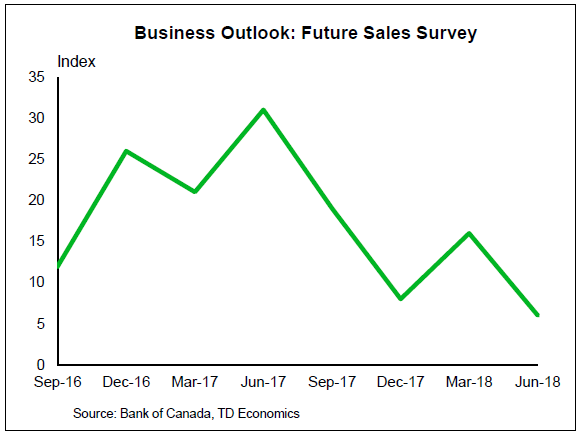
Business Outlook Survey - October
Release Date: October 15, 2018
The Autumn Business Outlook Survey will provide one last glimpse into the BoC's assessment of conditions ahead of the October MPR, although the market may be reluctant to infer too much from the results given the timing of the survey. Consultations for last autumn's BOS were conducted between August 24 and September 19, which would place this year's consultations before the breakthrough on NAFTA - similar to the July survey that did not capture any of the G7 animosity. Nonetheless, we expect firms to maintain an upbeat tone on continued strength in foreign demand and a pickup in domestic conditions. Capacity pressures should remain in the spotlight which may give the report a slightly hawkish tilt, while any dated references to trade uncertainty should emphasize the need to "get on with (investment)," to paraphrase the Governor.
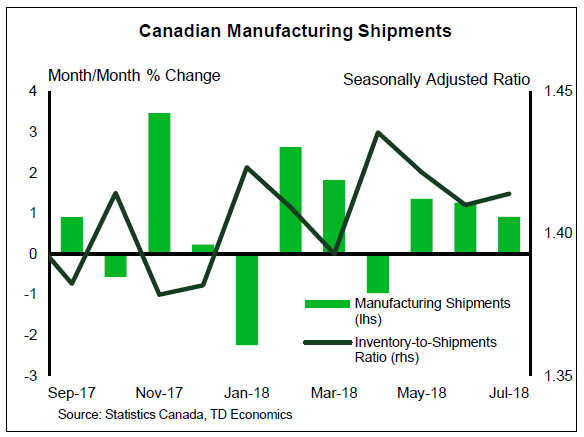
Canadian Manufacturing Sales - August
Release Date: October 17, 2018
Previous: 0.9%
TD Forecast: -0.8%
Consensus: N/A
Manufacturing sales are poised for a 0.8% decline in August, although weakness appears to be largely concentrated in the transportation sector. Motor vehicle exports fell by 6.2% in August alongside a 7.7% decline in aerospace products. While the latter is subject to heightened volatility and should thus be taken with a grain of salt, the former fits with a reported decline in auto production which will weigh heavily on manufacturing shipments. While the ex-transport number will look less bleak, a 5% gain in nondurable shipments over the last three months will limit the scope of any offsets. Real manufacturing sales should come in above the headline print owing to lower factory prices, which will dampen the impact on industry-level GDP.
Canadian CPI - September
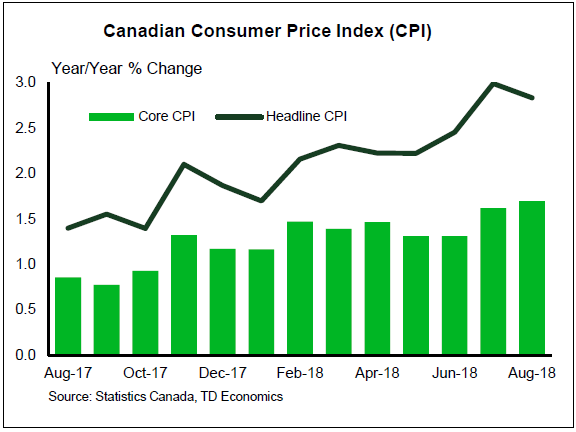
Release Date: October 19, 2018
Previous: -0.1% m/m, 2.8% y/y, Index: 134.2
TD Forecast: 0.1% m/m nsa, 2.7% y/y, Index: 134.3
Consensus: N/A
We expect CPI to slip to 2.7% in September as prices continue to unwind from the previous pickup. Energy prices remain a lift to inflation but should decelerate on a y/y basis, whereas food prices should pick up marginally. Outside of food and energy, we expect a mixed bag and therefore a lot hinges on the one-off categories, particularly airfares. The category failed to meaningfully correct from its 16% July jump, and while it is tempting to expect a sharp correction, methodological changes make future performance highly uncertain. But, if anything we view risks skewed to the downside. More attention will also be on the core measures this month, which averaged an above-target rate of 2.1% in August. That's not significant enough to impact BoC's policy bias, and a further move higher is unlikely. We expect a stable reading and will be mindful of any downward revisions as well. Going forward, we expect headline inflation to continue to slide lower through yearend, averaging 2.5% in Q4, in line with the BoC's forecast.
Canadian Retail Sales - August
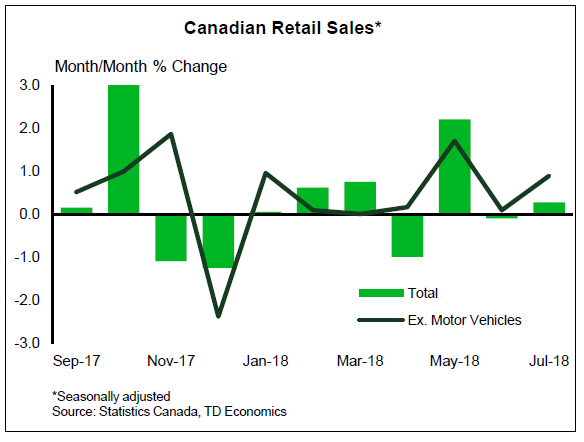
Release Date: October 19, 2018
Previous: 0.3%, ex-auto: 0.9%
TD Forecast: 0.4%, ex-auto: 0.1%
Consensus: N/A
TD looks for retail sales to rise 0.4% on the strength of motor vehicles, which should provide a tailwind to an otherwise lackluster report. This should leave ex. auto sales little changed on the heels of a 0.9% m/m advance in July. Gasoline station sales will be a slight drag on growth owing to lower prices at the pump while building material sales should suffer from a slowdown in residential construction. Real retail sales should see more modest gains on higher consumer prices, which fits with a slower pace of household consumption on the heels of unchanged retail volumes in July and a sharp pullback in import activity.
US Retail Sales to Support Dollar
The US dollar was higher against major pairs on Friday, but not enough to end up the week on positive territory. A stock market rout took its toll on the greenback and the subsequent rebound in stock prices supported the currency ahead of the weekend. Strong US data and a clear interest rate hike path by the U.S. Federal Reserve have boosted the dollar with investors focusing on the release of US retail sales data on Monday, October 15 at 8:30 am EDT.
- US retail sales expected to gain 0.7 percent
- US Treasury Currency report not expected to brand China a fx manipulator
- Fed minutes to be release on Wednesday
Euro to Trade on Italian Budget Drama
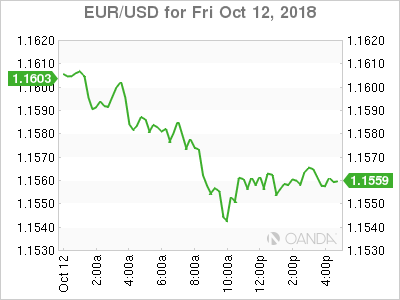
The EUR/USD fell 0.31 percent on Friday. The single currency is trading at 1.1557 at the end of the week. Volatility in the market was such that the EUR will end up appreciating 0.35 percent in the last five trading days. Italian budget drama to continue next week with few economic indicators in Europe to offset any potential downward pressure.
The International Monetary Fund (IMF) cut its global growth forecast in 2018. The Euro area was downgraded with Germany and France projected lower. The EU is forecasted to grow 2 percent in 2018 and 1.9 percent in 2019. The United States by comparison is expected to gain 2.9 percent and 2.5 percent. Trade concerns were cited by the IMF as a reason to have lower expectations as tariffs will impact growth.
Gold Lower as USD and Equities Recover
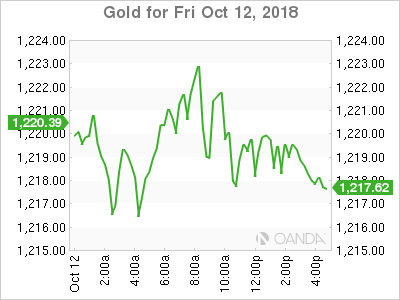
Gold dropped 0.51 percent on Friday, but held on to a 1.3 percent gain on a weekly basis. The yellow metal was one of the best performers as a stock market sell off caused other asset classes to fall along with equities. The safe haven appeal of gold resurfaced and boosted the metal.
Oil Gains on Friday But Breaks 5 Week Rally
Oil prices were higher on Friday with WTI rising almost 1 percent and Brent climbing 0.55 percent. Energy prices did not register a weekly gain, breaking a five week streak, as global stock markets fell. A perfect storm of technology company breaches and global growth downgrades caused anxiety amongst investors.
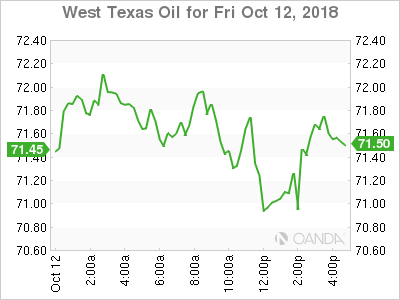
Crude was able to gain some ground on Friday despite the USD getting back some of its mojo ahead of the weekend. The week ahead starts early for the dollar with retail sales expected to have improved and wash some of the disappointment from the missed inflation data.
Market events to watch this week:
Monday, October 15
- 8:30am USD Core Retail Sales m/m
- 8:30am USD Retail Sales m/m
- 10:30am CAD BOC Business Outlook Survey
- Tentative USD Treasury Currency Report
- 5:45pm NZD CPI q/q
- 8:30pm AUD Monetary Policy Meeting Minutes
Tuesday, October 16
- 4:30am GBP Average Earnings Index 3m/y
Wednesday, October 17
- 4:30am GBP CPI y/y
- 2:00pm USD FOMC Meeting Minutes
- 8:30pm AUD Employment Change
- 8:30pm AUD Unemployment Rate
Thursday, October 18
- 4:30am GBP Retail Sales m/m
- All Day EUR EU Economic Summit
- 10:00pm CNY GDP q/y
Friday, October 19
- 8:30am CAD CPI m/m
- 8:30am CAD Core Retail Sales m/m
*All times EDT
Next Week’s Spotlight Falls on the USD and the RMB Complex
Well, that was dramatic, but some significant levels on equity markets held on a closing basis, while the DXY rallied into the close. But in the end, it was all about cleaning the slate while living to fight another day.
Next week spotlight falls on the USD and the RMB complex, and following the likely publishing of the much talked about US Treasury FX report, it’s going to be another packed week on the economic front for these currencies.
China a Currency Manipulator: Yes or No
Whit the odds at 50-50 chance that the US will go so far as to outright name China a “manipulator.”, For no other reason than the usual chorus of mixed signals from the US administration, with the worrywarts leading the way. White House Economic Advisor Kudlow opined on CNBC that China’s response to US requests is “unsatisfactory.” In contrast, Treasury Secretary Mnuchin said he’d had a “very productive” conversation with the PBoC but expressed his concerns about “the weakness in the currency.”
It all suggested that, while siding with no currency manipulator camp, the uncertainty around the report warranted at minimum a passive reduction in specific currency exposure, especially when risk off lead to unwinds last week of critical consensus short positions where the “funders” tended to outperform And at maximum, cleaning the slate entirely including trimming AUD shorts and USDCNH longs.
Last week the EUR, JPY and CHF all went bid against the USD as equities took a plunge and the rally accelerated when Trump reminded everyone that no one is safe from the wrath of Trump, even his nominated Fed Chairman Jay Powell.
Europe Risk
In Europe, there will be more political intrigue. Italy will present it budget draft to the EU, keeping in mind the EU Commission already said last week in a letter to the Italian government that its latest fiscal plans point to “a significant deviation” from the path recommended for Italy by the EU Council. And headline risk is massive as the UK and EU are due to discuss Brexit at the EU Summit. But flying under the radar is the first major electoral test for any new government – this vote is in Bavaria. on Sunday
Oil Market
Headwinds remain.
The S &P stabilised well and continued to roll with the punches, but Oil markets were not so eager to snap back. Oil prices were struggling to follow the equity market lead, after the International Energy Agency monthly Market Report adjusted demand lower by 110,000 bpd for both 2018 and 2019, reported an increase of 100,000 bpd in September OPEC production while pointing out OECD data suggests oil stocks are at the highest level since February. While advising that markets are adequately supplied, which again highlights uncertainty over supply once the US sanctions on Iran take effect. Lordy Lordy, it’s a noisy market.
Drillers added eight oil rigs in the week to Oct. 12 according to Baker Hughes. This is ahead of the Plains All American Pipeline Project which is set to start flowing on Nov 1 and should ease pipeline bottlenecks that have lower crude prices in the Permian Basin. The Sunrise Pipeline has a reported capacity of about 500,000 barrels per day.
Gold Markets
The current landscape remains exceptionally shaky if both stocks and US rates markets continue to recover significantly in the days ahead. As well there a plethora of tier one US economic data out next week, and given strength in the recent run of US economic data it has anchored the USD to fundamentals where the dollar has shown a tendency to appreciate. Without a significant break of the critical $1225 level its far to early to jump on the bullish gold bandwagon.
China Trade Data
Speaking of China data, I’m still perplexed why North American markets analysts were so enamoured about Beijing’s export data. Sure, it was surprisingly hardy versus market expectation, but it was impossible to factor in with any high degree accuracy ,the front-loading impact, which was more than evident to the local Singapore traders who were buying the USDCNH dip. Local’s tend to focus on electrical machinery exports which are Chinas biggest export, and given the surge in that sector, the data was not all that significant as exporters were fulfilling longer-term commitment before implementation of the latest tariffs on US$200 billion in Chinese exports. Even the so-called ‘ hoarding effect” on the commodity imports components was evident given the newly announced 10 % trade tariffs in mid-September impacted the data.
US Retail Sales Next on the Docket for the Dollar
The US will see the release of its retail sales data for September on Monday, at 1230 GMT. Forecasts point to an acceleration, which may amplify speculation for a robust Q3 GDP print, potentially helping the dollar to claw back some of its latest losses.
The US economy remains on a very solid footing, with fiscal stimulus set to keep growth above trend and above potential for a while longer. The third quarter seems to have been robust in this respect, as the Atlanta Fed GDPNow model estimates GDP growth at a 4.2% annualized rate – the same pace as in Q2. As such, investors are increasingly pricing in more tightening by the Fed in 2019, and by extent pushing US bond yields higher, lifting the dollar overall in recent weeks.
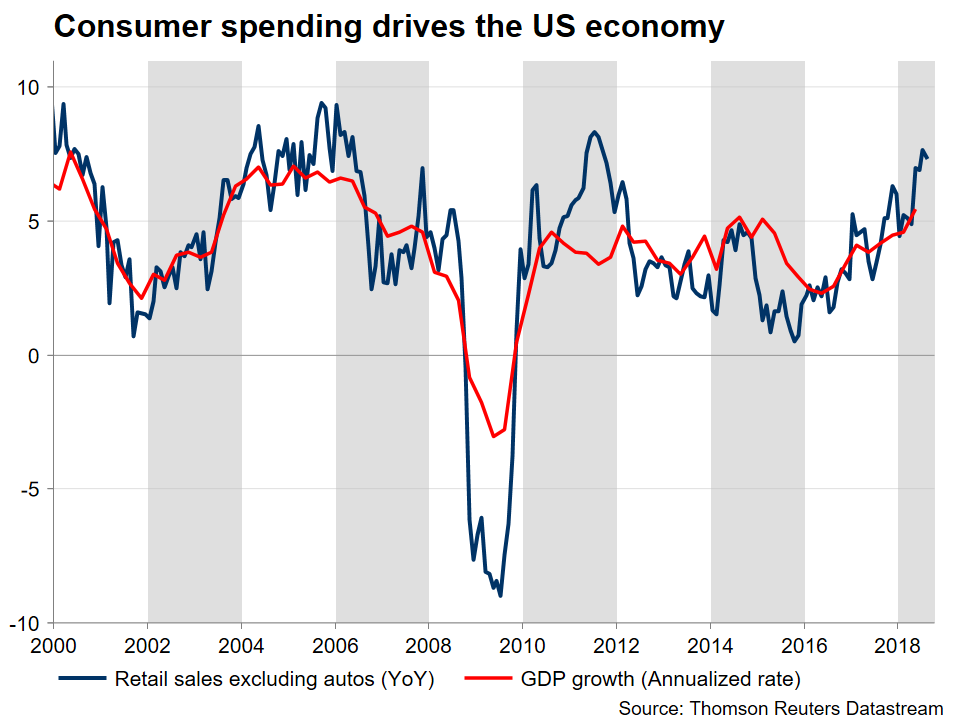
The upcoming retail sales data are forecast to reaffirm this narrative. Sales are anticipated to have accelerated to 0.5% in monthly terms, from a mere 0.1% in August. Meanwhile, the core figure, which excludes automobiles sales, is expected to clock in at 0.3% in September – unchanged from previously.
The optimistic forecasts are supported by the surge in both the Conference Board and the University of Michigan’s consumer sentiment indices for the month. The former unexpectedly soared to a fresh 18-year high, while the latter came within breathing distance of its own 14-year highs, signaling heightened consumer optimism.
At the time of writing, investors assign a 78% probability for the Fed to hike rates again in December according to market-implied pricing derived from Fed funds futures. A stronger-than-expected set of retail sales data could push those odds even higher, potentially helping the dollar to recoup some of its latest losses.
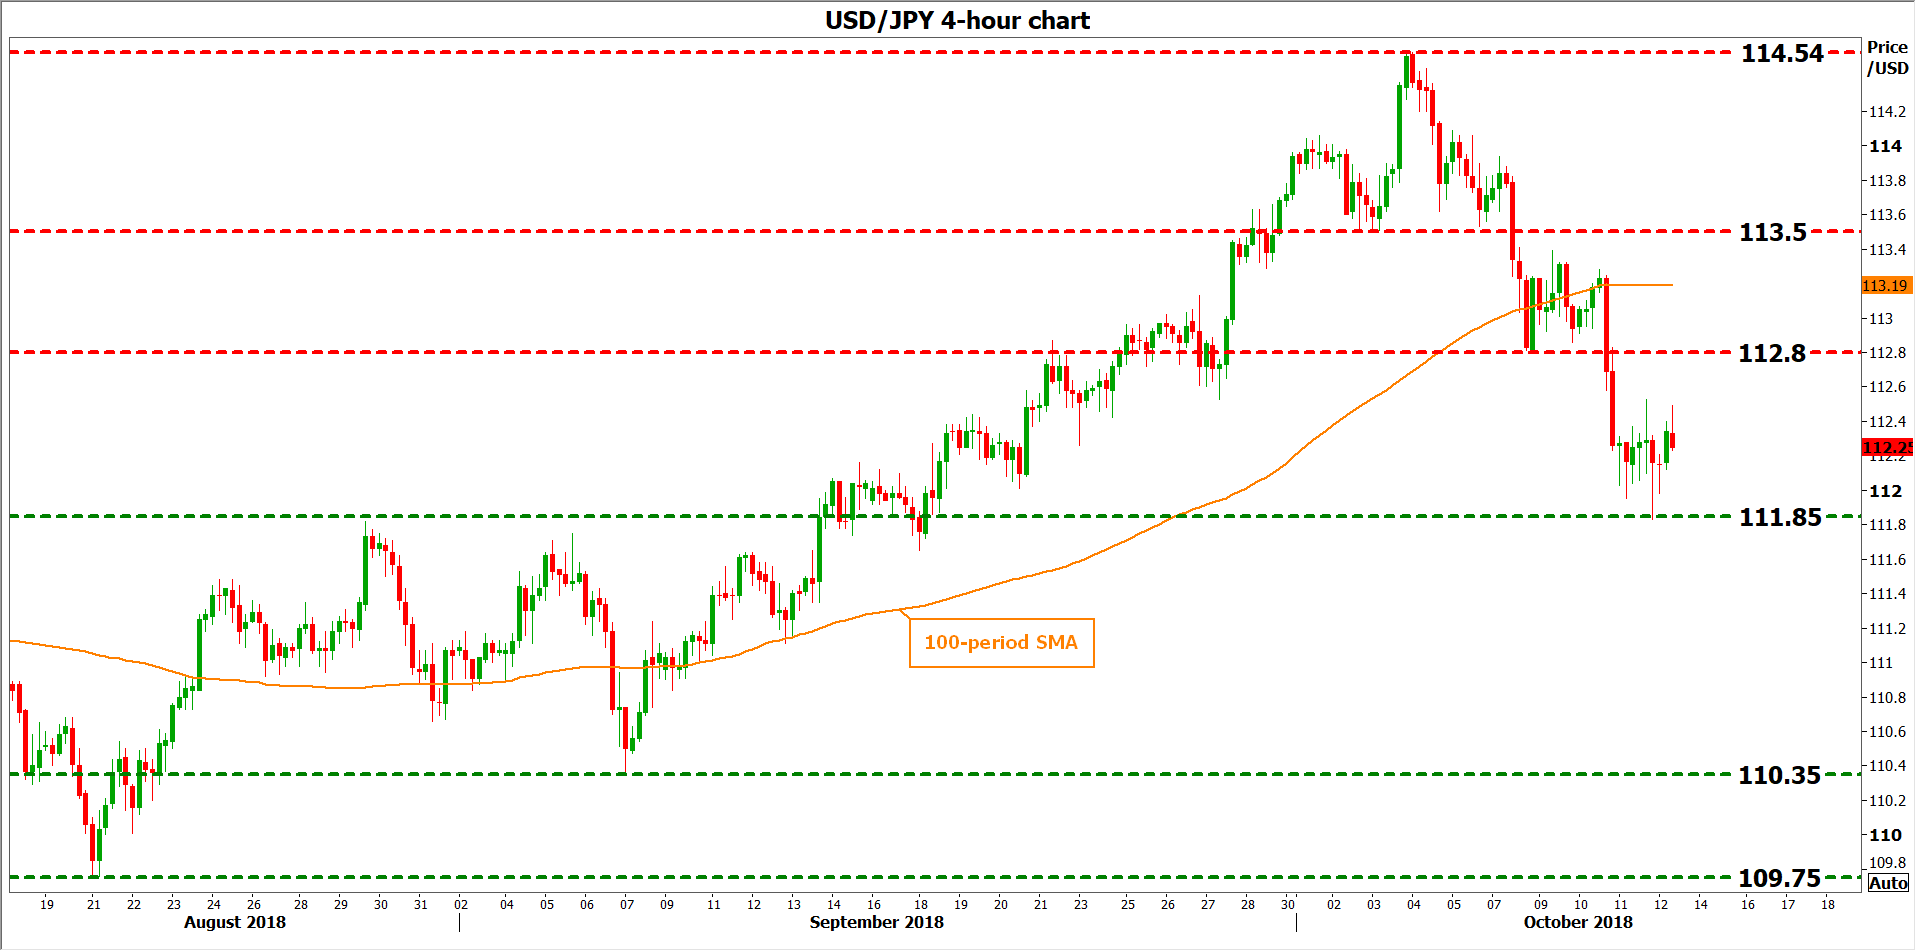
Technically, advances in dollar/yen could meet preliminary resistance near 112.80, a level marked by the lows of October 8. An upside break could see scope for a test of the 113.50 barrier, defined by the trough of October 3, with even steeper advances eyeing the 11-month high of 114.54.
On the flipside, a disappointing set of data may push the pair lower. Further declines in may stall initially around 111.85, the low of October 11. A bearish break may open the way for the 110.35 zone, this being the September 7 bottom. Lower still, support may be found at 109.75, the August 21 low.
All Eyes on China GDP Amid Equities Rout; Crunch Time for Brexit Talks
As rising US yields and ongoing trade tensions fuel concerns about the global growth outlook, GDP numbers out of China will be the main highlight of the coming week. There will be plenty of other important data too as attention turns to monthly jobs, inflation and retail sales figures, with most major economies reporting over the next seven days. Brexit will continue to bombard the market headlines as UK and EU leaders will try to resolve any remaining issues in the divorce terms at a two-day summit.
US retail sales to kick off week
Retail sales numbers out of the United States on Monday could add to the heightened market angst about the pace of Fed rate hikes if they point to stronger consumer spending in September. Retail sales are forecast to have grown by 0.5% month-on-month in September, accelerating on the prior 0.1% rate. The alternative ‘retail control’ measure of sales, which is used in GDP calculations, is also forecast to improve, rising by 0.4% m/m versus 0.1% in August.
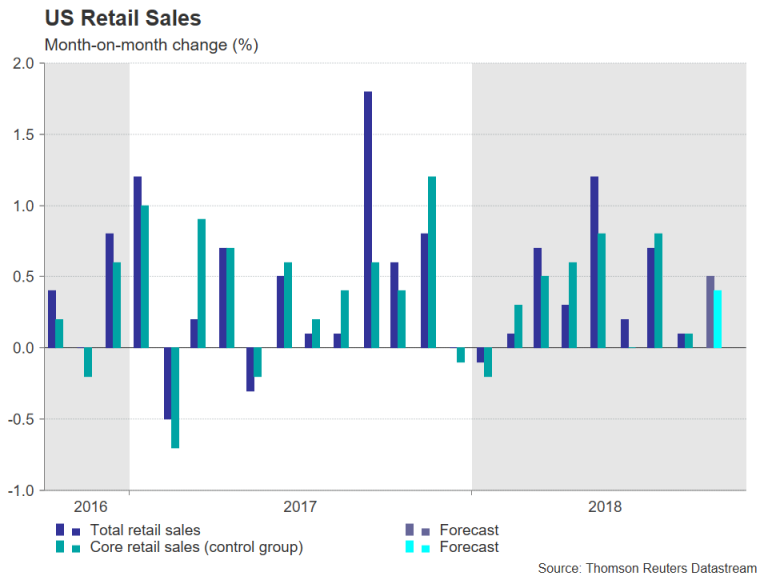
Also out on Monday is the New York Fed’s Empire State manufacturing index, with the Philadelphia Fed’s manufacturing gauge to follow on Thursday. On Tuesday, industrial output figures are expected to show steady growth of 0.3% m/m in September, after which, the economic calendar will be dominated by housing data. Building permits and housing starts (due on Wednesday) and existing home sales (Friday) will be watched carefully amid worries of a slowdown in the housing sector.
In addition to the data, traders will be looking to the Federal Open Market Committee (FOMC) minutes of the Fed’s September policy meeting. The Fed’s quarterly economic projections and dot plot chart in September boosted expectations that rates will continue to be raised gradually well into 2019, driving long-term yields higher. If the Fed reinforces this view in its minutes, the US dollar may not necessarily strengthen this time around as the hawkish outlook could lead to further losses on Wall Street and that would drag on the currency.
Chinese growth could hit 9-year low
China will be the first major economy to report GDP figures for the third quarter next week. The data will also be the first since the US tariffs came into force and will therefore be scrutinized even more intensively than usual. Before the GDP estimates though, inflation numbers will be viewed on Tuesday. Annual consumer inflation is forecast to have risen by 2.5% in September, edging up from 2.3% in August. Producer prices, however, are anticipated to ease, with the producer price index expected to slow to 3.5% year-on-year from 4.1% previously.
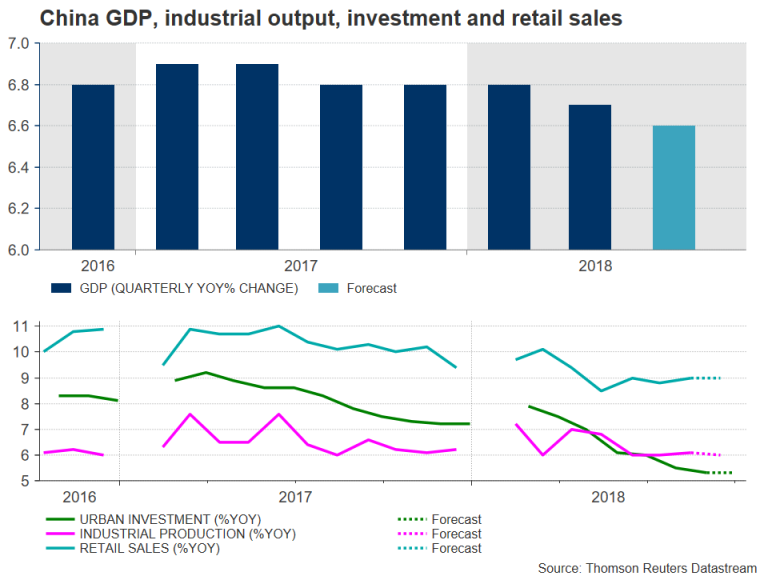
Friday will be a busy day as, apart from the GDP numbers, the monthly industrial output, fixed-asset investment and retail sales figures will be released as well. All three indicators are forecast to have held largely steady in September, having been on a steady downward path for much of the year. That trend will likely be evident in the third quarter growth figures, with China’s GDP expected to have expanded by 6.6% y/y, which would make it the lowest since 2009. The IMF this week downgraded its growth forecast for China for 2019 and a disappointing reading for Q3 would add to the darkening outlook for the world’s second largest economy.
Australian jobs and New Zealand CPI in focus for aussie and kiwi
The Australian and New Zealand dollars haven’t been having a very good time in recent weeks, with both falling to 32-month lows versus their US counterpart. US-China trade frictions and the widening yield spread with the US have been the main factors pulling the antipodean pairs lower. However, the aussie and kiwi escaped the latest sell-off in global equities relatively unscathed and data due next week could help the currencies stabilize further.
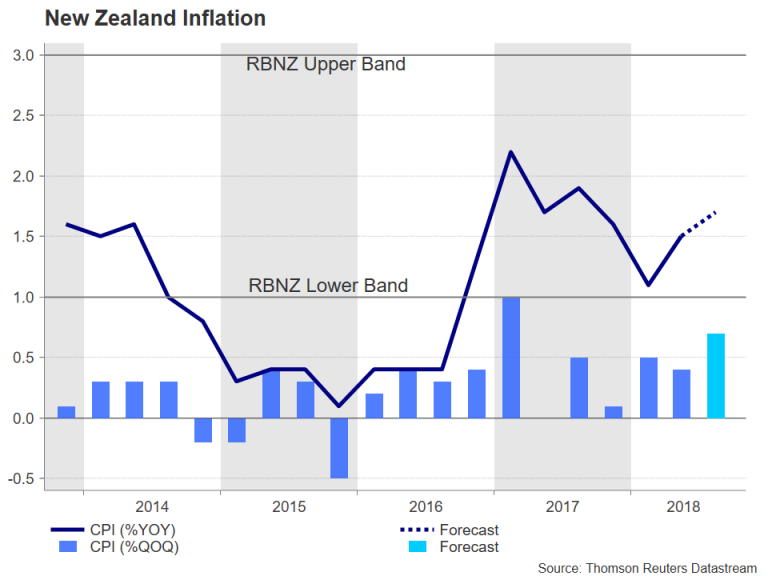
Starting with New Zealand inflation figures on Tuesday, the consumer price index (CPI) is forecast to have risen by 1.7% y/y in the three months to September, inching up from 1.5% in the prior quarter. An unexpected weaker reading could push the kiwi to fresh lows as it would increase the odds of a rate cut by the Reserve Bank of New Zealand.
In Australia, where economic growth has been stronger and a rate hike a bigger possibility, employment numbers on Thursday could provide the aussie a lift if there are further jobs gains in September. Employment is forecast to have risen by 15k last month, with the unemployment rate anticipated to hold at 5.3%. Also of interest for aussie traders will be the minutes of the Reserve Bank of Australia’s October policy meeting on Tuesday.
Japan to post inflation and trade data
Inflation will also come under the spotlight in Japan as the Bank of Japan is no nearer to meeting its 2% price target. The 12-month rate of core CPI, which excludes fresh food prices and is targeted by the BoJ, is expected to tick up by 0.1 percentage point to 1.0% in September when released on Friday. Prior to the CPI data, trade figures will be watched on Thursday. Exports growth is projected to have slowed sharply in September from 6.6% to 1.9% y/y. An even deeper deceleration could add to concerns about global growth, though the Japanese yen only stands to gain from any spikes in risk aversion.
Loonie looks to inflation and retail sales numbers for boost
The Canadian dollar is one of the worst performers against the greenback this week as a slide in oil prices weighs on the currency. But as the Bank of Canada policy meeting approaches at the end of the month, next week’s data – the last major releases before the BoC meeting – could help set a more positive tone for the loonie. Inflation for September and retail sales figures for August are both out on Friday, while before then, August manufacturing sales on Wednesday will attract some attention. Although the BoC is almost certain to raise interest rates in October, the strength of next week’s numbers could help determine whether the Bank will shift to a more aggressive rate path or stick to its gradual policy.
No revival expected in German business sentiment just yet
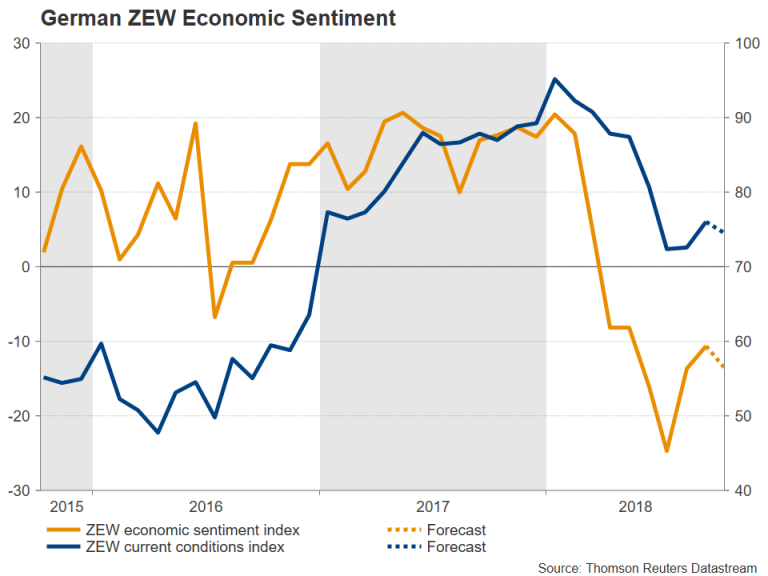
It’s going to be a fairly muted week for Eurozone data with the ZEW economic sentiment survey out of Germany likely to grab the biggest attention. The ZEW economic sentiment index, due on Tuesday, is forecast to decline to -13.5 in October from -10.6. German business morale has been the worst hit in Europe from the US-China trade war and most German and regional sentiment barometers remain well below the peaks enjoyed in 2017, casting doubt about a rebound in Eurozone growth.
For the euro area, the only notable release will be Wednesday’s final CPI readings for September. No revision is expected to the preliminary print of 2.1% y/y.
The absence of major indicators means the euro’s moves will likely be driven by the dollar and by possible fresh developments regarding Italy’s budget plans. Any escalation in the stand-off between the European Union and Italy over disagreements about fiscal discipline could drag the euro back down again after managing to post a late-week rebound.
Volatile time ahead for pound as Brexit talks intensify; UK data eyed too
There’s been growing optimism in recent days that Britain and the EU are nearing an agreement on the terms of the UK’s withdrawal from the EU. Those hopes have led the pound higher, making it one of the week’s best performers versus the dollar. However, as it is standard for all EU negotiations to last into the last minute, the remaining issues are unlikely to be resolved at the EU heads of government summit on October 17-18 and the talks will probably continue into November, when a special summit is being planned.
The pound is poised to rally should a deal be struck at the summit and could similarly suffer a sell-off if the talks break down. But a worst-case scenario would be for Prime Minister May to secure a deal that has little chance of getting approved by the British parliament. Either way, UK releases next week will likely be secondary to Brexit developments.
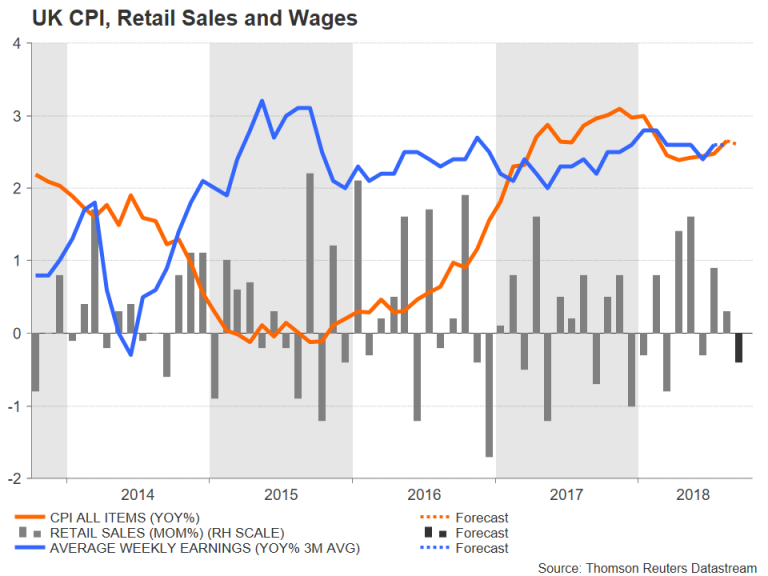
The first set of data, due on Tuesday, will be the labour market report for August. The UK’s jobless rate is forecast to have held at the multi-decade low of 4% in the three months to August and wage growth is also anticipated to stay unchanged, at 2.6% y/y. Inflation numbers will follow on Wednesday, with the annual rate of CPI foreseen to ease to 2.6% in September from the prior 2.7%. Core CPI, which strips out volatile components, is projected to hold at 2.1%. Finally, on Thursday, retail sales figures will be watched to gauge the strength of UK consumption. Retail sales are expected to fall back in September, decreasing by 0.4% m/m after a 0.3% gain in August.