

Sample Category Title
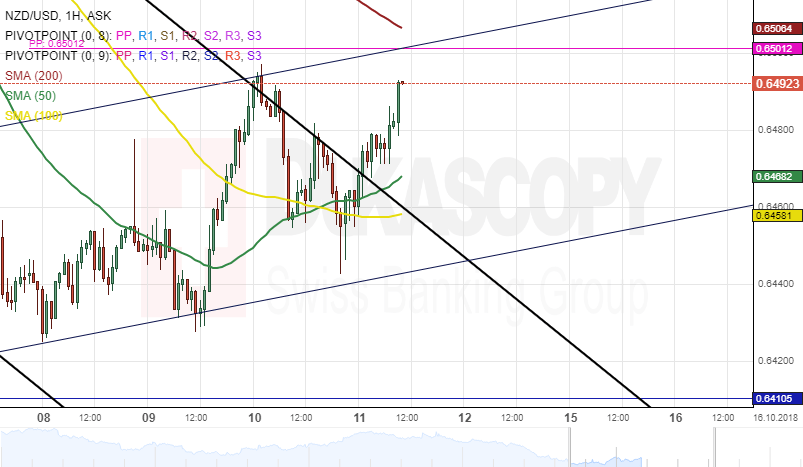
NZD/USD Analysis: Targets At 200-Hour SMA
The New Zealand Dollar depreciated about 54 base points against the US Dollar on Wednesday. The currency pair returned to the descending channel during the end of the previous session.
However, today's trading session begins with a bullish momentum, as the exchange rate reverse from the 0.6440 mark and broke the descending channel pattern.
Given that a breakout had occurred, the next target for bullish traders will be near the 200-hour simple moving average at 0.6507 within this session.
On the other hand, the currency exchange rate could make a U-turn from current price level aim at the monthly pivot point at 0.6410 today.
XAU/USD Analysis: Passes Monthly PP
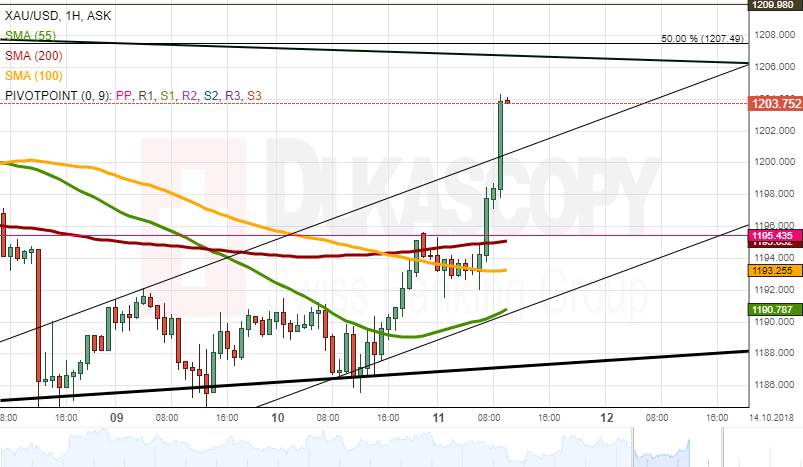
The gold price appreciated 0.73 % since Wednesday's session. On Thursday morning, the yellow metal passed the monthly PP to trade at 1,197.52 mark.
In regards to the near-term future, most likely, the yellow metal will surge upwards to the 1,200.00 level due to the support of the monthly PP at the 1,195.43 mark and the 200-hour and 100-hour simple moving averages.
In addition, none of the technical indicators may prevent the rate from the surge. However, today's US fundamental data sets could negatively affect the gold surge movement to push the rate to go back to trade at the 1,190.00 level.
EUR/JPY Analysis: Trades Below 50-Hour SMA
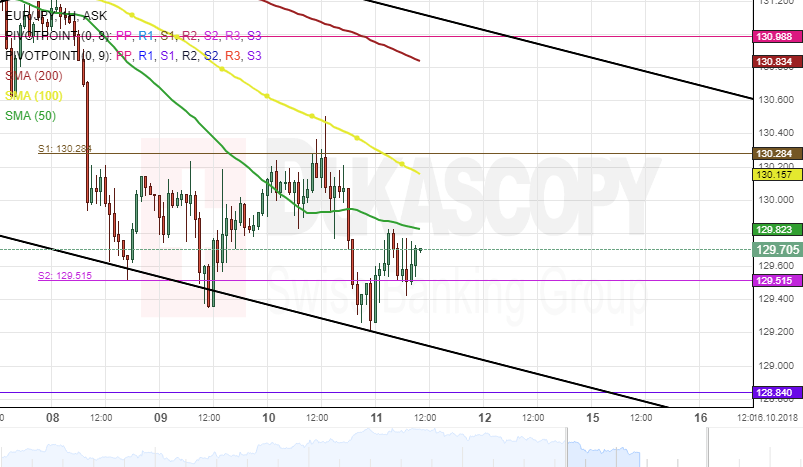
Downside momentum dominated the common European currency against the Japanese Yen on Wednesday. The exchange rate declined about 120 base points during the end of yesterday's session.
By the middle of Thursday's session, the currency pair was trading below the 50-hour simple moving average at 129.67. Furthermore, the weekly S2 at 129.51 was providing support for the pair during the morning hours of today's session.
If this support level as mentioned earlier holds, the currency exchange rate could make a brief movement towards a resistance cluster formed by the 100-hour SMA and the weekly S1 near the 130.28 regions during the following trading hours.
EUR/USD Analysis: Breaks Weekly PP
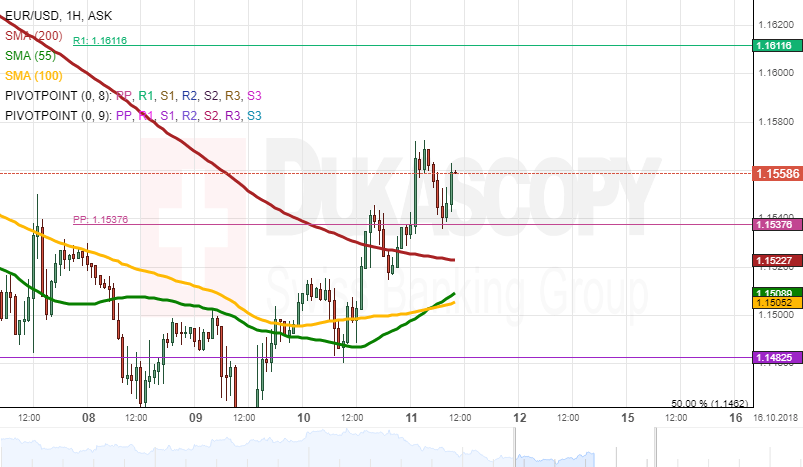
The European Single Currency appreciated 0.29% against the US Dollar since Wednesday's session. On Thursday morning, the currency pair broke the resistance of the weekly PP to trade at the 1.1541 mark.
In regards to the near-term future, most likely, the European Single Currency will trade upwards facing the weekly R1 at the 1.1611 level. The simple moving averages and the weekly PP at 1.1537 mark will support the rate during the day.
However, today's fundamentals news could push the rate to go downwards to the monthly S1 at the 1.1482 mark.
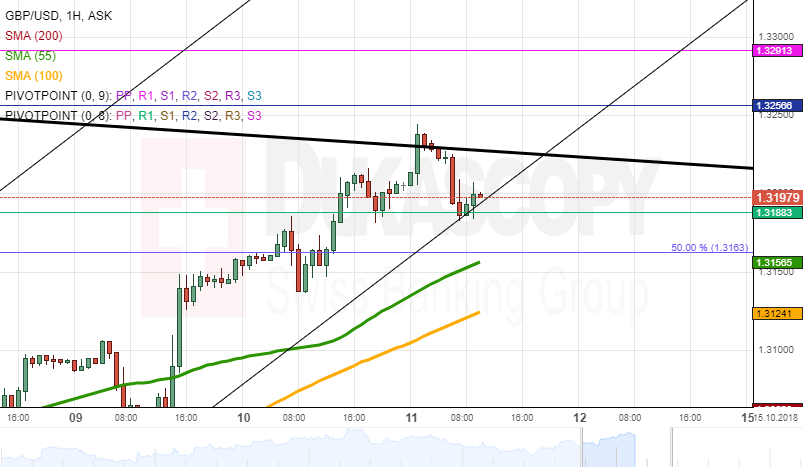
GBP/USD Analysis: Trades At 1.3180 Level
The British pound appreciated 0.33 % against the US Dollar since Wednesday's session. During Thursday morning hours, the British pound was trading between the weekly R2 and the weekly R1 at the 1.3196 mark.
In regards to the near-term future, most likely, the rate should bounce off the upper boundary of the large descending pattern to trade at the 1.3160 level during the day.
However, today's UK fundamental data sets may push the rate higher to break resistances to surge to the 1.3250 level on Thursday.
USD/JPY Analysis: Locates Near Weekly S3
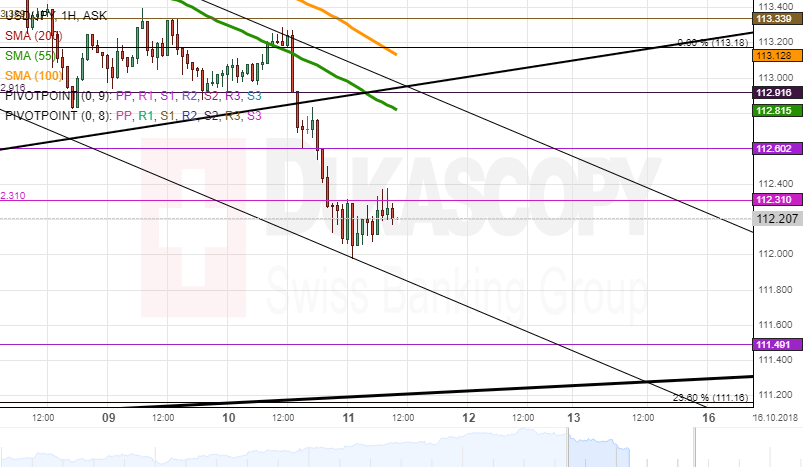
The US Dollar depreciated 0.50% against the Japanese Yen since Wednesday's session. On Thursday, the US Dollar was trading below the weekly S3 at the 112.29 mark.
In regards to the near-term future, most likely, the US dollar will trade downwards due to the resistance of the weekly S3 at the 112.31 mark. The simple moving averages will try to catch up the rate during the session. It is expected that the rate will trade at the 111.80 level on Thursday.
However, today's significant US fundamental data sets may break the prediction for this currency pair. Watch out for the news!
EUR/CHF 4H Chart: Remains Near Support Cluster At 1.1401
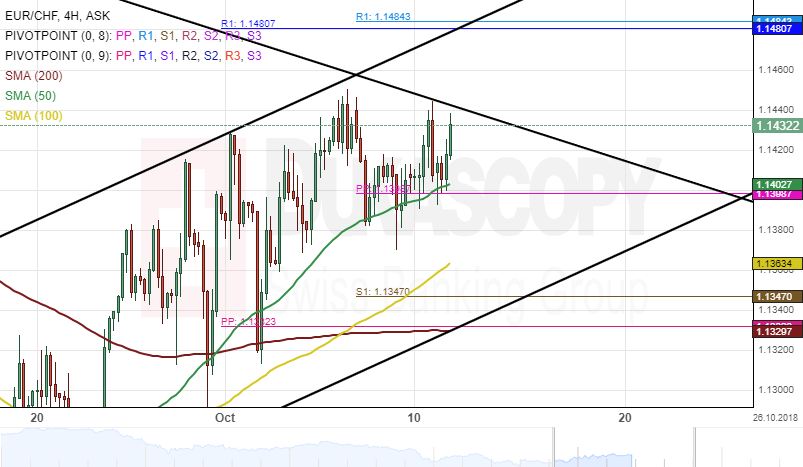
The common European currency has been trading in a long-term descending channel against the Swiss Franc. This movement began after the currency pair reversed from the upper boundary of the channel pattern at 1.1873 on May 15.
However, the exchange rate has increased its trading range during the past few weeks. Currently, the pair is trading near the up border of the long-term descending channel at 1.1450 and could be set for a breakout.
If a support cluster formed by the 50-hour SMA and the weekly pivot point at 1.1405 holds, the next target for the currency exchange rate will be 1.1484 during the following trading sessions.
USD/CHF 4H Chart: Breaches Support Level
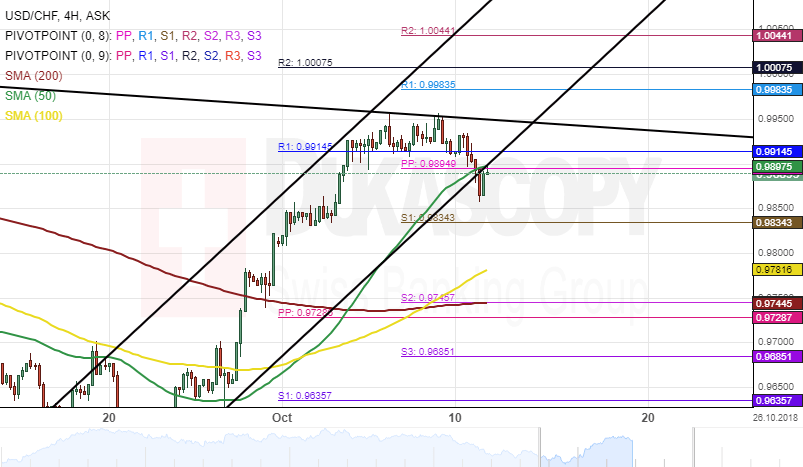
The US Dollar has been appreciating against the Swiss Franc after the currency pair reversed from the lower boundary of a narrow ascending channel at 0.9550.
The exchange rate breached the bottom border of the narrow channel at 0.9894 during the morning hours of Thursday's trading session. From a technical point of view, the next target for the currency exchange rate will be near the weekly support level at 0.9834.
If that support level as mentioned above holds, the USD/CHF currency pair will make a reversal north towards the weekly R1 at 0.9983 during the following trading sessions.
On the other hand, if the rate passes that support line, it could aim at the 100-hour SMA at 0.9776 within this session.
Chinese Export Data Eyed As US-China Relations Hit A Low Point
As the United States widens its criticism of China beyond the trade spectrum, investors will be looking to Chinese trade figures due on Friday for possible signs that the Trump administration’s attacks on the country are starting to weigh on the economy. So far, Chinese export growth has held up well following the introduction of US tariffs and counter levies by China in July. However, fears that the US and China are headed for a prolonged stand-off triggered a sell-off in Chinese stocks and the yuan on Monday as concerns rise for a possible slowdown in the world’s second largest economy.
Exports from China rose by 9.8% year-on-year in August, slowing marginally from 11.2% in July when the first round of tariffs was enforced. The impressive figures were most likely down to front-loading of shipments by companies before the different tranches of tariffs came into force. As those effects subside, export growth is expected to slow in the coming months. For September, analysts are forecasting that exports grew by 8.9% y/y, a notable slowdown from the prior month but still a healthy figure. Investors will be paying specific attention to the size of the trade surplus with the US, which in August, had hit a record high.
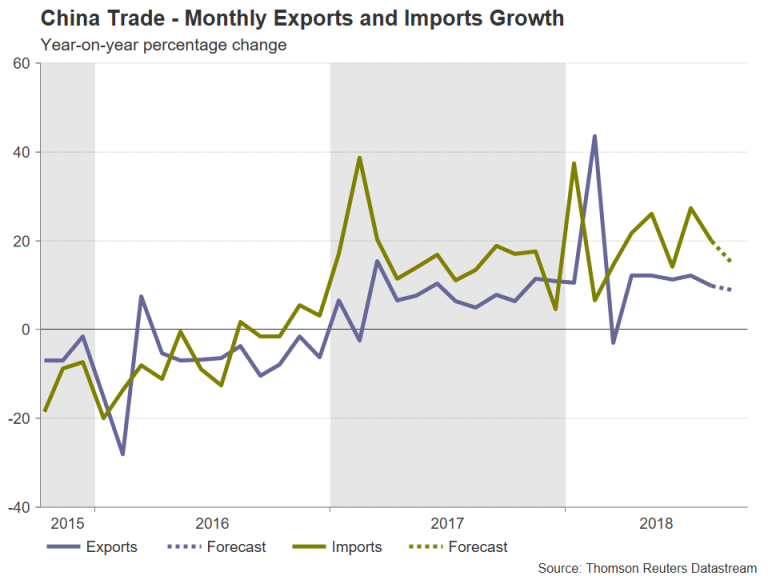
Imports will also be watched, as the data is seen as a good indicator of the strength of domestic demand. Imports were up a revised 19.9% y/y in August and are expected to ease to 15.0% in September. The overall trade surplus during the month is forecast to narrow to $19.4 billion.
Chinese authorities have stepped up fiscal and monetary stimulus measures in recent weeks as they attempt to bolster the economy, which is facing downside pressure from the increased US trade barriers and investment restrictions. While initially, many market participants remained optimistic that the two sides would eventually find a way to work through their differences, the unexpectedly strong criticism of China on a range of policy issues in recent days by US officials, including President Trump himself, has taken traders, as well as Chinese politicians, by surprise. This led to steep losses in China’s main stock indices when markets re-opened on Monday from a week-long holiday, recording declines in the range of 4%. Those losses extended into the week with the Shanghai Composite index plunging to the lowest since late 2014.
The yuan also came under renewed selling pressure, slumping to a near 8-week low of 6.9331 yuan per dollar this week. Should Friday’s figures miss expectations, the yuan could weaken further, while its liquid proxy, the Australian dollar, would also likely come under pressure.
Having touched a 32-month low of $0.7039 during the past week, that level poses an immediate support point for the aussie. If breached, the aussie could next head towards the $0.70 handle, which is the 138.2% Fibonacci extension of the September upleg from 0.7083 to 0.7314. A drop below this key level would bring into range the 161.8% Fibonacci extension at $0.6940.
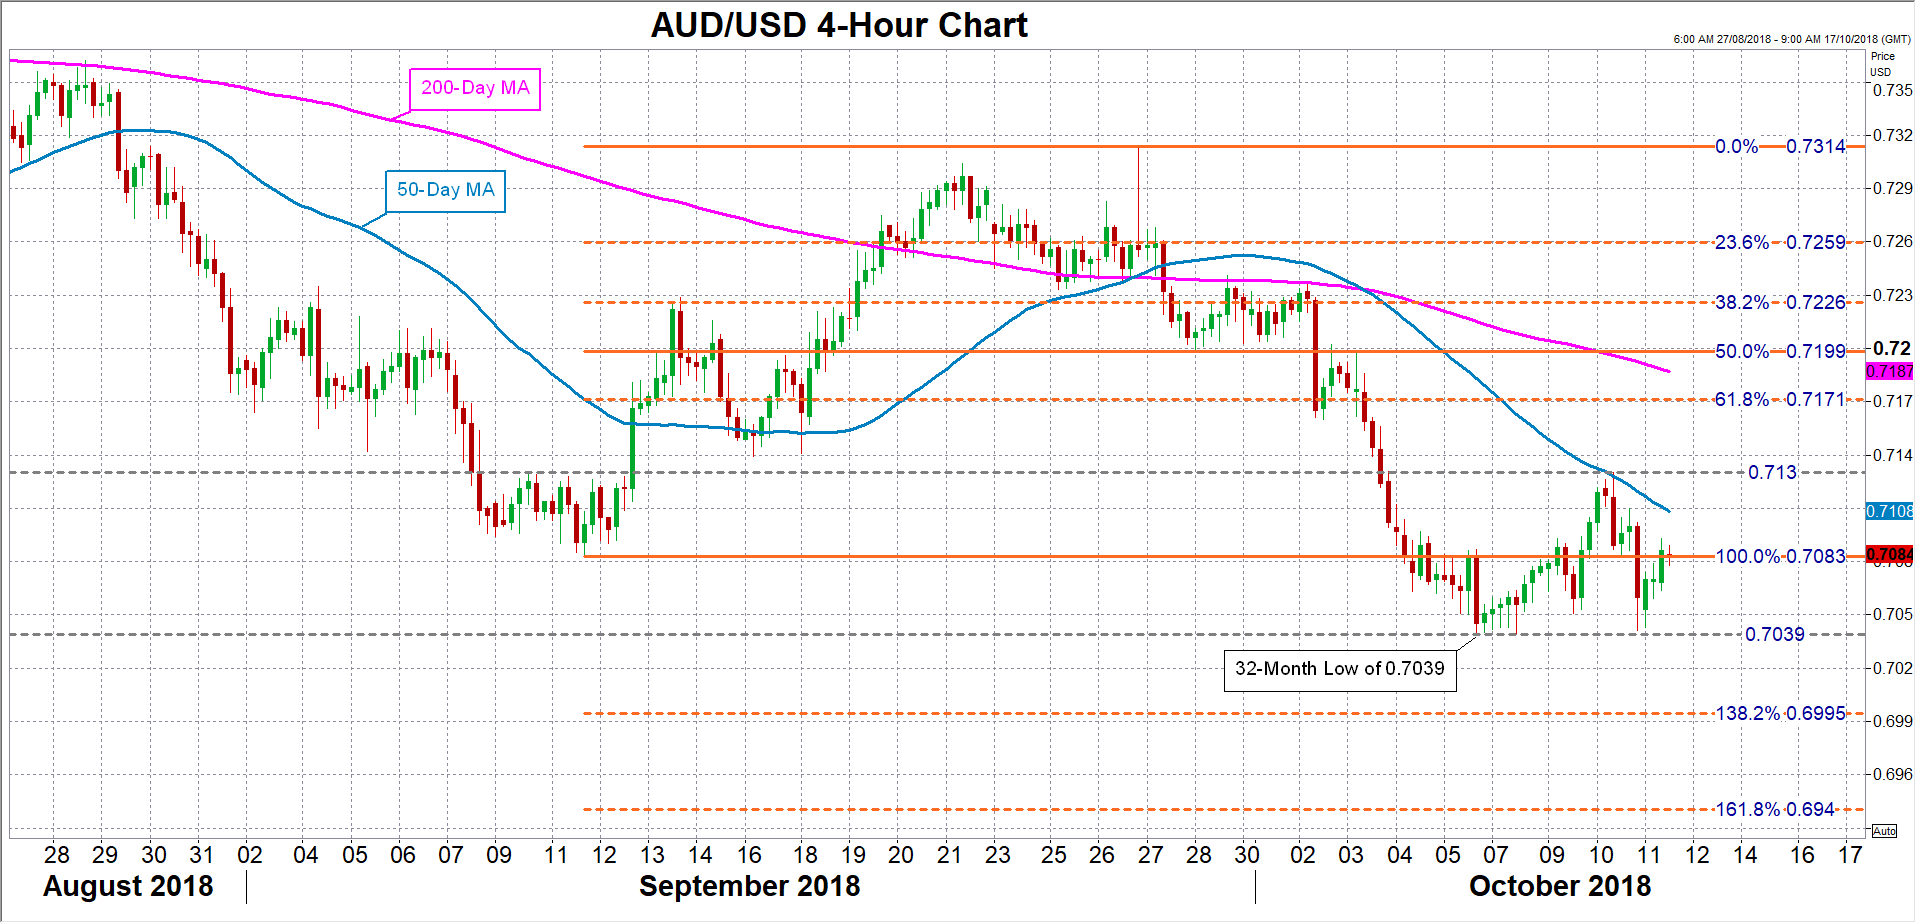
However, an upside surprise in the trade numbers would bring some relief to the markets and potentially trigger a rebound. The aussie could bounce back towards the $0.7130 level, which capped advances on Wednesday. However, it would first need to overcome immediate resistance in the $0.7085 region. Higher up, the 50% Fibonacci retracement at the $0.72 mark would be the next critical wall to break.
In the meantime, forex markets will be on edge for further headlines pertaining to US-China relations. President Trump and Vice President Pence recently accused Chinese authorities of meddling in the US mid-term elections, while a Bloomberg investigative report last week alleged that Chinese spies had placed tiny microchips in computer servers destined for US companies like Amazon and Apple (though this has not been substantiated by the US government). In a further blow for relations and for hopes of a quick end to the drawn-out trade dispute, there was a simmering in military tensions following a near collision between US and Chinese destroyers in the South China Sea.
DAX Slides As Asian Markets Sink
The DAX index continues to see red this week. In the Thursday session, the index is at 11,533, down 1.53% since the Wednesday close. In economic news, the ECB will release the accounts of the August policy meeting. Later in the day, the U.S Treasury publishes its semi-annual currency report.
Down, down and down. The downward spiral in global stock markets has turned into a bloodbath, with some European shares falling to 20-month lows. This is the DAX’s lowest level since February 2017. The DAX posted heavy losses overnight, as Asian markets dropped sharply, and has fallen 4.2% this week. The decline is apparent in all sectors, with all but a handful of companies in the red on Thursday.
Investors will be keeping a close eye on the ECB policy meeting accounts, looking for hints as to the timing of a rate hike next year. The ECB has stated that it will not raise rates before the “end of the summer”, which many analysts have interpreted as September 2019. However, that time period is not etched in stone, and the ECB could opt to raise rates earlier, if warranted by economic conditions. Besides inflation, ECB policymakers will have to weigh other factors such as the U.S-China trade war when deciding when to raise interest rates.
Will there be any surprises in the U.S Treasury currency report? The report provides details of global exchange rate policies, as well as a list of countries which are deemed currency manipulators. In the April report, the U.S did not name any of its major partners as currency manipulators. Since then, the Trump administration has imposed some $200 billion in tariffs on Chinese goods. China has retaliated with its own tariffs on U.S goods, and there has been speculation that China could respond to the U.S tariffs by devaluating the Chinese yuan in order to bolster Chinese exports. In 2015 and 2016, the markets dropped sharply on fears that China would implement a major devaluation of its currency. Traders should treat the report as a market-mover.