Sample Category Title
Fed Kaplan not advocating a pause after interest rate hits neutral
Dallas Fed President Robert Kaplan said he's based case is for Fed hike once more this year and twice next year. And he added that "mathematically there's at least a couple more increases" to get to his neutral rate of 2.50-2.75%. He also noted that he "not advocating a pause" from there. But rather, he'll "make that judgment as we go; I haven't decided yet."
Additionally he reiterated his view that GDP will grow 3% this year and slow to 2.5% next as impact of fiscal stimulus fades. Also, he warned that the tailwind from debt-funded stimulus could turn into a headwind in the out years.
Market Morning Briefing: Aussie Is Looking Near Term Bearish Towards Long Term Support Near 0.71
STOCKS
Dow (26773.94, +0.46%) has moved up and has closed above 26750. Although immediate resistance is visible near 27000 on the daily candles, there could be some sideways consolidation in the near term before the index moves higher. Note that 27000 is a crucial resistance and needs to break on the upside to ensure medium term bullishness.
Dax (12287.58, -0.42%) is stable below the 12400-12500 resistance and could probably remain so for some more sessions in the near term. While 12400-12500 holds, the index could come off towards 12100-12000 on the downside before again attempting to bounce higher. For now Dax looks stable to bearish for the near term.
Nikkei (24207.91, -0.26%) has seen a slight dip from levels above 24400. If the resistance on the weekly candles holds, Nikkei could see corrective fall towards 24000-23500 in the near term. Sustained rise above 24500 is needed to negate a fall back towards 24000 just now.
Shanghai (2821.35, -1.06%) is closed for the week and may move up towards 2850 next week when it opens after a week-long holiday.
Nifty (11008.30, +0.71%) bounced back well on Monday after testing a low near 10850. While immediate support near 10800 holds, Nifty is likely to move up eventually towards 11200. Near term is bullish while above 10800.
COMMODITIES
Overall commodities have risen and are trading higher.
Brent (84.85) and WTI (75.23) are rising sharply in line with our expectation. Brent and WTI could face immediate resistance near 85-86 and 76 levels respectively which could produce a short corrective dip in the near term for the Crude prices. A break above 86 and 76, if seen could be bullish taking Brent and Nymex WTI towards 90 and 78 respectively in the medium term.
Gold (1211.10) has risen well moving above 1200. It could test 1220 resistance and needs to break in order to continue its upmove towards 1230-1250 in the medium term. Watch important resistance near 1220.
Copper (2.8170) has risen a bit but is overall trading in the broad 2.75-2.85 region. Some more sessions could see a consolidation in the said range before eventually moving higher in the longer run.
FOREX
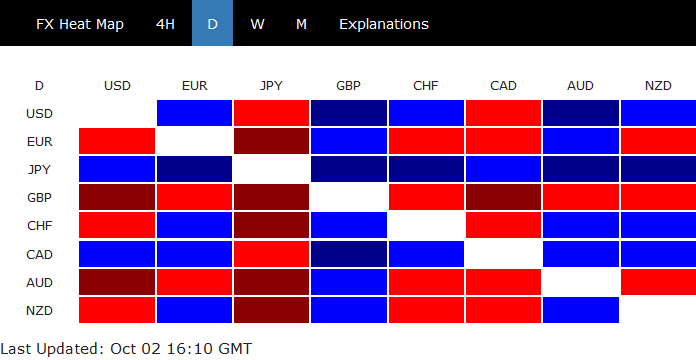
Euro, Yen, Pound and Aussie look near term bearish towards 1.14, 115, 1.28 and 0.71 respectively. Rupee might also weaken beyond 73 today.
Dollar Index (95.307) has immediate resistance near 95.75, as seen on daily candles and weekly line chart. Higher up, there is longer term resistance near 96.5. Expect a test of 96.5 by next week.
Euro (1.1582) is trading just above crucial horizontal support (1.151-1.153) on daily candles. On daily line chart, the horizontal support line near 1.156 has been broken and the Euro looks bearish. This bearishness is seen on weekly candles as well : possible downside target of 1.14 by next week.
Dollar Yen (113.79) is currently respecting resistance near 114 on daily candles and daily line chart. A further upmove towards resistance near 115 on weekly candles seems likely by next week.
Euro-Yen (131.796) is trading at support on daily candles near 131.0-130.75. Given that Euro could fall to 1.14 and Dollar Yen could rise to 115 by next week, Euro Yen might just stay stable above 131 till next week.
Pound (1.2995) : If support near current levels i.e near 1.2975 breaks, a fall towards lower support (1.280-1.275) might take place by next week.
Aussie (0.71803) is looking near term bearish towards long term support near 0.71 on weekly line chart, which it could test by next week.
Dollar Rupee (Monday on shore closing: 72.915; current offshore NDF: 73.36) : Looks like USDINR might cross above 73 in today's session as the NDF is already trading near 73.36. Sharp rise in the crude prices could initiate a session opening near 73 today. At the same time we should also be aware of the possibility of a near term rebound in Indian equities - which might be a source of strength for the Rupee.
INTEREST RATES
The trade deal between US, Canada and Mexico has restored some confidence in the markets and could be bullish for yields. However, erosion of confidence in Italian bonds might have a bearish effect on US and German yields.
The US 10 Year (3.069%) continues to stay below 3.10%. Looking at the charts, preference is for it to come off towards 3.0-2.9% in the medium term.
The 10 Year German-US spread (-2.644%) has broken below the crucial -2.55% support level. There is interim support now near -2.65%. However, on long term chart, it looks bearish towards atleast 2.70% in the weeks ahead.
The German 10 year yield (0.425%) has come off from resistance near 0.5% and could now see a drop till support near 0.3% in the next 1-2 weeks.
The Japan 30Yr (0.89%) is at long term resistance level near 0.90%-0.93%. If it breaks above this level, it could be bullish for shorter term Japanese yields as well.
Gold Price Approaching Key Resistance Near $1,210
Key Highlights
- Gold price recovered sharply and moved back above the $1,200 support against the US Dollar.
- There was a break above a bearish trend line with resistance at $1,197 on the 4-hours chart of XAU/USD.
- The UK Construction PMI in Sep 2018 declined from 52.9 to 52.1.
- The US ADP Employment figure for Sep 2018 will be released today, which is likely to increase 185K.
Gold Price Technical Analysis
After trading in a broad range above the $1,200 level, gold price started a downside move against the US Dollar. The price tested the $1,180 support and later bounced back above the $1,200 support level.
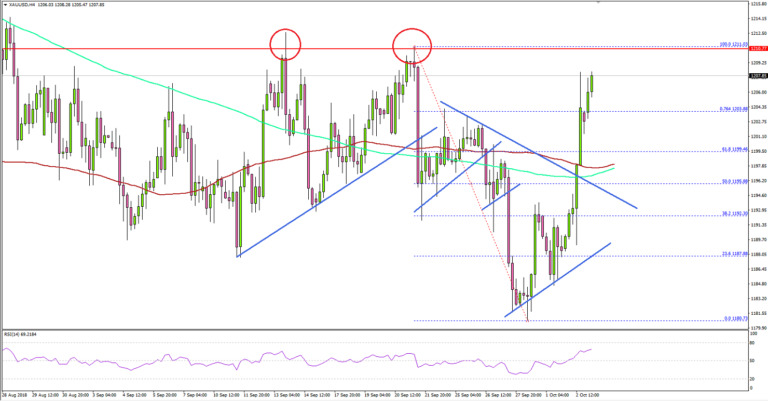
The 4-hour chart of XAU/USD indicates that the price was under pressure recently and it moved below the $1,185 support. It traded as low as $1,180 and settled below the 100 simple moving average (red, 4-hours).
Later, there was a sharp upward move and the price traded above the $1,200 level and the 50% Fib retracement level of the last decline from the $1,211 high to $1,180 low.
The price even settled above the 100 SMA, 200 SMA (green) and the 61.8% Fib retracement level of the last decline from the $1,211 high to $1,180 low. It seems like the price is back in a positive zone and it could continue to move higher.
On the upside, there is a strong barrier around the $1,210-1,211 zone, which acted as a resistance on multiple occasions. Buyers need to push the price above $1,211 to accelerate gains towards the $1,220 level.
If they fail, there could be a downside correction towards the $1,204 and $1,200 support levels. The most important support is near $1,197 and the 100 SMA.
Looking at major pairs like EUR/USD and GBP/USD, there were mostly bearish moves. The Euro declined below the 1.1550 support and the British Pound broke the 1.3025 support area against the US Dollar.
Economic Releases to Watch Today
- Germany’s Services PMI for Sep 2018 – Forecast 56.5, versus 56.5 previous.
- Spanish Services PMI for Sep 2018 – Forecast 52.9, versus 52.7 previous.
- Euro Zone Services PMI for Sep 2018 – Forecast 54.7, versus 54.7 previous.
- UK Services PMI for Sep 2018 – Forecast 53.9, versus 54.3 previous.
- US Services PMI for Sep 2018 – Forecast 53.6, versus 52.6 previous.
- US ADP Employment Change Sep 2018 – Forecast 185K, versus 163K previous.
- US ISM Non-Manufacturing Index for Sep 2018 – Forecast 58.0, versus 58.5 previous.
US Markets Rescue Global Risk Sentiment Yet Again
US Markets
It seems we can rely on the US markets to bail out souring Global risk sentiment again and again. But the question should be, how long can we expect this to continue.
Almost like clockwork, The Dow Jones Industrial Average hit a record high on Tuesday feeding off investors optimism around global trade as the USMCA framework does remove at least one massive tariff related risk from the global financial market. I wouldn’t’ go as far as saying the markets are any less worried about China trade issues, however, but investors are breathing one big sigh of relief that a significant barrier to global free trade has fallen. And indeed, just as significantly it allows the US administration to now focus exclusively on its escalating economic dispute with China.
Oil Markets
Oil traders came up for air ahead of today’s API inventory report, while analysing production data for September, including Russian output that increased 150,000 bpd last month to a record 11.36 million barrels per day.
However, prices remain near four-year highs supported by the plethora of bullish narratives, Iran sanctions, Saudi Arabi capacity concerns and China refinery Iranian compliance.
The API inventory data has triggered a muted reaction of sorts. The American Petroleum Institute figures for the week ended September 28 included a slightly smaller 0.9 mmbls build in US commercial crude stocks, but a larger-than-expected 2.0 mmbls increase at the Cushing, Oklahoma delivery point for NYMEX WTI crude oil futures. A bit of a saw off indeed but would probably be interpreted as a touch bearish if not for the dominant bullish narrative, given the market assumed lower shale output.
NOPEC
Also given the markets are thinking that OPEC or more specifically Saudi Arabia is either powerless or unwilling to stop oil from hitting $100 per barrel there has been increased focus on NOPEC.
Reuters
It’s apparent that, next to China trade, OPEC is the president’s biggest bugbear based on his frequent criticism of the Organization of the Petroleum Exporting Countries.
US Lawmakers have already introduced a version of the “No Oil Producing and Exporting Cartels Act,” or NOPEC, in May to address what US Congress believes is OPEC price rigging.
Various iterations of the of the bill have been tabled since 2000, but both George W. Bush and Barack Obama threatened to use their veto power to halt it from becoming law given the stratic important of Saudia Arabia in maintaining peace in the middle east. However, the considerable tail risk for oil prices is that President Trump could break with this president to deflect the knock-on effect of his administration’s foreign policy, ahead of midterm elections, which has effectively resulted in higher oil prices.
Regardless, oil traders are writing this off as idle banter given Saudi Arabia strategic importance in the middle east. But just as significantly using the US judicial system as an aggressive form of market intervention, sends off horrible signals to investors, not to mention the massive US oil and gas industry.
Gold Markets
Gold prices have been aggressively rallying overnight. Rather odd that the USD is not leading this move that has triggered a significant and very convincing short squeeze. Remember that according to CFTC data GOLD speculative net positioning increased to its highest since December 2001 as prices declined for a sixth straight month in September. Accounts sold an additional 6,804 contracts in the week to September 25, according to the latest CFTC data published last Friday, bringing total net short positions to 17,648, the most since the week of December 11 2001.
Gold has moved higher overnight primarily driven by the return of safe-haven appeal, keeping Italy risks in mind. Interesting I was discussing that fact yesterday, that in the past when we were not dealing with a strong USD narrative, Gold would pop $15-20 higher in a heartbeat on EU contagion fears. Sometimes, it’s easy to be blind to the facts, especially when getting so accustomed to positioning gold off the US dollar moves. But with tightness in Copper markets influencing the base metal complex higher. There’s likely some knock-on effect from that correlation as well; indeed, shorts are being caught out on this one, and weaker near-term stops above $1200 level are probably contributing the flow. But for a specific technical trigger, commodity traders were focusing a Gold cross currency relationship, and it was the break of Gold vs EUR 1030 that triggered the short position carnage.
Currency Markets
The Euro
Claudio Borghi is the head of the budget committee in Italy’s lower house and unsettled markets by saying Italy would have solved fiscal problems with its currency. Indeed “Italexit” concerns have triggered a massive wave of risk aversion, but one would think the EURO should be trading much lower. Sometimes trader psychology can win over logic near-term, as traders get antsy about the risk-reward of selling EURUSD below 1.1500. I think the NFP along with US market absorbing the waves of risk aversion is causing some traders to profit take on shorts. However, is we do break the 1.1500, on full blow Italy risk, all hell could break loose, and the EURUSD could easily topple to the 1.1300 handles.
The Japanese Yen
The yen is strengthening on risk aversion but comfortable holding above secondary support levels buffeted by US interest rate differentials
The Malaysian Ringgit
Asia risk sentiment trades poorly as a toxic elixir of weaker China PMI, stronger USD and escalating geopolitical tension in the South China Sea. And factoring in the Italy risk, and slightly lower oil prices, we should expect the Ringgit to trade with a defensive posture today.
Eco Data 10/3/18
[php_everywhere instance="1"]
British Pound Dips Below 1.30 as Construction PMI
GBP/USD has posted considerable losses on Tuesday. In the North American session, the pair is trading at 1.2992, down 0.37% on the day. On the release front, British Construction PMI dipped to 52.1, short of the estimate of 52.8 points. There are no major U.S events. On Wednesday, the UK releases Services PMI, and the U.S publishes two key events – ADP nonfarm payrolls and ISM Non-Manufacturing PMI.
British PMIs, which are highly regarded gauges of economic activity, have been mixed this week. Manufacturing PMI improved to 53.8, above the estimate of 52.6 points. However, Construction PMI fell from 52.9 to 52.1, missing the estimate of 52.8 points. The construction release was the weakest in six months, and the survey found that some construction firms were concerned that soft economic conditions were having a negative impact on their growth. Brexit remains a constant worry in the business sector, as the uncertainty as to whether a deal will be reached between the UK and the European Union continues to dampen sentiment over the British economy.
In the U.S, Friday’s consumer data reflected strong confidence in the U.S economy. Consumer spending rose 0.3% in August, matching the forecast. The UoM Consumer Sentiment report pushed above the 100-level for the first time since March, although the reading of 100.1 missed the estimate of 100.5 points. On the inflation front, the Core PCE Price Index, which is the Federal Reserve’s preferred inflation indicator, dipped to 0.0% in August, shy of the estimate of 0.1%. This was the first time the indicator failed to post a gain since March 2017. Still, inflation remains close to the Fed’s target of 2%, so a December rate hike remains likely.
Mid-US Update: DOW hits record, Gold back above 1200, German-Italian spread breaks 300
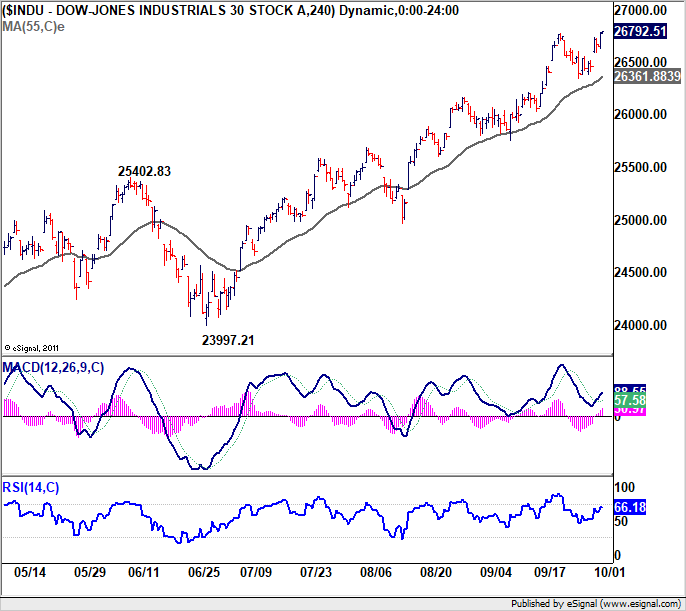
The forex markets are relatively dull in the first half of US session, comparing to other markets. DOW extends recent up trend and hit another record high at 26793.35. Based on current momentum, more lies ahead. At the time of writing, DOW is up 0.52%, S&P 500 and NASDAQ lags behind, up only 0.19% and 0.15% respectively. Treasury yield are soft today with 10 year yield down -0.026 for the moment.
Fortune of European stocks is the opposite. FTSE closed down -0.28%, DAX down -0.42%, CAC down even deeper by -0.71%. German 10 year bund year dropped -0.0516 to 0.424. Italy 10 year yield rose 0.1369 to 3.442. That is, German-Italian yield spread is at 3.018, larger than 300 finally.
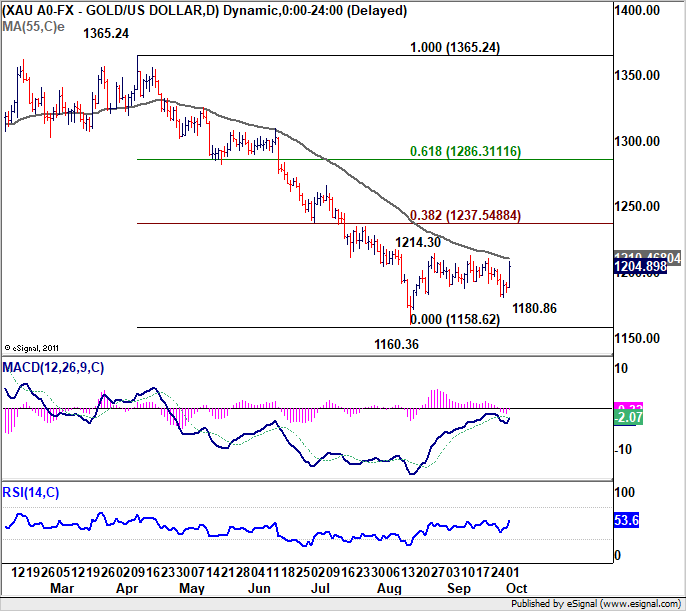
Gold stages a strong rebound and is now back above 1200 handle. Current development suggests that prior dip to 1180.86 was just part of a near term correction pattern. Focus is immediately back to 1214.30 resistance. And break will resume the medium term rebound from 1160.36.
In the forex markets, Yen remains the strongest one for today, followed by Canadian Dollar. Sterling and Australian Dollar are the weakest ones. Strength in Gold is in a way pressuring Dollar and we might seen some more downside in the greenback before the US session ends.
AUDJPY Looking Less Bearish after Recent Gains
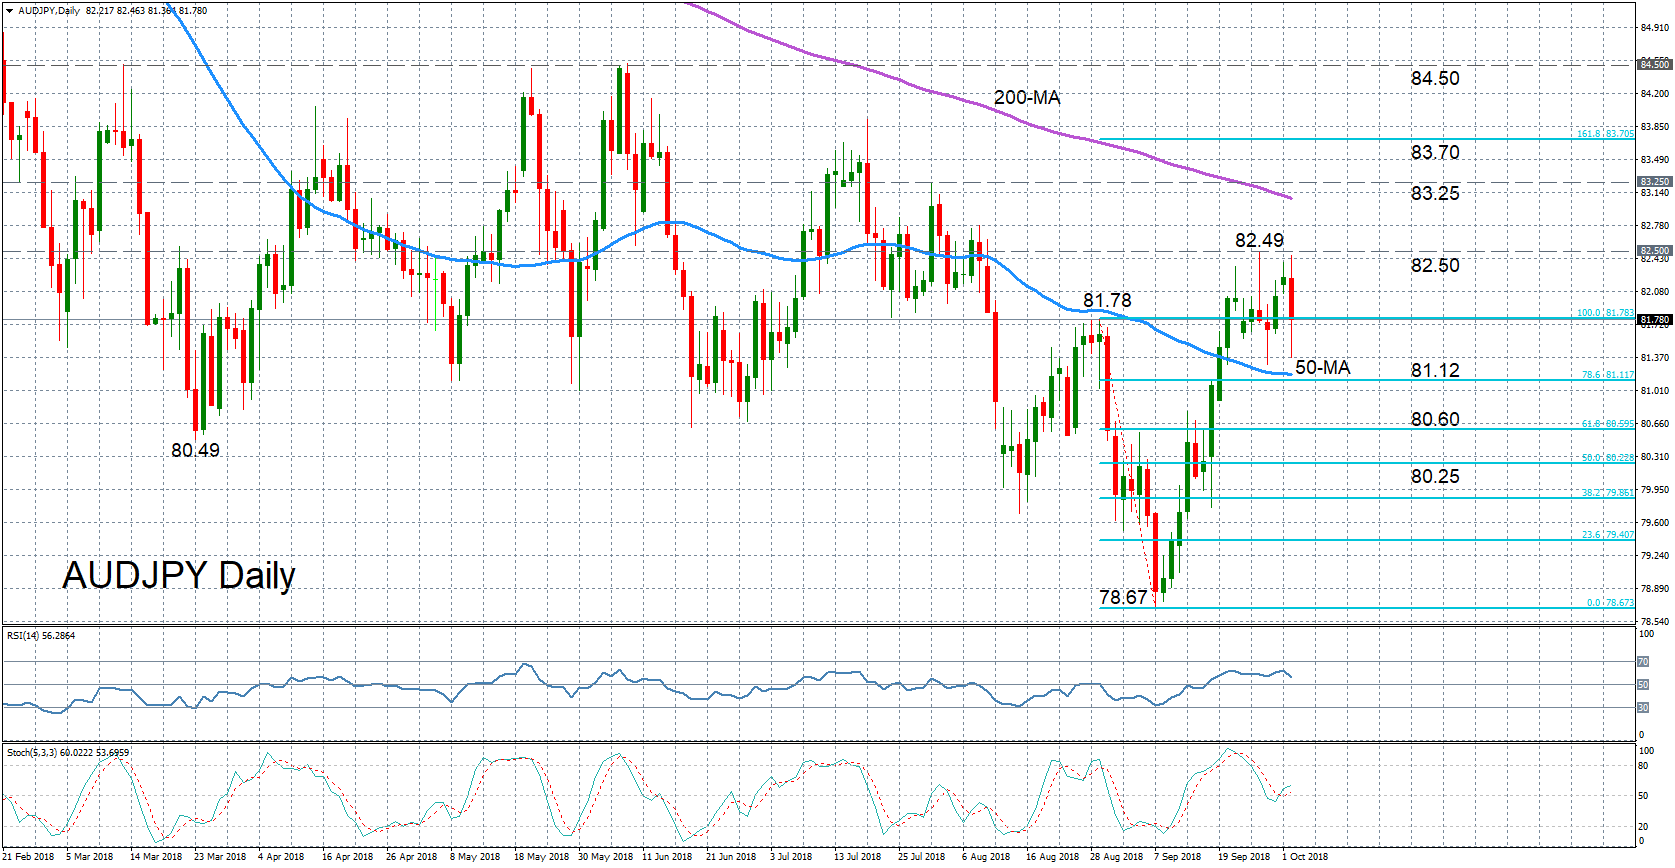
AUDJPY has posted a strong rebound from the 22-month low of 78.68 hit on September 7, making a higher high in the process. However, the pair hit a wall at just below the 82.50 level, putting into doubt the sustainability of the latest uptrend as technical indicators have since weakened.
The RSI is pointing down, having peaked at below the 70-overbought level, but it remains comfortably in positive territory. The stochastics have turned higher again, with the %K line recording a bullish crossover with its %D line, though the upside momentum is weak.
Should the pair manage to break above the nearest resistance at 82.50, a reach for 83.25 (taken from the July 31 high) could be possible. A jump higher would take prices towards the 161.8% Fibonacci extension of the downleg from 81.78 to 78.67, at 83.70. Further gains would see the 84.50 level coming into range, which acted as strong resistance in May and June.
If today’s losses were to be extended, however, support is likely to come from the 78.6% Fibonacci retracement of 81.12. The 78.6% Fibonacci level is just below the 50-day moving average so a drop below it would shift the focus back to the downside. Deeper losses would bring into view the 61.8% and 50% Fibonacci levels, at 80.60 and 80.23, respectively. A breach of the 50% Fibonacci could accelerate the declines towards the 22-month low of 78.68, risking a resumption of the longer-term downtrend.
In the more medium-term picture, the bearish outlook has eased substantially following the bounce in price action back above the 50-day moving average.
Japanese Yen Edges Higher, ADP Payrolls Next
USD/JPY has edged lower in the Tuesday session, erasing the losses seen on Monday. In North American trade, the pair is trading at 113.65, down 0.27% on the day. On the release front, Japanese consumer confidence remains weak, coming in at 43.4 points. This beat the estimate of 43.0 points. There are no major releases out of the United States. On Wednesday, the U.S releases two key events – ADP nonfarm payrolls and ISM Non-Manufacturing PMI.
In the U.S, consumer spending and confidence levels remain strong. Consumer spending rose 0.3% in August, matching the forecast. The UoM Consumer Sentiment report pushed above the 100-level for the first time since March, although the reading of 100.1 missed the estimate of 100.5 points. On the inflation front, the Core PCE Price Index, which is the Federal Reserve’s preferred inflation indicator, dipped to 0.0% in August, shy of the estimate of 0.1%. This was the first time the indicator failed to post a gain since March 2017. Still, inflation remains close to the Fed’s target of 2%, so a December rate hike remains likely.
The escalating trade war between U.S and its major trading partners has left the Japanese automobile sector particularly vulnerable, as that industry is highly dependent on open, tariff-free borders. On a positive note, Japan and the U.S have agreed to start trade talks, which will keep Japan’s auto sector protected from U.S tariffs, at least for the time being. President Trump has vowed to redress the $69 billion trade surplus that Japan has with the U.S., although Japan has balked at signing a free trade deal with the U.S, as it prefers a multilateral trade agreement. However, Trump has just signed free trade agreements with Canada and Mexico, and can be expected to insist on a bilateral pact with Japan.
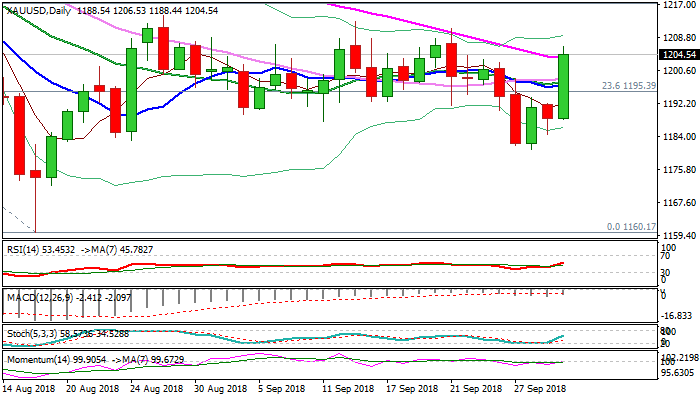
Gold Surges above $1200 as Italian Budget Issue Hits Markets
Spot Gold accelerated strongly higher in early American session Monday, gaining nearly 1.5%, in the biggest daily rally since 24 Aug, driven by fresh safe-haven demand on rising concerns about Italy’s budget issues.
The yellow metal price surged through the base of thick daily cloud ($1191) which capped action in past three days and took out converged daily MA’s ($1197/98), to extend gains above psychological $1200 barrier.
Fresh rally also cracked barrier at $1203 (falling 55SMA), confirming fresh strong bullish stance.
Regaining strong safe-haven appeal after hawkish Fed inflated the greenback, could drive gold price higher to challenge key barriers at $1214 (28 Aug high) and $1217 (Fibo 38.2% of $1309/$1160 fall).
Bulls need confirmation on close above $1200 level to generate bullish signal for further advance.
Strengthening momentum studies, which made bull-cross and is about to break into positive territory, support scenario.
Broken converged 10/20/30MA’s now turned to solid supports ($1198/97) which are expected to contain potential dips and keep bulls in play.
Res: 1206; 1211; 1214; 1217
Sup: 1203; 1200; 1197; 1193