Sample Category Title
Tariffs’ Lessons So Far: Proceed with Caution
Executive Summary
In the first of a two-part series, we analyze the effects that American tariffs on softwood lumber, washing machines and steel have had on prices, output and employment in those industries. The analysis of early data may shed some light on the potential effects that recently enacted tariffs on $200 billion worth of Chinese imports may have on those industries in the United States. Tariffs have raised prices in the affected industries. However, outside of that intuitive point, the conclusions are not perfectly clear cut because we find modestly negative effects on output and employment in some, but not all, of the industries we analyze. Admittedly, it may be too soon for the effects of the levies to be fully reflected in industry output and employment, and we acknowledge that those variables could be affected by factors other than tariffs. We will update our data-based approach to this topic as information becomes available. In the meantime, it may ultimately prove difficult to make sweeping generalizations about the industry-specific effects stemming from levies on $200 billion worth of Chinese imports that have recently been enacted.
Revisiting the Costs of a Trade War
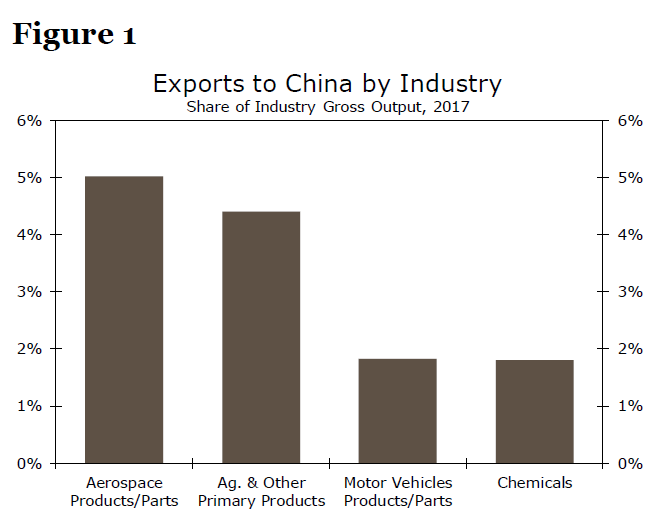
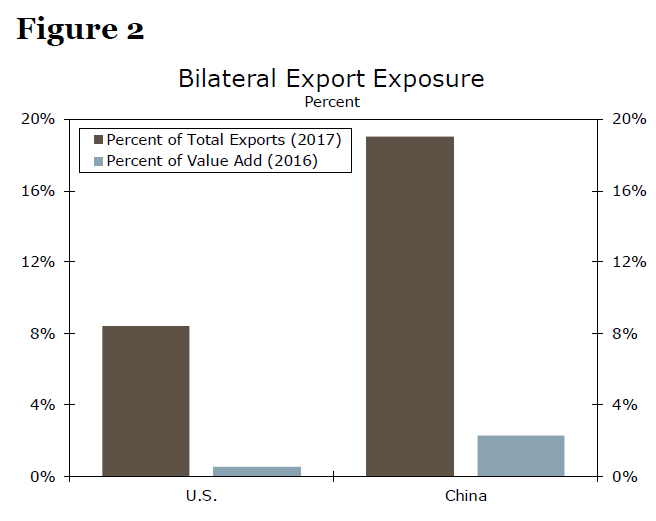
As international trade tensions were beginning to escalate in April, we wrote a report considering how costly a full-blown trade war would be.1 At the time, the United States had announced plans to impose tariffs on $50 billion worth of Chinese imports and China had retaliated in kind. We noted in that report that the business environment would be more challenging for some American industries (Figure 1). But a full-blown trade war, "would not necessarily bring the U.S. economy to its knees, due to the relatively small amount (in terms of overall value added) that the United States exports to China." Indeed, China has more to lose. The United States sends less than 10% of its exports to China; nearly a fifth of China's exports are destined for the United States (Figure 2).
But we acknowledged that the overall effect on the U.S. economy could be greater than just the direct effects of the tariffs on exports and imports. That is, there could be indirect "second-order" effects from a trade war. While difficult to measure precisely, some examples of second-order effects include depressed business fixed investment due to uncertainty, a decline in the stock market, which would negatively affect household wealth, and retaliatory selling of U.S. Treasury securities by the Chinese government, which could push up long-term interest rates in the United States.
Nearly six months on, we believe that it is time to re-examine our analysis in light of recent developments. Namely, on September 24, the United States imposed tariffs on another $200 billion worth of Chinese imports, and China retaliated by targeting an additional $60 billion worth of American exports. In the first of a two-part series, we focus on American imports and analyze what has happened to prices, output and employment in industries that have been directly and indirectly affected by higher tariffs. Are there any lessons for the industries that will be affected by the most recent tariffs from the import taxes that have already been enacted? In a follow-up report, we will analyze the effects on U.S. exports from the already enacted Chinese tariffs as well as any fallout from the aforementioned second-order effects.
Early Lessons from Initial Tariffs
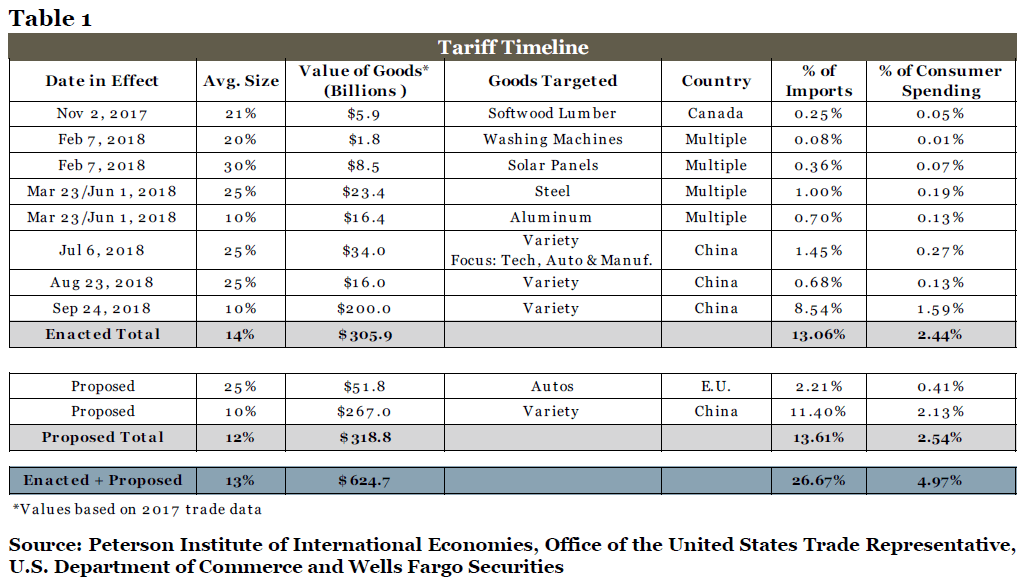
The initial forerunners in the current trade skirmish include the tariff on $5.9 billion worth of softwood lumber imports from Canada that was imposed in November 2017, the import tax on washing machines that was levied in February and the tariff on solar panels that also went into effect in February (Table 1). What effects have these trade restrictions had on prices, output and employment in those industries?
Logjam: The Effects of Softwood Lumber Tariffs
The levy on softwood lumber imports from Canada was telegraphed several months in advance. Commerce Secretary Wilbur Ross announced the import taxes in April 2017, seven months before they eventually went into effect. What have been the measurable direct effects of these tariffs, and what might they tell us about the potential effects of the more recent and broader trade restrictions?
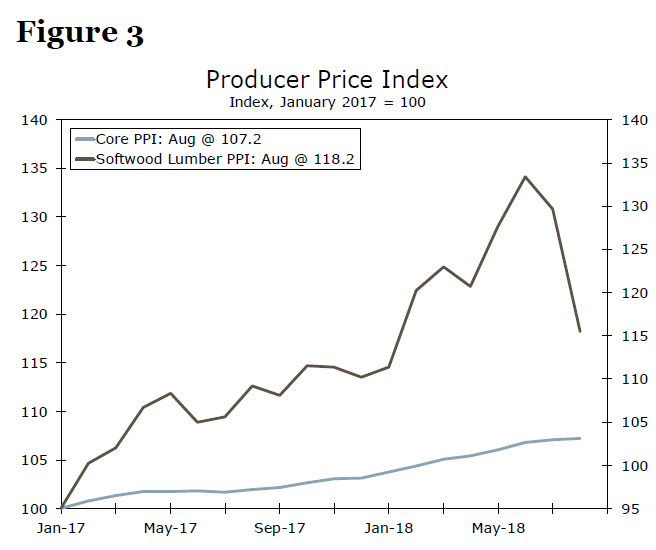
In Figure 3, we plot wholesale prices for softwood lumber from the PPI report against the broader measure of the core PPI since the start of 2017. Prices for softwood lumber outpaced the core PPI through 2017, but the former surged in early 2018 as the tariffs kicked in. Although lumber prices have subsequently come off the boil, due in part to some softness in residential construction, it seems obvious that the tariff caused lumber prices to jump more than wholesale prices in general. In a statement articulating its opposition to the latest $200 billion in new levies, the National Association of Homebuilders estimates that the lumber tariffs have added thousands of dollars to the cost of a typical single-family home2. Not only have prices of raw lumber increased, but prices of wood products, which is a "downstream" industry, have risen more than overall wholesale prices—12% versus 7%—since early 2017.
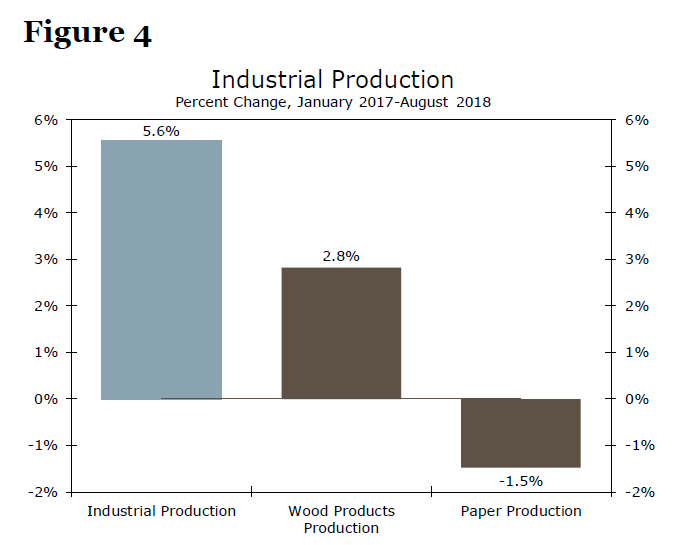
Unfortunately, data on U.S. production of softwood lumber are not readily available. Overall, industrial production (IP) has risen 5.6% since January 2017, while production of wood products, which is a downstream industry, is up by only half that amount (Figure 4). Production of paper (another downstream industry) is down 1.5% over the same period. In short, the tariffs, which raised the price of lumber, may have weighed on production in downstream industries such as wood products and paper, although other factors may have negatively affected production in those industries. Moreover, the levies do not seem to have had an adverse effect on employment in downstream industries, at least not yet. Employment in the wood products industry is up 1.7% since January 2017, which is less than the 2.9% rise in private sector payrolls, while employment in the paper industry has risen 2.5%.
Spin Cycle: The Effects of Washing Machine and Solar Panel Tariffs
Unlike the levies on softwood lumber, which had a long lead-time and consequently a more gradual reaction in economic statistics, the tariffs on washing machines and solar panels were announced at the end of January and went into effect just a few weeks later on February 7. The upshot is that we have a clear starting point for measuring the tariffs' effects on these two industries. We also have six months of data from which to make some initial assessments of their effect.
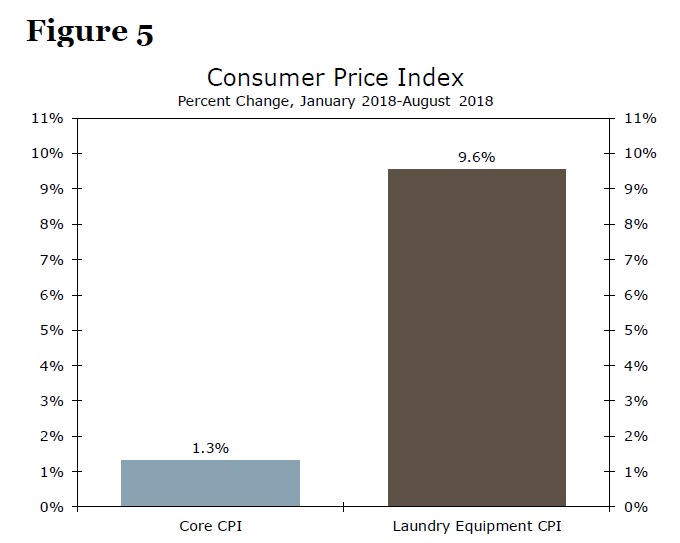
Time-series data on prices, output and employment in the solar panel industry are not readily available, but we were able to source some of this data for the laundry equipment industry, which includes washing machines.3 As was the case with the import tax on lumber, the data reveal a significantly higher increase in prices of laundry equipment than the broader measure of consumer prices. Prices for laundry equipment rose about 10% between January and August, which is significantly more than the 1.3% increase for core consumer prices (Figure 5).
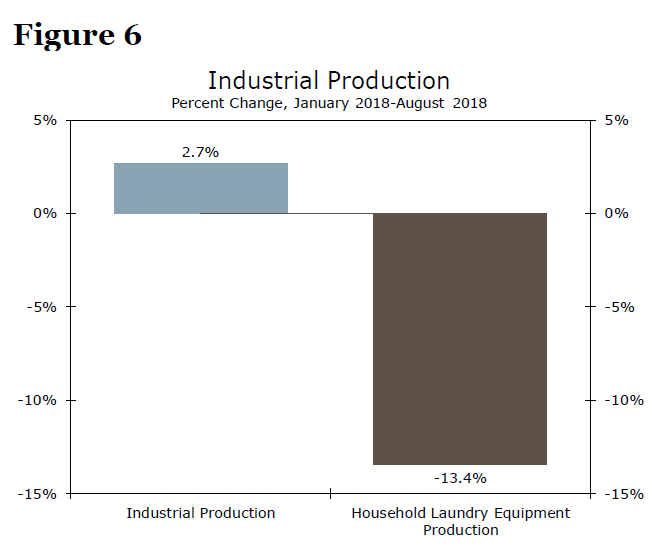
So if washing machines are costing households more, is there a bright side? Are we at least making more appliances in the United States than we were before the tariffs? Unfortunately not. As shown in Figure 6, production of household laundry equipment has nosedived more than 13% since the tariffs on washing machines were levied at the end of January, while overall IP has risen 2.7% over that period. Although production of washing machines in the United States may eventually recover, the short-run effects of the tariffs on those products seem to have lifted prices while depressing production. Data on employment in the washing machine industry or in the broader laundry equipment industry are not readily available, but a significant increase in payrolls in these industries does not seem very likely in light of the nosedive in production that has occurred in the laundry equipment industry.
Paying the Iron Price: Effects of Iron and Steel Tariffs
Imports of softwood lumber, washing machines and solar panels total about $16 billion, which represents less than 1% of total imports. The administration has also levied tariffs on steel and aluminum, imports of which total about $40 billion (1.7% of total imports). Although a bit more meaningful in terms of overall imports, the levies on steel and aluminum have not been in effect as long as the tariffs on lumber, washing machines and solar panels, which gives us a shorter timeframe to assess their effects. The levies on steel and aluminum tariffs went into effect the last week in March, at least nominally. Carve-out exemptions applied to a number of U.S. trading partners until those measures expired on May 31. So one could reasonably argue the steel and aluminum tariffs did not go into full effect until June, but the effects of those trade restrictions have been unmistakable ever since March.
Between February and August, the core PPI rose 2.7%, but iron and steel prices are up nearly 11% over that period (Figure 7). But this significant increase in iron and steel prices does not seem to have had much of a stimulative effect on domestic production of those goods, as theory suggests that it should. Since February (the month before the tariffs started to go into effect), domestic production of steel is up 2.1%, which is in line with the increase in overall IP (Figure 8). Despite this increase in production, however, employment in the raw steel industry is down 1.3% since February, an extension of a decades-long decline that may have as much or more to do with automation as it does with globalization. About 86,000 individuals work in iron and steel mills in the United States today, roughly half of the number of workers employed in that industry in 1990.
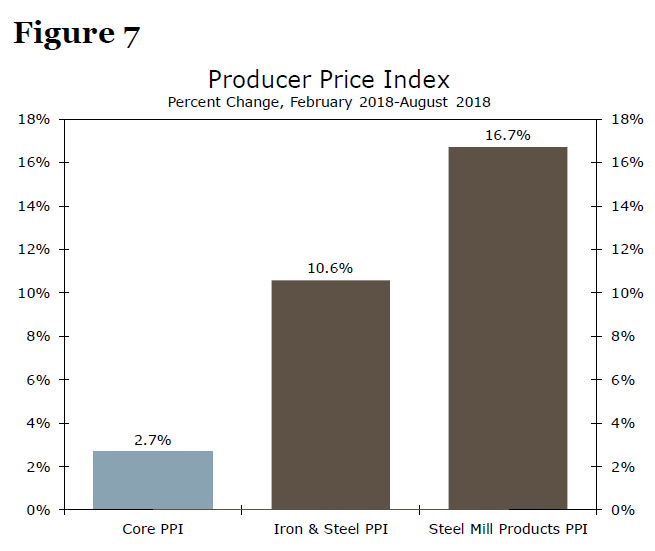
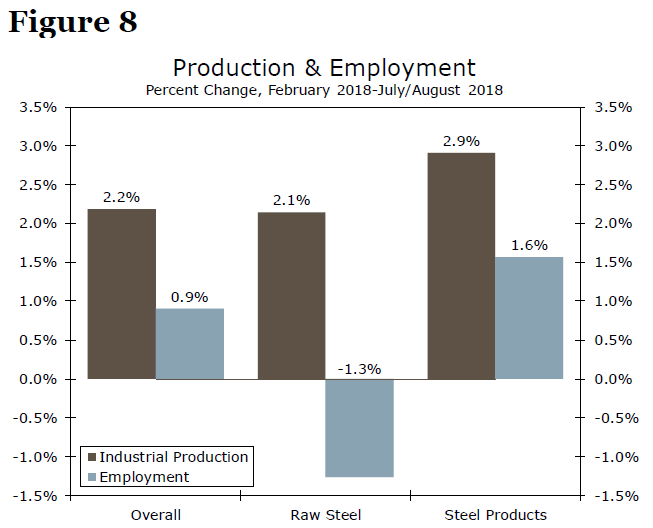
Moving downstream to the steel products industry, which makes goods from raw steel, price are up a whopping 17% since February (Figure 7). But despite this significant increase in input costs, production in the steel products industry has outpaced the increase in overall IP, while employment in the industry has risen more than total private sector employment since February (Figure 8).
Can We Say Anything Conclusive About Effects of Tariffs?
The administration also imposed tariffs on a variety of Chinese goods, whose value totals $50 billion (Table 1), but these levies have not been in place long enough yet to allow us to say anything meaningful about their effects. So can we say anything in general about the effects that tariffs have had on prices, output and employment in the lumber, washing machine and steel industries? Are there any general lessons that we can learn that are applicable to other industries that recently received tariff protection?
What is clear is that tariffs raise prices in the affected industries more than the general price level, which is probably an obvious point. Prices of softwood lumber, washing machines and steel have all moved significantly higher than overall wholesale prices or consumer prices since the imposition of tariffs on those industries. But the effects on output and employment are less clear. Whereas output in the laundry appliance industries tanked after import taxes were imposed on washing machines, output in the steel industry seems to have been little affected, at least so far. The employment record is mixed as well. Output and employment in specific industries have been affected by factors other than tariffs. Moreover, the levies did not go into effect until recently, so maybe it is just too soon to make general conclusions about the effects of specific tariffs.
Conclusion
The administration has enacted tariffs on more than $300 billion worth of imports since last November. However, levies have been in place long enough to allow us to say something meaningful about their effects on only $56 billion of these imports. By definition, tariffs clearly raise the domestic price of the goods in the affected industries. Outside of that intuitive point, we find modestly negative effects on output in some, but not all, of the industries that we analyze. We acknowledge that it may still be too soon for the effects of the tariffs to be fully reflected in industry output and employment, and we recognize that those variables are affected by factors other than just tariffs. Therefore, it may ultimately prove difficult to make sweeping generalizations about the industry-specific effects stemming from levies on $200 billion worth of Chinese imports that have recently been enacted.
When we wrote our initial report six months ago, we concluded that the "first order" effects of a trade war would not be large enough to push the U.S. economy into recession. We stand by that conclusion. However, it also seems that the first order effects on the industries that received tariff protection are modestly negative, at least so far. In the September ISM survey, four individual respondents cited the tariffs as a hindrance to their business or industry. We will continue to monitor developments to see if we can eventually draw more meaningful conclusions. In the meantime, we will turn our attention to the "second order" effects of American tariffs and the effect of Chinese levies on U.S. exports. We will detail our conclusions about those effects soon in a followup report.
GBPUSD Outlook: Close Below Broken Fibo 50% Support to Provide Fresh Bearish Signal
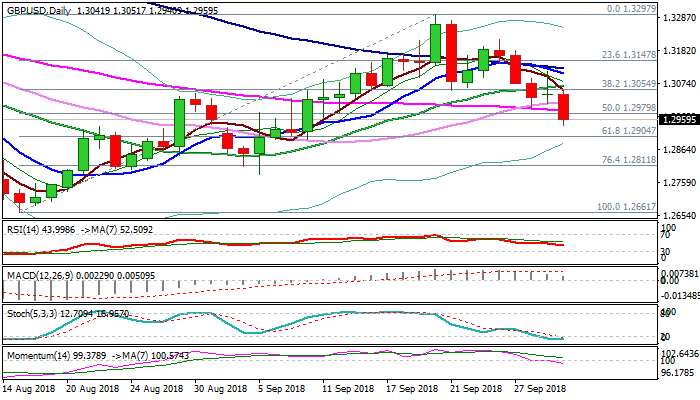
Cable extended losses on Monday to new three-week low at 1.2940, driven by weaker Euro on rising concerns over Italy’s budget deficit, with action of Italian government coming in collision with EU budget rules. In addition, weaker than expected UK Construction spending in September (52.1 vs 52.8f/c and 52.9 prev), further pressured pound. Fresh weakness dipped to the mid-point of thick daily cloud (1.3012/1.2874), with bears looking for bearish signal on close below broken Fibo 50% support at 1.2979, to open way towards key supports at 1.2904 (Fibo 61.8% of 1.2661/1.3297) and 1.2874 (daily cloud base). Oversold slow stochastic turned sideways and warns that bears may take a breather before resuming, but so far without firmer signals. Upticks should stay capped by cloud top to keep bears in play.
Res: 1.2988; 1.3012; 1.3054; 1.3069
Sup: 1.2940; 1.2904; 1.2874; 1.2811
UK Services PMI on the Agenda, ahead of May’s Speech
As the UK’s ruling Conservative Party wraps up its annual conference on Wednesday, the nation will also see the release of its services PMI at 0830 GMT. Forecasts suggest the UK’s largest sector cooled a little in September, which may prove somewhat negative for the pound. That said, the currency’s overarching driver will be any Brexit updates, with some remarks by PM May half an hour later at 0900 GMT likely to be squarely in focus.
The seemingly ceaseless barrage of Brexit headlines that has dominated price action in sterling recently is unlikely to abate anytime soon, as the negotiations now enter their final stretch and both sides look ready to make some long-awaited compromises. Recent media reports suggest the UK is prepared to concede having checks on goods between mainland Britain and Ireland, but in exchange wants the EU to temporarily keep the entire UK within the bloc’s customs union.
Hence, all eyes will be on Prime Minister May when she steps up to the podium on Wednesday to address her own party. Investors will look to decipher whether meaningful progress on the Irish border question is indeed on the plate over the coming weeks. Remarks that point towards that direction would likely spell good news for sterling, whereas the absence of such hints may weigh on the currency.
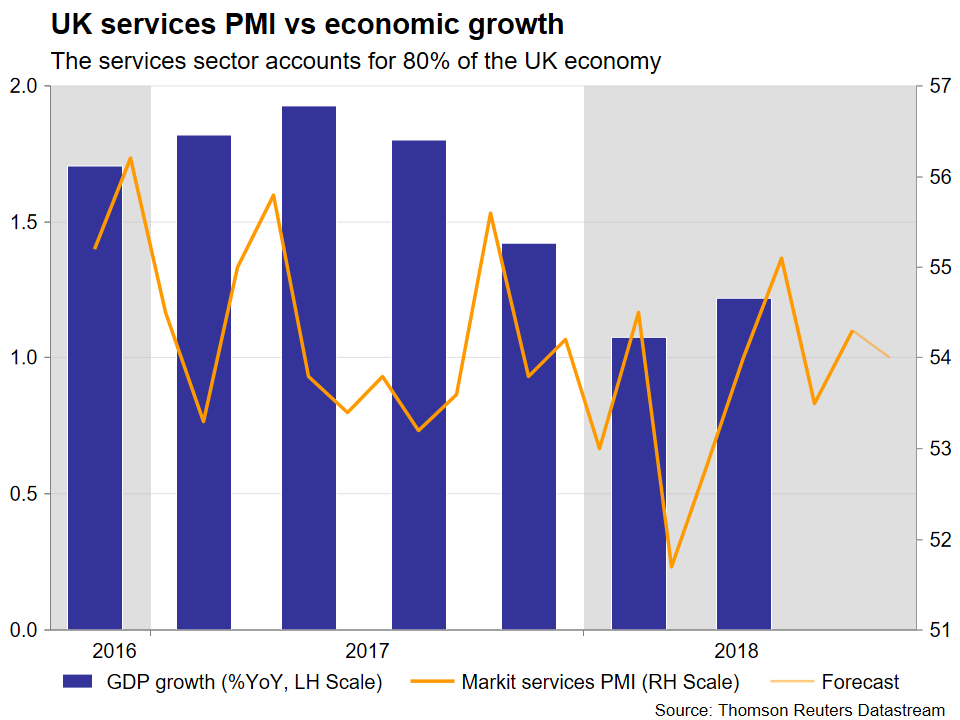
Half an hour before May speaks, markets will turn their attention to the UK services PMI for September. As services account for nearly 80% of UK GDP, this print is seen as a forward-looking gauge of the broader economy’s performance. Forecasts point to a modest decline in the index to 54.0, from 54.3 in August. While it would still remain safely above the 50 threshold that separates expansion from contraction, such a dip would hint at a modest slowdown in the sector, and may thus prove slightly negative for sterling.
To be fair though, barring a notable deviation from forecasts, Brexit developments will most probably prove to be a far larger driver for the pound. Particularly so because markets do not anticipate the Bank of England to hike rates again until August 2019 amid Brexit uncertainties, which suggests economic data alone may have less of an impact than usual on policymakers’ decisions, until the political fog lifts.
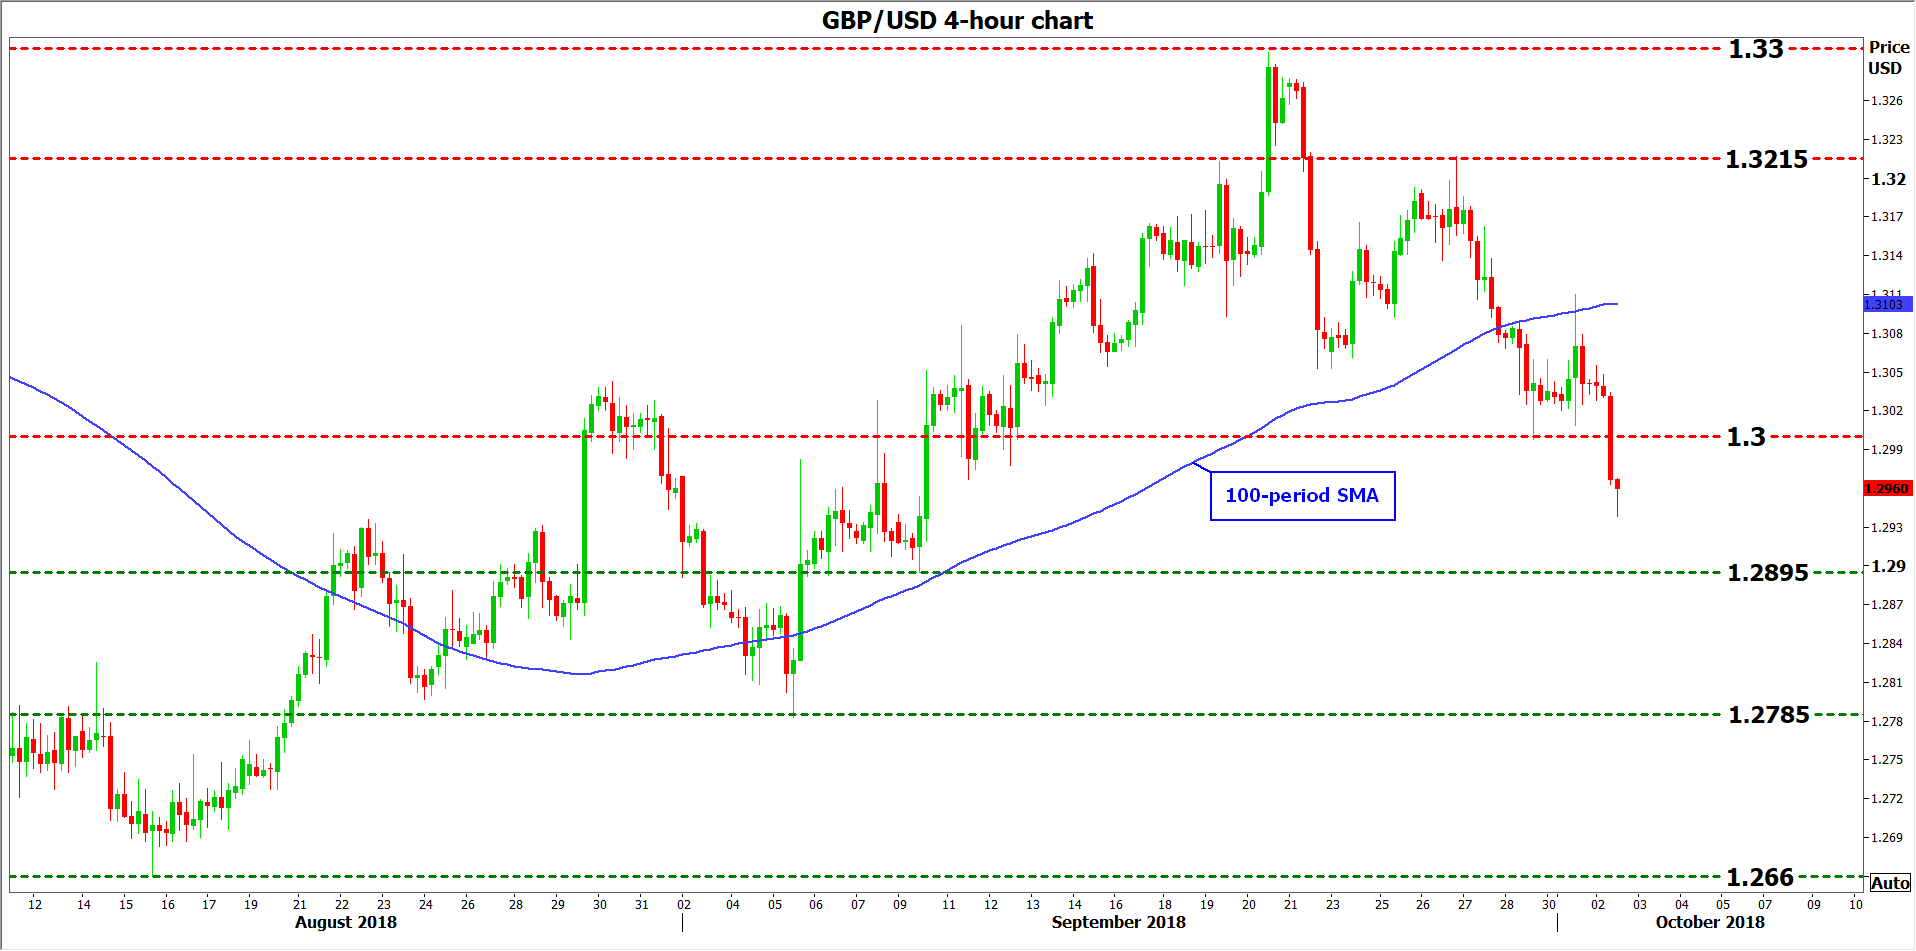
Technically, further declines in sterling/dollar could encounter a first line of support near 1.2895, a zone defined by the September 10 lows. A downside break would open the way for a test of the September 5 trough of 1.2785, with even steeper declines bringing into view the 15-month low of 1.2660.
On the flipside, advances in the pair may stall initially near the psychological handle of 1.3000. If the bulls pierce above it, the next line to watch would be around 1.3100, where the 100-period moving average is located on the 4-hour chart. Higher still, the September 26 high of 1.3215 would increasingly attract attention, ahead of the 1.3300 area – this being the peak of September 20.
Sunset Market Commentary
Markets
Global core bonds gained ground today. European equities opened in red as did the Italian BTP future following yesterday’s reports that Italy’s Tria was heading for an early return home from a meeting between Eurozone FM’s. His colleagues gave him a hard time on Italy’s 2019 budget. This morning, Claudio Borghi, head of the lower house budget committee, commented that Italy could resolve its debt problems more easily if it had its own currency. His comments, together with Italy’s deputy PM Di Maio repeating that his coalition won’t move an inch away of the current 2.4% budget deficit proposal, further supported Bunds. Later, Borghi downplayed his comments saying Italy had no plan to ditch the euro. The strong bond market opening didn’t push through and German yields rebounded. The German yield curve bull flattens with yield changes ranging between -1.0 bps (2-yr) and -3.1 bps (10-yr). 10-yr spread changes vs Germany are widening with Greece (+12 bps) and Italy (+8 bps) underperforming. Italian 10-yr yield spread vs Germany even touched an intraday high 300 bps early in the session, the widest level since April 2013. US yields are moving from little changed -0.4 bps (2-yr) to a decrease of -1.8 bps (10-yr).
There was no meaningful data to guide global FX trading today. The dollar profited from an early session initial risk-off environment. The latest IMF’s global growth warning and some renewed stress in emerging market currencies (Indonesian rupiah, Indian rupee) possibly caused a moderate flight to safety. EUR/USD extended an initial downleg as Europe sent Italy’s Tria home to redo the budget homework. 5-SM leader Di Maio flexed muscles saying they “won’t move a millimeter from the 2019 budget plan”. However, sentiment turned slightly for the better as American traders joined in the early afternoon. After touching an intraday-low around 1.15 EUR/USD, the pair regained some ticks and is currently trading in the low-mid of the 1.15/16 area. USD/JPY reversed intraday losses partially, hovering around 113.75.
UK data was mixed as the construction PMI (52.1 vs. 52.9 expected) disappointed slightly while house prices increased a tad more than anticipated (2.0% YoY vs. 1.9%). However, the numbers were paid no attention to as markets nervously awaited former foreign minister Boris Johnson’s speech at the Tory party conference. Sterling lost ground in the run-up, testing the 0.89-zone, as some feared Johnson would seize the premiership. While he did not do so formally, he reminded the party his availability as a new leader if they deem it necessary. Johnson did not address the rumors of a new (and even softer) brexit compromise but tore May’s Chequers proposal into the ground. He urged party members to back Theresa May’s “original” plan she set out at Lancaster House in 2017, in which the UK leaves the customs union and the single market. Sterling initially gained slightly after his last minute message of ‘loyalty’ but retraced soon. EUR/GBP is hovering near intraday-highs at the 0.89-mark.
News Headlines
Boris Johnson delivered a speech at the Tory party conference in Birmingham. He didn’t claim the PM title as some suggested in the run-up, but told UK conservatives to “back Theresa May (into a corner?) by supporting her original plan”. He referred to her Lancaster House speech and not the Chequers proposal. At Lancaster, PM May said that the UK should leave the customs union and single market and that no deal would be better than a bad deal.
The UK construction sector grew at its slowest pace in 6 months, according to the Markit PMI which unexpectedly declined from 52.9 to 52.1 in September. Political uncertainty remains a drag, but details showed some underlying strength with strongest new orders since December 2016 and fastest employment growth since December 2015.
Russian President Putin is reportedly joining the country’s central bank and minister of Finance in backing a “dedollarization” plan to protect the country from future (US) sanctions.
Gold Records Significant Gains But Still Confined to Trading Range
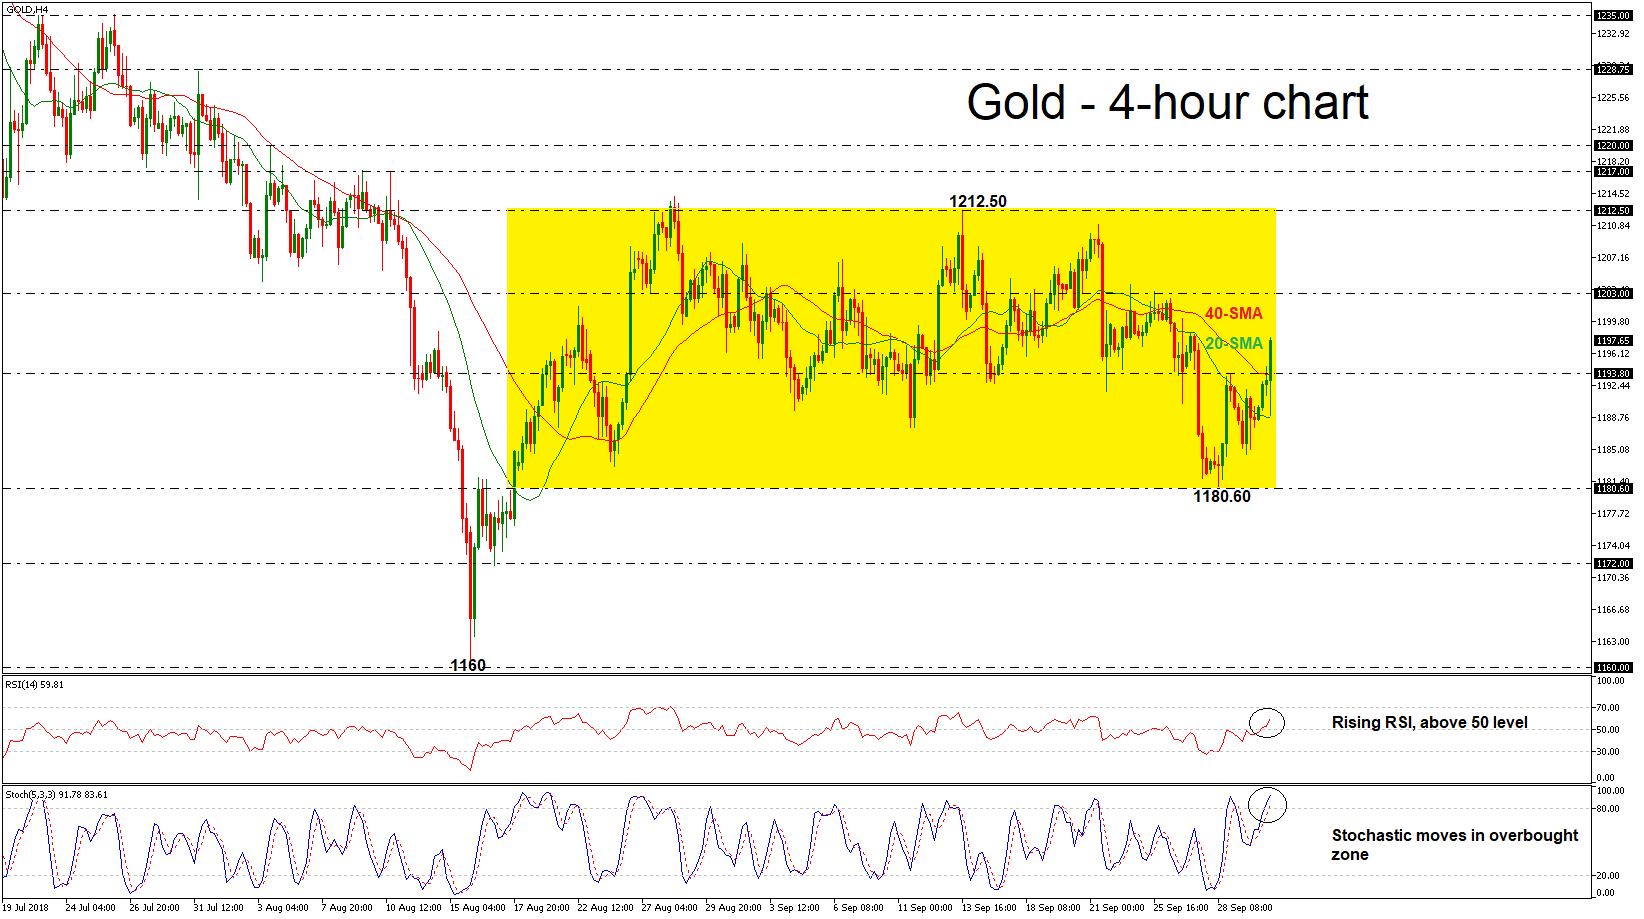
Gold prices have consolidating within a sideways channel since August 17, with upper boundary the 1212.50 resistance level and lower boundary the 1180.60 support barrier. It is worth mentioning that the price jumped above the 20- and 40-simple moving averages (SMAs) in the 4-hour chart with strong movement. The RSI indicator is moving north above the 50 level, while the MACD oscillator entered into the overbought zone.
If price action jumps higher, there is scope to test the 1203 resistance level and clearing this key level could see additional gains towards the upper boundary of 1212.50. If the price successfully penetrates the trading range, it would challenge the 1217 – 1220 resistance zone, identified by the peaks in early August.
Alternatively, if the precious metal dips below the 1193.80 hurdle again, then the focus would shift towards the 20-SMA near 1188.75. If this level is breached too, it would increase downside pressure and may bring about a continuation of the medium-term bearish tendency. From there, the metal would be on the path towards the 1180.60 low.
Despite the neutral short-term bias, in the bigger picture the price has been developing in bearish mode since the pullback on the 1365 resistance barrier.
New Trade Deal Boosts Canadian Dollar
The Canadian dollar is unchanged in the Tuesday session. In the North American session, USD/CAD is trading at 1.2815, down 0.02% on the day. On the release front, there are no Canadian events and one minor U.S indicator. On Wednesday, the U.S releases two key events – ADP nonfarm payrolls and ISM Non-Manufacturing PMI.
After months of grueling talks, Canadian and U.S negotiators finally hammered out a trade agreement on Monday, which paves the way for a new trade agreement between Canada, Mexico and the United States. The NAFTA agreement, which was a pillar of the Canadian economy for 24 years, will give way to the USMCA – the U.S-Mexico-Canada Agreement. Under the new pact, Canada’s auto sector will be shielded from U.S tariffs, and in return, U.S farmers will have more access to Canada’s highly protected dairy industry. News of the historic agreement has boosted the Canadian dollar, and the currency continues to impress, having gained 2.4% since mid-September against the greenback.
In the U.S, consumer spending and confidence levels remain strong. Consumer spending rose 0.3% in August, matching the forecast. The UoM Consumer Sentiment report pushed above the 100-level for the first time since March, although the reading of 100.1 missed the estimate of 100.5 points. On the inflation front, the Core PCE Price Index, which is the Federal Reserve’s preferred inflation indicator, dipped to 0.0% in August, shy of the estimate of 0.1%. This was the first time the indicator failed to post a gain since March 2017. Still, inflation remains close to the Fed’s target of 2%, so a December rate hike remains likely.
AUDUSD Faces Bear Risk, Eyes 0.7141/43 Zone
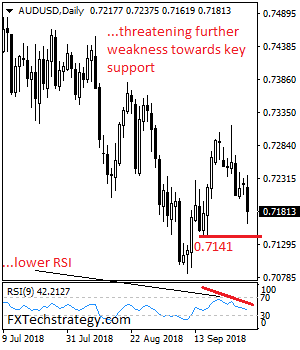
AUDUSD faces bear risk as it eyes its key support located at 0.7141/43. This is coming on the back of its weakness during Tuesday trading session. Support resides at the 0.7141/43 level where a breach will aim at the 0.7100 level. A move below that level will set the stage for a run at the 0.7100 level. Further down, AUDUSD should extend its decline towards the 0.7050 level. Its daily RSI is bearish and pointing lower suggesting further weakness. On the upside, resistance lies at the 1.7200 level. A cut through this level will turn attention to the 0.7300 level. The next resistance comes in at the 0.7350 level where a violation will set the stage for a retarget of the 0.7400 level. On the whole, AUDUSD faces further downside threats as it looks to recapture its key support.
USD/JPY Mid-Day Outlook
Daily Pivots: (S1) 113.74; (P) 113.93; (R1) 114.16; More...
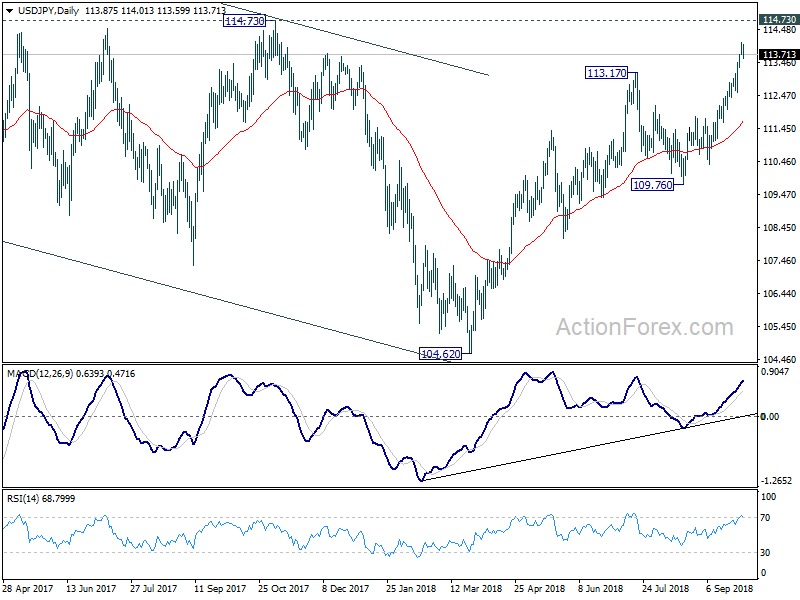
Intraday bias in USD/JPY remains neutral for consolidation below 114.05 temporary top. Some consolidations would be seen but downside should be contained above 112.55 support to bring another rally. Above 114.05 will target 114.73 key resistance. Decisive break there will confirm larger bullish case. Next target will be 118.65 resistance.
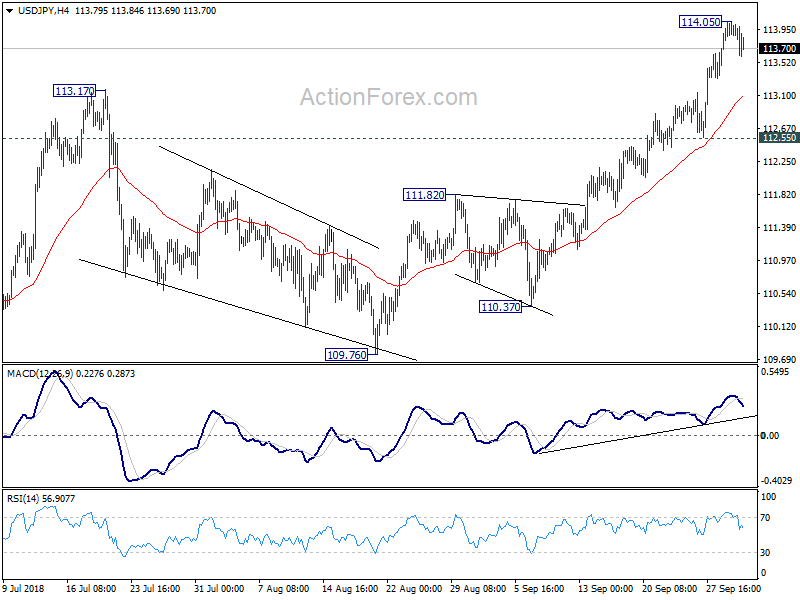
In the bigger picture, corrective fall from 118.65 (2016 high) should have completed with three waves down to 104.62. Decisive break of 114.73 resistance will likely resume whole rally from 98.97 (2016 low) to 100% projection of 98.97 to 118.65 from 104.62 at 124.30, which is reasonably close to 125.85 (2015 high). This will stay as the preferred case as long as 109.76 support holds.
USD/CHF Mid-Day Outlook
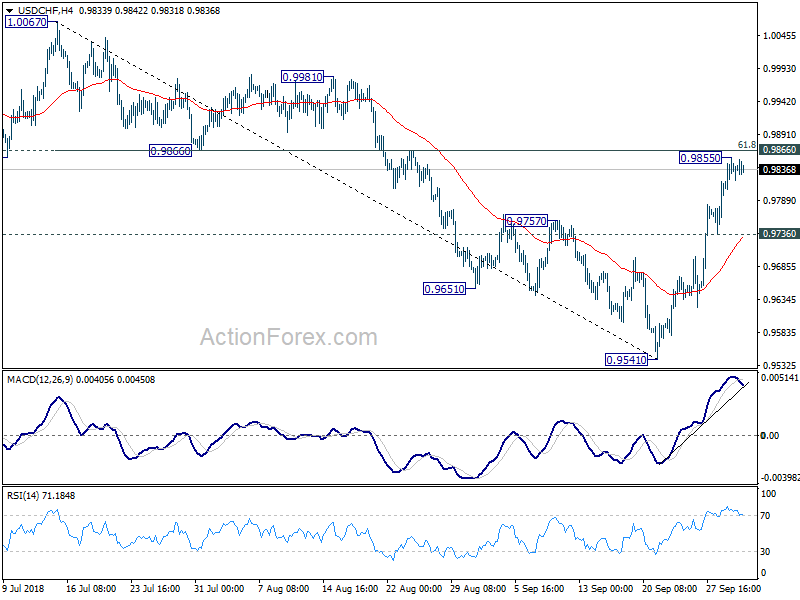
Daily Pivots: (S1) 0.9805; (P) 0.9831; (R1) 0.9861; More...
A temporary top is formed at 0.9855 in USD/CHF just ahead of 61.8% retracement of 1.0067 to 0.9541 at 0.9866. Intraday bias is turned neutral first. Further rally is expected as long as 0.9736 minor support holds. On the upside, decisive break of 0.9866 will pave the way to retest 1.0067 high. However, break of 0.9736 will argue that the rebound from 0.9541 has completed and turn bias to the downside for deeper fall.
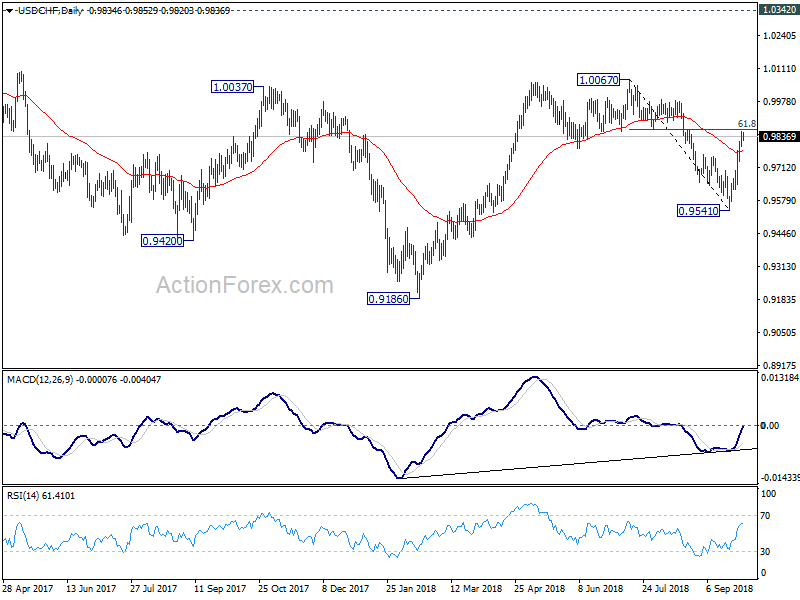
In the bigger picture, focus is now back on 0.9866 support turned resistance. Decisive break there will suggests that pull back from 1.0067 has completed at 0.9541. And larger rise from 0.9186 low is ready to resume. Decisive break of 1.0067 will pave the way to 1.0342 key resistance next. Meanwhile, break of 0.9541 will extend the decline but we don't expect a break of 0.9186 low even in that case.
GBP/USD Mid-Day Outlook
Daily Pivots: (S1) 1.3001; (P) 1.3051; (R1) 1.3091; More...
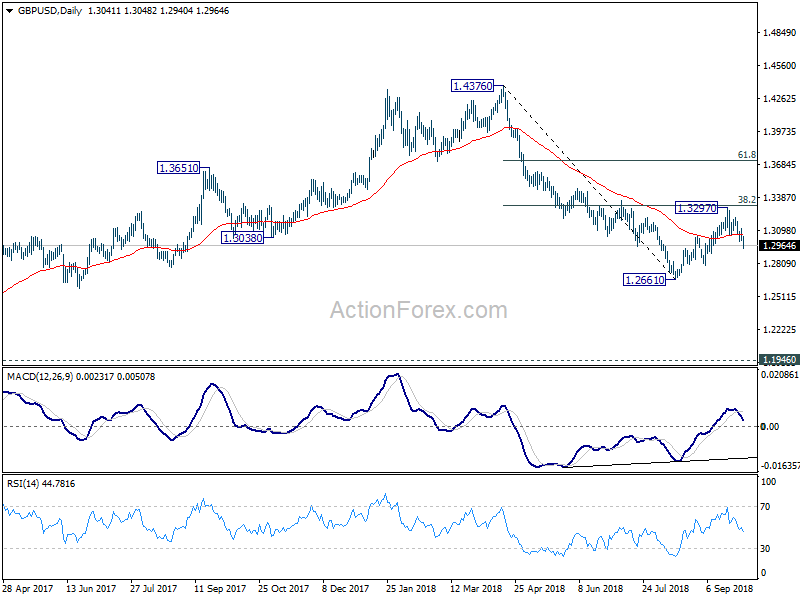
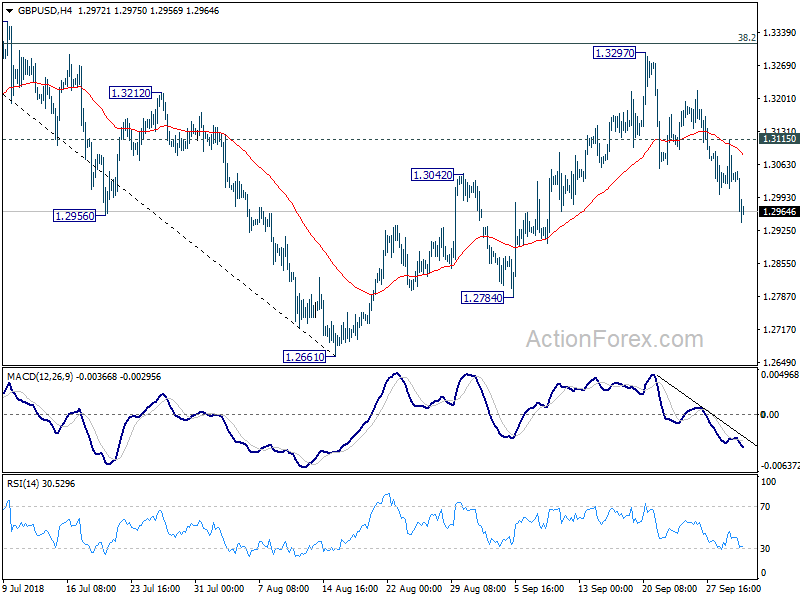
GBP/USD's fall from 1.3297 resumed by taking out 1.2999 and reaches as low as 1.2940 so far. Intraday bias is back on the downside for 1.2784 support next. Firm break there will likely resume larger down trend from 1.4376 through 1.2661. On the upside, break of 1.3115 minor resistance is needed to indicate completion of the decline. Otherwise, outlook will stay cautiously bearish in case of recovery.
In the bigger picture, whole medium term rebound from 1.1946 (2016 low) should have completed at 1.4376 already, after rejection from 55 month EMA (now at 1.4062). The structure and momentum of the fall from 1.4376 argues that it's resuming long term down trend. And this will be the preferred case as long as 38.2% retracement of 1.4376 to 1.2661 at 1.3316 holds. However, firm break of 1.3316 would bring stronger rebound to 61.8% retracement at 1.3721. And, the eventual depth of the fall from 1.4376, and the chance of hitting 1.1946 low, will depend on the strength of the interim corrective rebound from 1.2661.