Sample Category Title
USDJPY Trend Remains Bullish Above 112.20
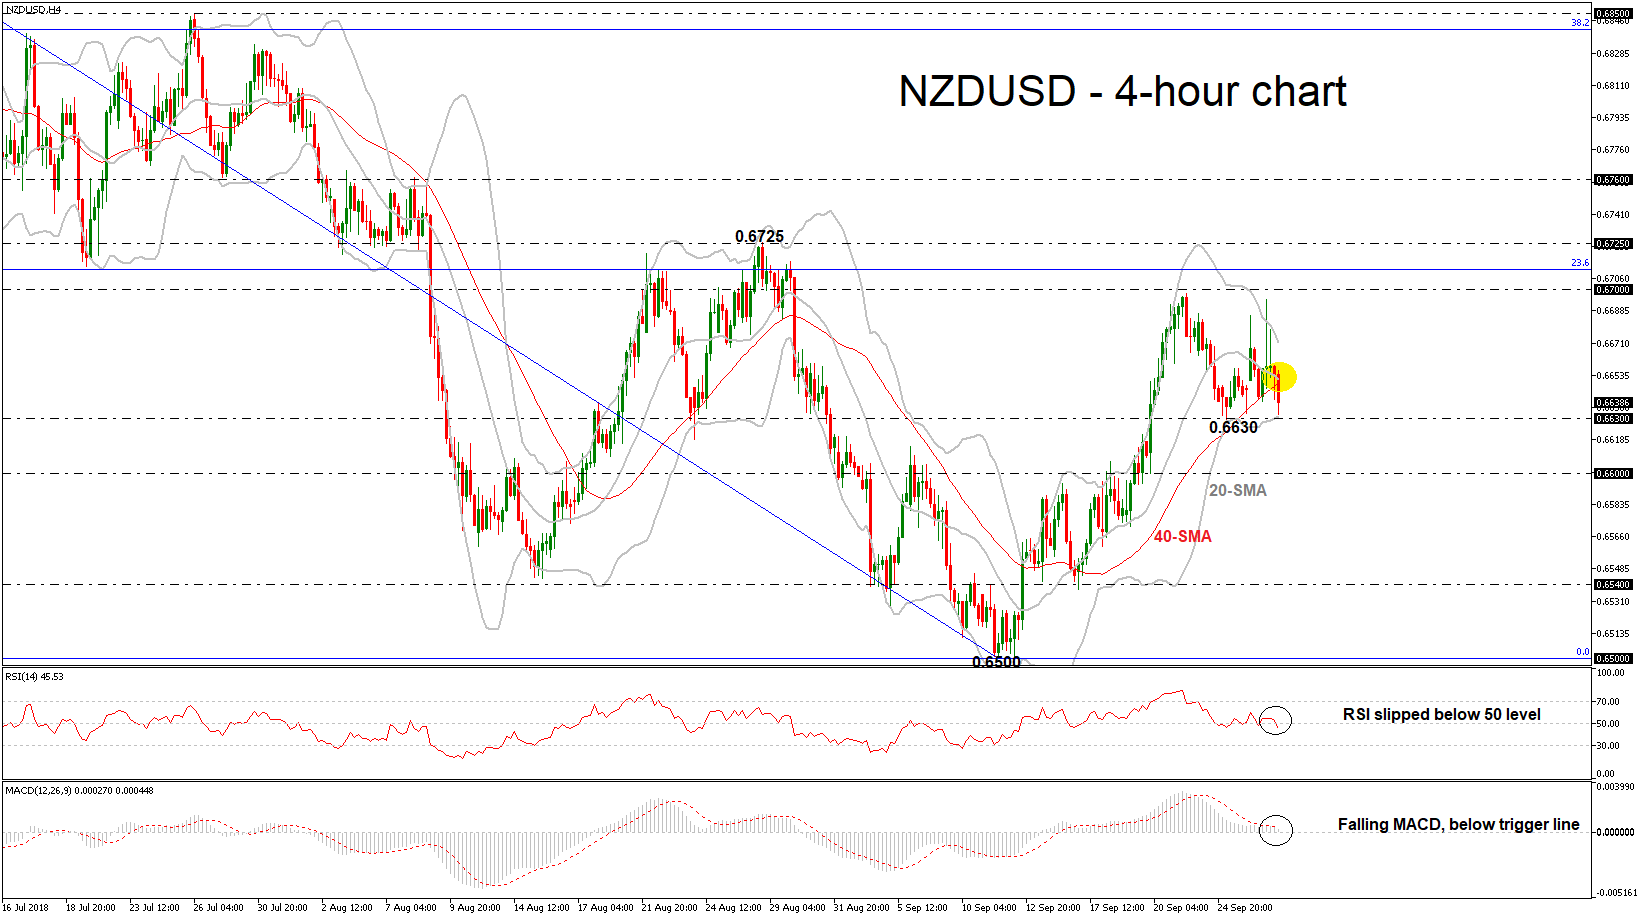
The US dollar is correcting lower against the Japanese yen currency, although the short and medium-term trend is still bullish. The USDJPY pair traded to 113.13 on Wednesday after the US Federal Open Market Committee raised interest rates 25 basis points, buyers failed to break the July high, at 113.17. The uptrend and the bullish inverted head and shoulders remain firmly in place while price trades above the 112.20 level.
The USDJPY pair remains intraday bullish while trading above the 112.20 level, key resistance is now found at the 113.13 and 113.80 levels.
If the USDJPY pair moves below the 112.20 level, key support is found at the 111.70 and 111.37 levels.
The Buck Rises As The Fed Stands Idle
Fed meeting: non-event
Jerome Powell didn’t rock the boat during Powell the last FOMC meeting. As widely expected, policy makers raised the target band for the federal fund rate by 25bps to 2% - 2.25%, for the third time this year. It is worth noticing that the sentence “The stance of monetary policy remains accommodative” was removed from the statement, signalling that the Fed continues to move away from easy money. We bet it won’t make Trump happy. In addition, since October last year, the Fed balance sheet shrank more than 5.5%, or $235bn, down to $4.01tn, the lowest level since April 2014.
Nevertheless, the more interesting aspect of yesterday meeting was the update in median projection. The first thing we notice is that policy makers revised substantially higher real GDP growth for this year, up to 3.1% compared to forecast of 2.8% in June. However, in the longer-term the pace of growth should slow down to 2.5% in 2019 (2.4% previous estimate) and 2% in 2020 (unchanged). On the inflation side, the picture is roughly unchanged, while rate expectations were left unchanged and showed that the Fed should take a break in its hiking cycle starting in 2021.
Development in the FX market suggests that investors didn’t were to stand. Most currency pairs move violently following the meeting but most of them were unchanged at the end of the day. Investors are now already waiting for the next ECB meeting, which will take place on October 25, and the Fed December meeting. In the meantime, the trade war story, and Donald Trump’s random tweets will remain the main driver and create short-term volatility.
Canada: tick tick tick
Canadian dollar optimism is eroding, as Sunday’s deadline for US-Canada trade talks approaches. US President Donald Trump confirmed his discontent, refusing Canadian Prime Minister Justin Trudeau’s request for a meeting. Trump restated his willingness to implement tough duties on Canadian cars, as negotiations are stalling on multiple topics. As early as tomorrow the Trump administration will publish its bilateral trade agreement with Mexico, putting a trilateral agreement in jeopardy. For now, the loonie is expected to ease against the greenback, trading above 1.3050 and expected to rise as the deadline nears.
US trade representative Robert Lighthizer mentioned that trade talks with Canada are expected to continue after the September deadline. This could lead to two bilateral trade deals rather than one trilateral one. The US-Mexico pact is expected to be signed by Mexican president Enrique Pena Nieto, who leaves office on 1 December of this year. America and Canada continue to be split by divergences on Canadian dairy products, US steel and aluminium tariffs, Canadian media content safeguarding and the broadening of trade dispute settlement.
WTI Oil Outlook: Concerns Of Impact From Sanctions On Iran Offset Negative Impact From Build Of Crude Inventories
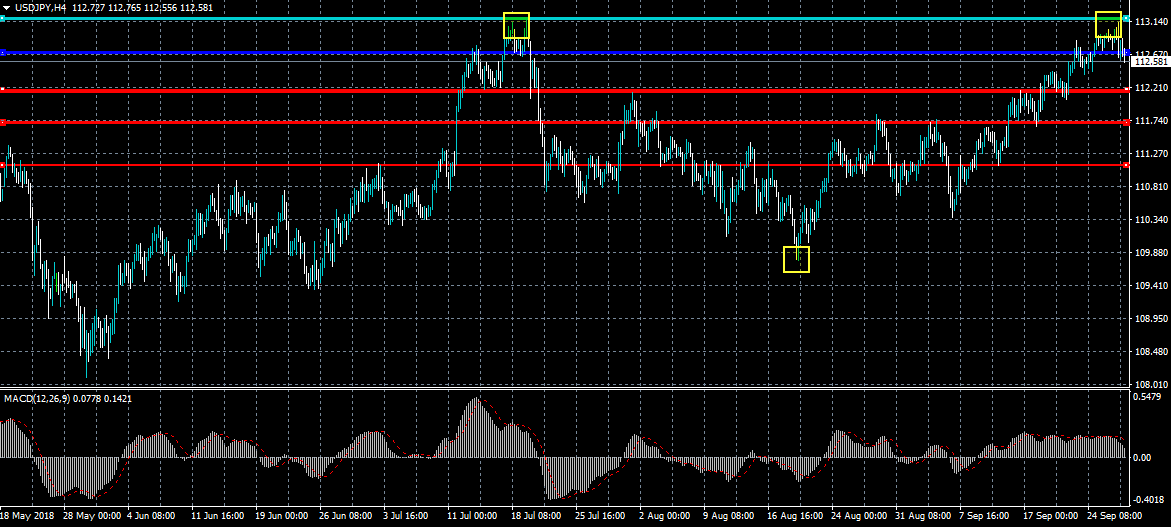
WTI oil regained traction and bounced to $72.58 on Thursday, as persisting fears on tighter oil markets on upcoming US sanctions on Iran offset negative impact from rise in crude stocks.
EIA report on Wednesday showed a build of 1.85 million barrels vs forecasted draw of 1.27 million barrels and previous week’s fall of 2.05 million barrels.
Also, the US ruled out release of emergency crude reserves, which aimed to prevent oil prices of spiking higher and adding to bullish sentiment.
Today’s fresh advance after Wednesday’s action ended in long-legged Doji signals that pullback from new 2 ½ month high at $72.73 might be over.
Bullish techs add to prevailing positive sentiment and keep focus at the upside for eventual break through Fibo barrier at $72.77 (76.4% of $75.34/$64.43 descend) and continuation of an uptrend from $64.43 (16 Aug low).
Session low at $71.96 marks initial support, followed by Wednesday’s spike low at $71.47 and pivotal $71.17 support (broken Fibo 61.8% of $75.34/$64.43) loss of which would generate stronger bearish signal.
Res: 72.77, 73.64, 74.00, 74.25
Sup: 71.96, 71.47, 71.17, 70.76
EUR/USD Analysis: Retreats Below 1.1700
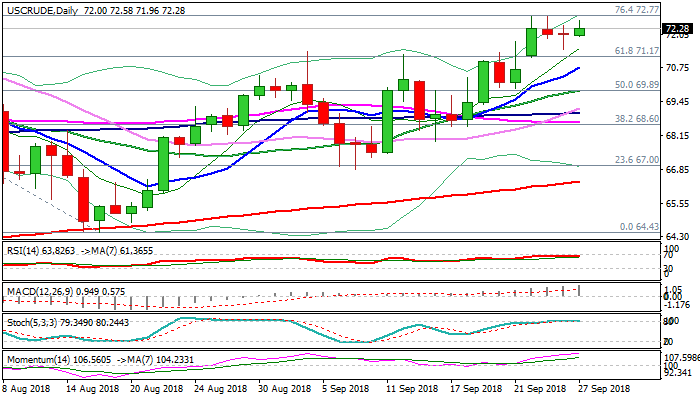
The common European currency increased volatility on Wednesday, as the US Federal Funds rate was published. Afterwards, as it was expected after a US rate hike, the EUR/USD declined. During the decline the lower trend line of a medium pattern and a support cluster at 1.1720 were passed.
In regards to the near term future, the rate most likely will be squeezed between the 1.1720 cluster and the lower trend line of a dominant pattern. If the pattern's trend line is passed, the 1.1650 level will be reached.
On the other hand the pair might break the 1.1720 cluster and surge back up to the 1.1750 level.
GBP/USD Analysis: Might Fall Below 1.30
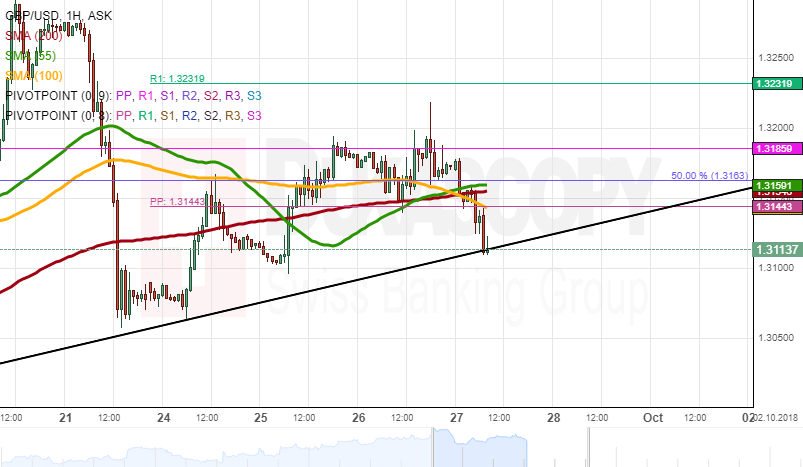
The GBP/USD fell after the US rate hike, as expected. On Thursday morning the currency rate was at the lower trend line of a dominant ascending pattern.
If the support line at the 1.3110 level gets passed, the rate might fall as low as the 1.3000 level, as below the rate there are no technical support levels.
However, the currency exchange rate might rebound from the support level and one more approach the resistance levels at the 1.3140 mark
USD/JPY Analysis: Breaks Narrow Pattern
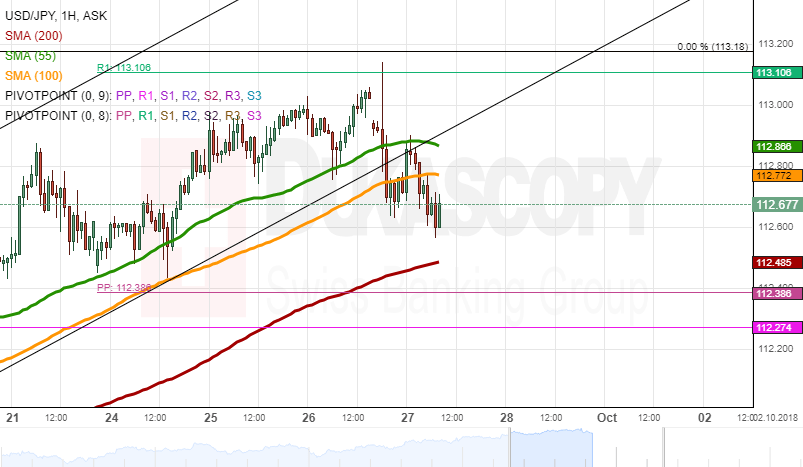
It was already previously mentioned that the narrow surge in a channel up pattern can not continue on the USD/JPY charts. The US rate hike provided the needed volatility for the pattern to be broken.
On Thursday morning the rate was heading for the 200-hour simple moving average, which was located at the 112.50 mark. Meanwhile, the rate faced the resistance of the 55 and 100-hour simple moving averages respectively at 112.87 and 112.77.
Most likely the rate will be squeezed by these levels. Watch the rate until it makes a break out from the occurring squeeze either down to the 112.40 level or up to the 113.10 level.
Gold Analysis: Books New Low Level
A seven-week ascending channel pattern has guided the Eurozone single currency against the Canadian Dollar. The pair bounced off the lower boundary of the channel on August 16 and had since reached two months high level at 1.5317.
The exchange rate is trading near a resistance line formed by the monthly pivot point at 1.5317 during the morning hours of Thursday's trading session. From a technical point of view, this resistance level could provide significant resistance for the price to reverse south and target a support level formed by the 100-hour SMA at 1.5214.
However, if this resistance is unable to hold, the currency exchange rate could target the upper boundary of the seven weeks ascending channel at 1.5473 during the following trading sessions.
EUR/CAD 4H Chart: Tests Monthly R1 At 1.5317
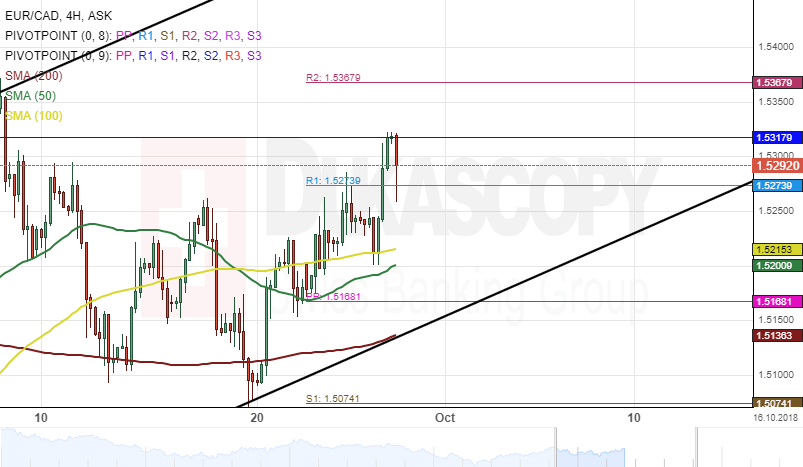
A seven-week ascending channel pattern has guided the Eurozone single currency against the Canadian Dollar. The pair bounced off the lower boundary of the channel on August 16 and had since reached two months high level at 1.5317.
The exchange rate is trading near a resistance line formed by the monthly pivot point at 1.5317 during the morning hours of Thursday's trading session. From a technical point of view, this resistance level could provide significant resistance for the price to reverse south and target a support level formed by the 100-hour SMA at 1.5214.
However, if this resistance is unable to hold, the currency exchange rate could target the upper boundary of the seven weeks ascending channel at 1.5473 during the following trading sessions.
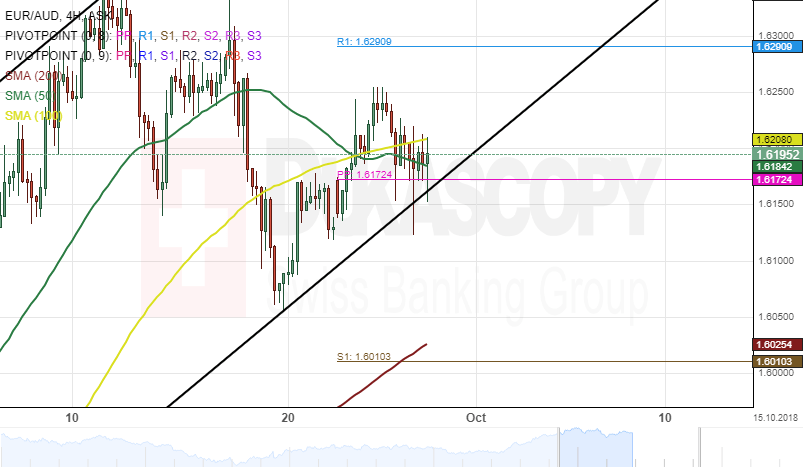
EUR/AUD 4H Chart: Meets Support Cluster At 1.6185
The single European currency has been appreciating against the Australian Dollar since mid-August. The rate reversed from the lower boundary of an ascending channel at 1.5598 on August 17.
The exchange rate made a U-turn south from a resistance level at 1.6338 on September 11, and currently trading near the bottom border of a one-month ascending channel. From a theoretical point of view, a breakout could be expected within this session.
However, technical indicators suggest that this decline might not be immediate. The currency exchange rate could reverse from a support line at 1.6185 and aim for a re-tests of the monthly R1 at 1.6338 during the following trading sessions.
NZDUSD Creates Losses With Strong Support The Lower Bollinger Band
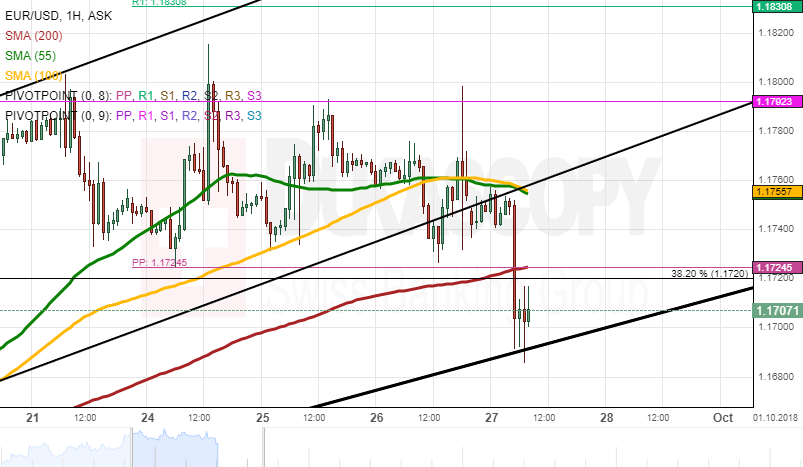
NZDUSD has come under renewed selling pressure falling back below the 0.6630 price level but remaining above the lower Bollinger band. Meanwhile, the 20-simple moving average (SMA) is ready to record a bearish crossover with the 40-SMA in the 4-hour chart, suggesting more losses. The RSI indicator dropped below the 50 level with strong momentum, while the MACD oscillator remains above zero line with weak movement.
If the price slip below the 0.6630 support level, it is expected to lose more ground. Initial support to declines could come from the zone around the 0.6600 handle. Steeper downside movement would send prices until the 0.6540 barrier.
On the other side, upside moves are likely to find resistance at the 20- and 40-SMAs around 0.6650 before touching the upper Bollinger Band at 0.6670. It is worth mentioning that the Bollinger Band is squeezing over the last session and is approaching the current market prices. A run above the upper Bollinger would push the pair towards the 0.6700 psychological level.
In the medium-term, NZDUSD has been trading bearish in the past five months after the pullback on the 0.7390 hurdle, but if the price jumps above 0.6725, this could shift the outlook to more neutral to bullish one.
If the price slip below the 0.6630 support level, it is expected to lose more ground. Initial support to declines could come from the zone around the 0.6600 handle. Steeper downside movement would send prices until the 0.6540 barrier.