Sample Category Title
The Analytical Overview Of The Main Currency Pairs
The EUR/USD currency pair
Technical indicators of the currency pair:
Prev Open: 1.16827
Open: 1.16627
% chg. over the last day: -0.04
Day's range: 1.16732 – 1.17050
52 wk range: 1.0571 – 1.2557
The technical pattern on the EUR/USD currency pair is ambiguous. Investors expect additional drivers. At the moment, the key support and resistance levels are 1.16750 and 1.17100, respectively. We recommend opening positions from these marks. The euro has the potential for further growth.
The news feed on 2018.09.19:
Statistics on the real estate market in the US at 15:30 (GMT+3:00).
We also recommend paying attention to the speech by the ECB president Draghi.
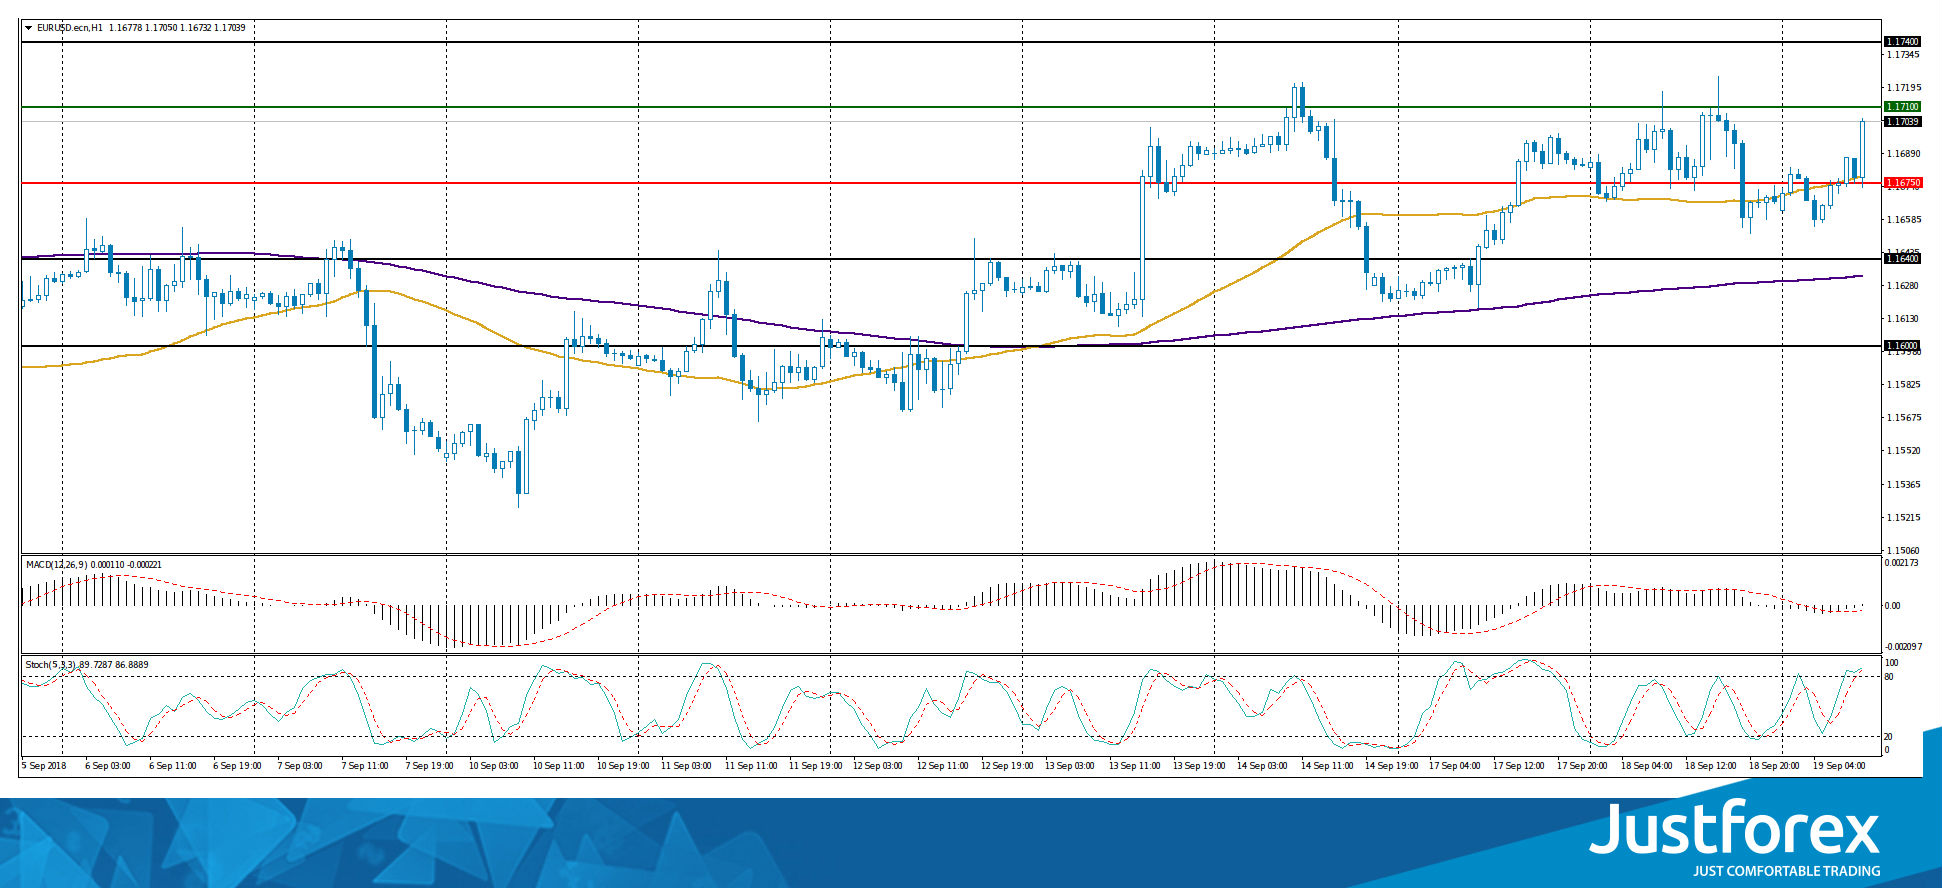
The price has fixed above 50 MA and 200 MA, which signals the power of buyers.
The MACD histogram is near the 0 mark. There are no signals.
Stochastic Oscillator is located in the overbought zone, the %K line has started crossing the %D line. There are no accurate signals.
Trading recommendations
Support levels: 1.16750, 1.16400, 1.16000
Resistance levels: 1.17100, 1.17400
If the price fixes below 1.16750, the EUR/USD quotes are expected to decline. The movement is tending to 1.16400-1.16000.
An alternative may be the further growth of the EUR/USD currency pair to the level of 1.17400-1.17600.
The GBP/USD currency pair
Technical indicators of the currency pair:
Prev Open: 1.31328
Open: 1.31469
% chg. over the last day: +0.07
Day's range: 1.31470 – 1.31758
52 wk range: 1.2361 – 1.4345
There is a variety of trends on the GBP/USD currency pair. At the moment, the technical pattern is ambiguous. The trading instrument is in a sideways trend. The GBP/USD quotes are testing local support and resistance levels: 1.31300 and 1.31700, respectively. The positions should be opened from these marks.
At 11:30 (GMT+3:00), the consumer price index will be published in the UK.
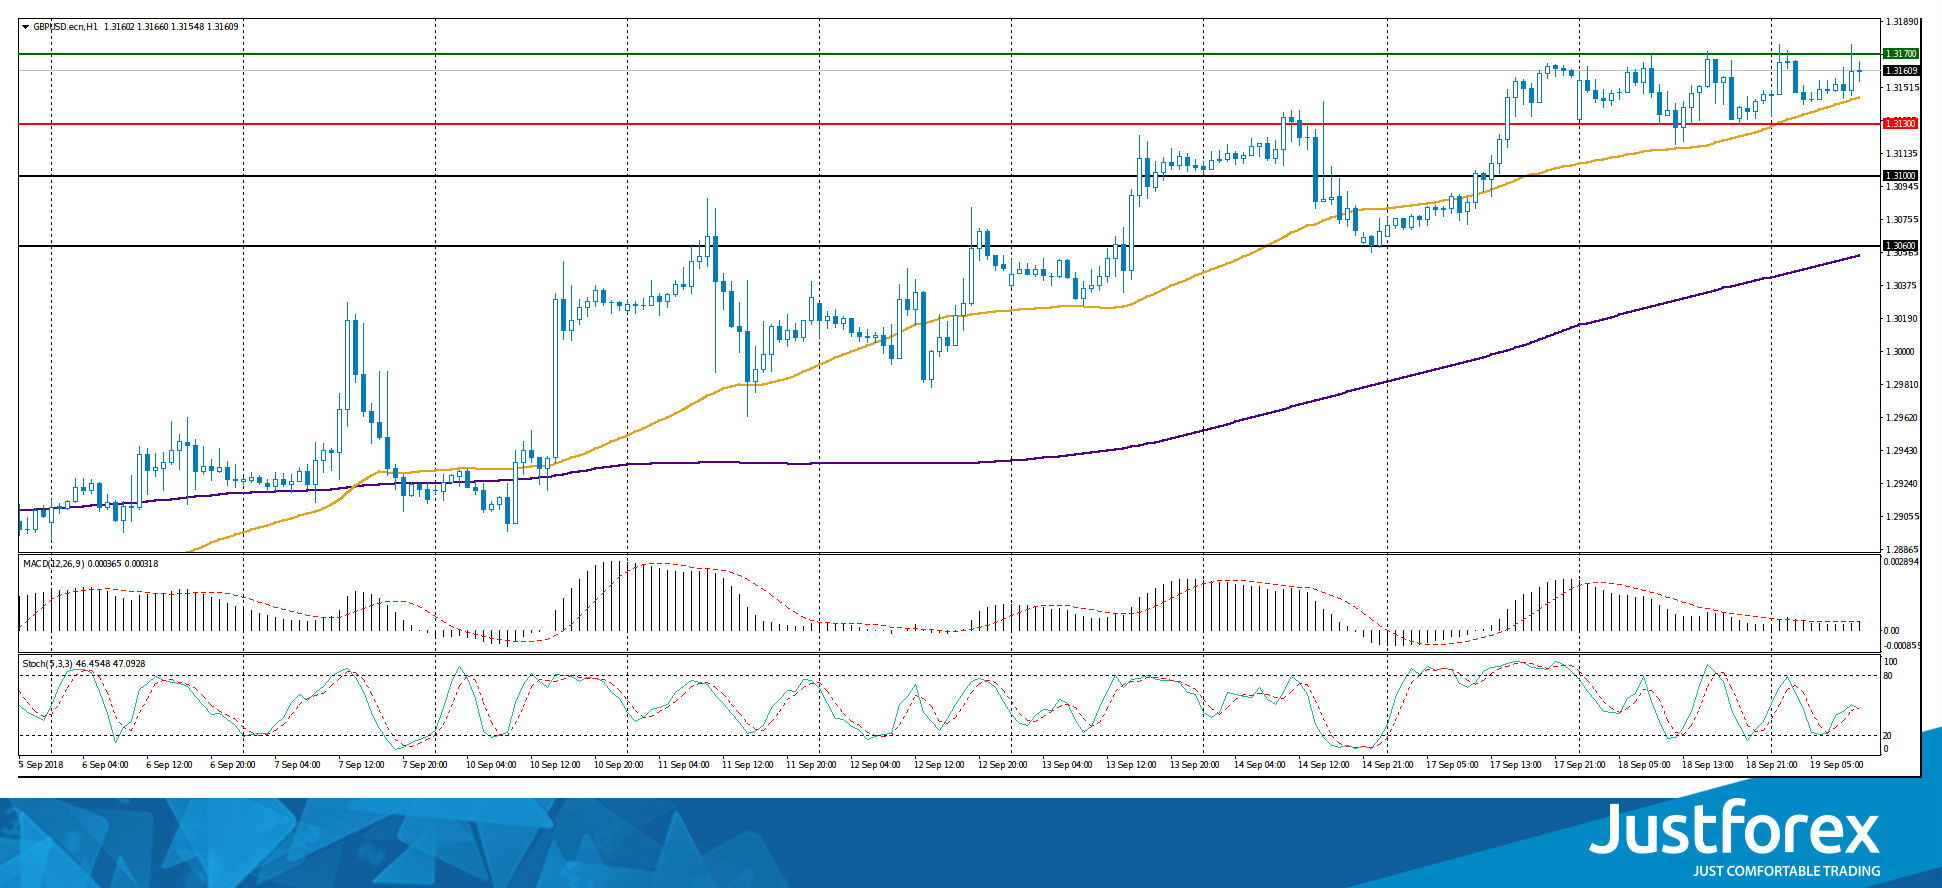
Indicators point to the power of buyers: the price has fixed above 50 MA and 200 MA.
The MACD histogram is located in the positive zone, but below the signal line, which gives a weak signal to buy GBP/USD.
Stochastic Oscillator is in the neutral zone, the %K line is above the %D line, which indicates an increase in quotes.
Trading recommendations
Support levels: 1.31300, 1.31000, 1.30600
Resistance levels: 1.31700, 1.32000
If the price fixes above the resistance level of 1.31700, the GBP/USD quotes are expected to rise. The movement is tending to 1.32000-1.32200.
An alternative may be the decrease of the GBP/USD currency pair to 1.31000-1.30600.
The USD/CAD currency pair
Technical indicators of the currency pair:
Prev Open: 1.30330
Open: 1.29783
% chg. over the last day: -0.54
Day's range: 1.30312 – 1.30373
52 wk range: 1.2059 – 1.3795
The bearish sentiment is observed on the USD/CAD currency pair. At the moment, quotes are testing local support of 1.29500. A mark of 1.29800 is already a "mirror" resistance. We recommend opening positions from these marks. The trading instrument has the potential for further reduce.
The news feed on the economy of Canada is calm.
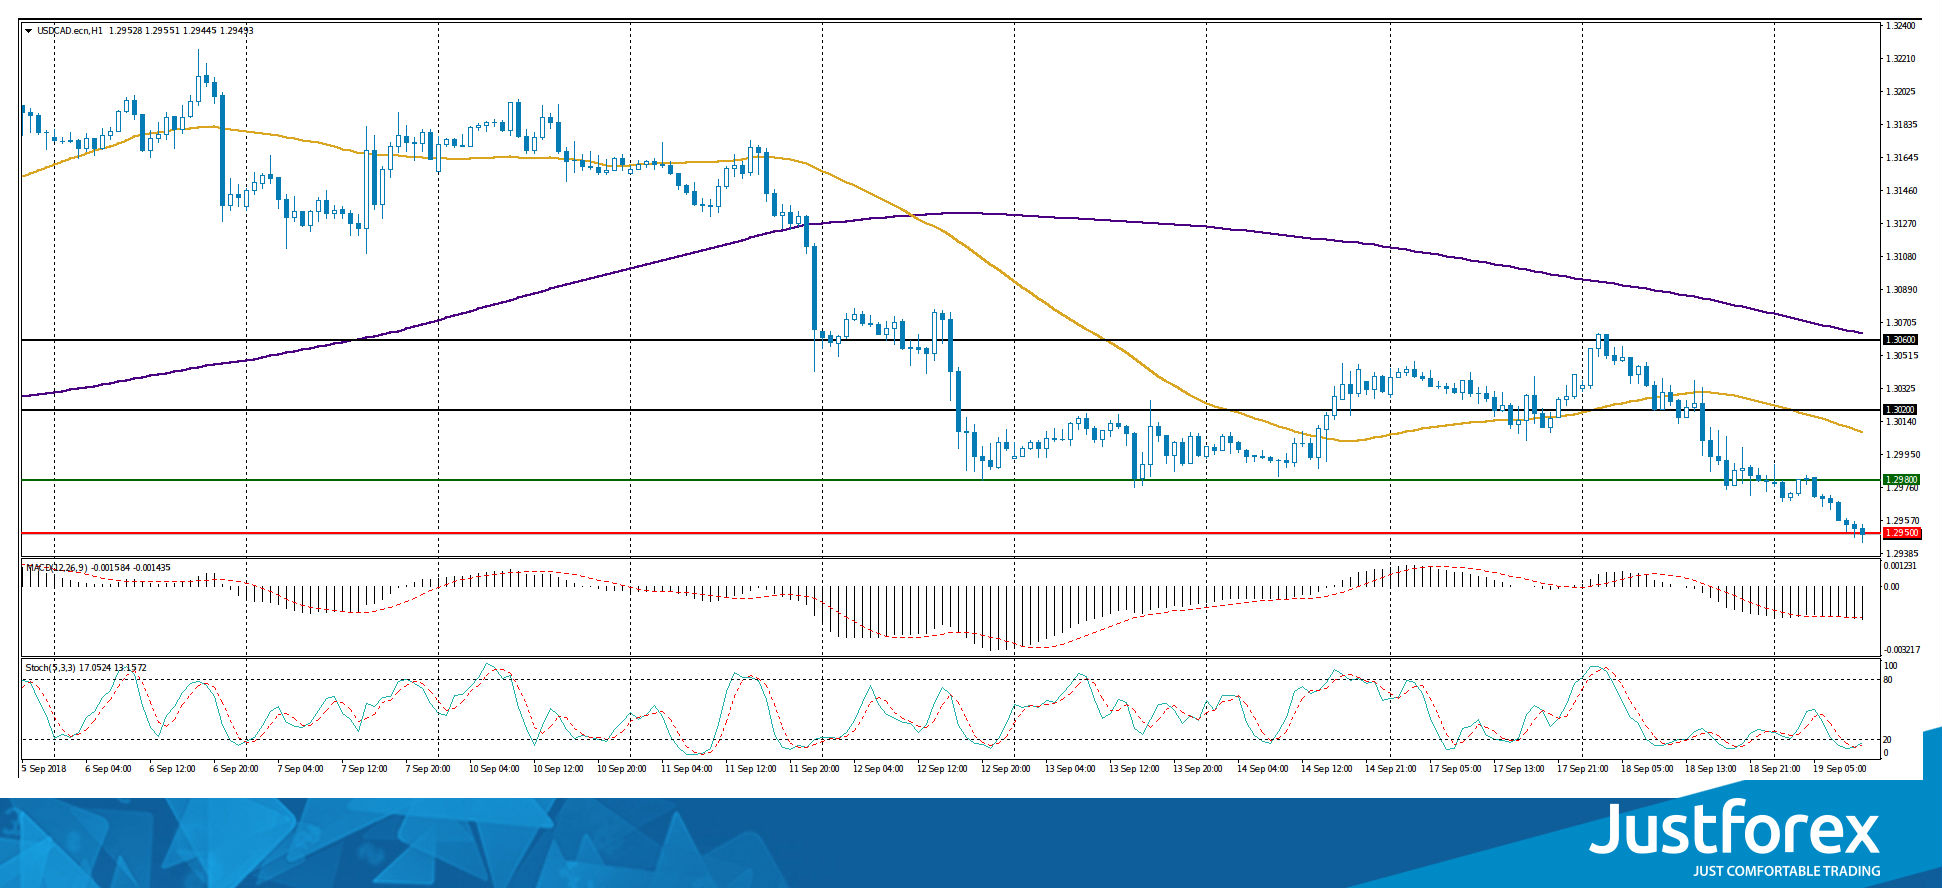
Indicators point to the power of sellers: the price is being traded below 50 MA and 200 MA.
The MACD histogram is in the negative zone, below the signal line, which gives a strong signal to sell USD/CAD.
Stochastic Oscillator is located in the oversold zone, the %K line is crossing the %D line. There are no accurate signals.
Trading recommendations
Support levels: 1.29500, 1.29000
Resistance levels: 1.29800, 1.30200, 1.30600
If the price fixes below the support of 1.29500, the USD/CAD quotes are expected to decline. The movement is tending to the round level of 1.29000.
Alternative option. If the price fixes above 1.29800, it is necessary to consider purchases of USD/CAD. The target movement level is 1.30200-1.30600.
The USD/JPY currency pair
Technical indicators of the currency pair:
Prev Open: 111.839
Open: 112.354
% chg. over the last day: +0.39
Day's range: 112.348 – 112.388
52 wk range: 104.56 – 114.74
Yesterday, the bullish sentiment was observed on the USD/JPY currency pair. At the moment, quotes are consolidating. Local support and resistance levels are 112.250 and 112.500, respectively. The positions should be opened from these marks. Investors expect additional drivers. In the near future, technical correction is not ruled out.
The Bank of Japan has kept the main parameters of monetary policy at the same level.
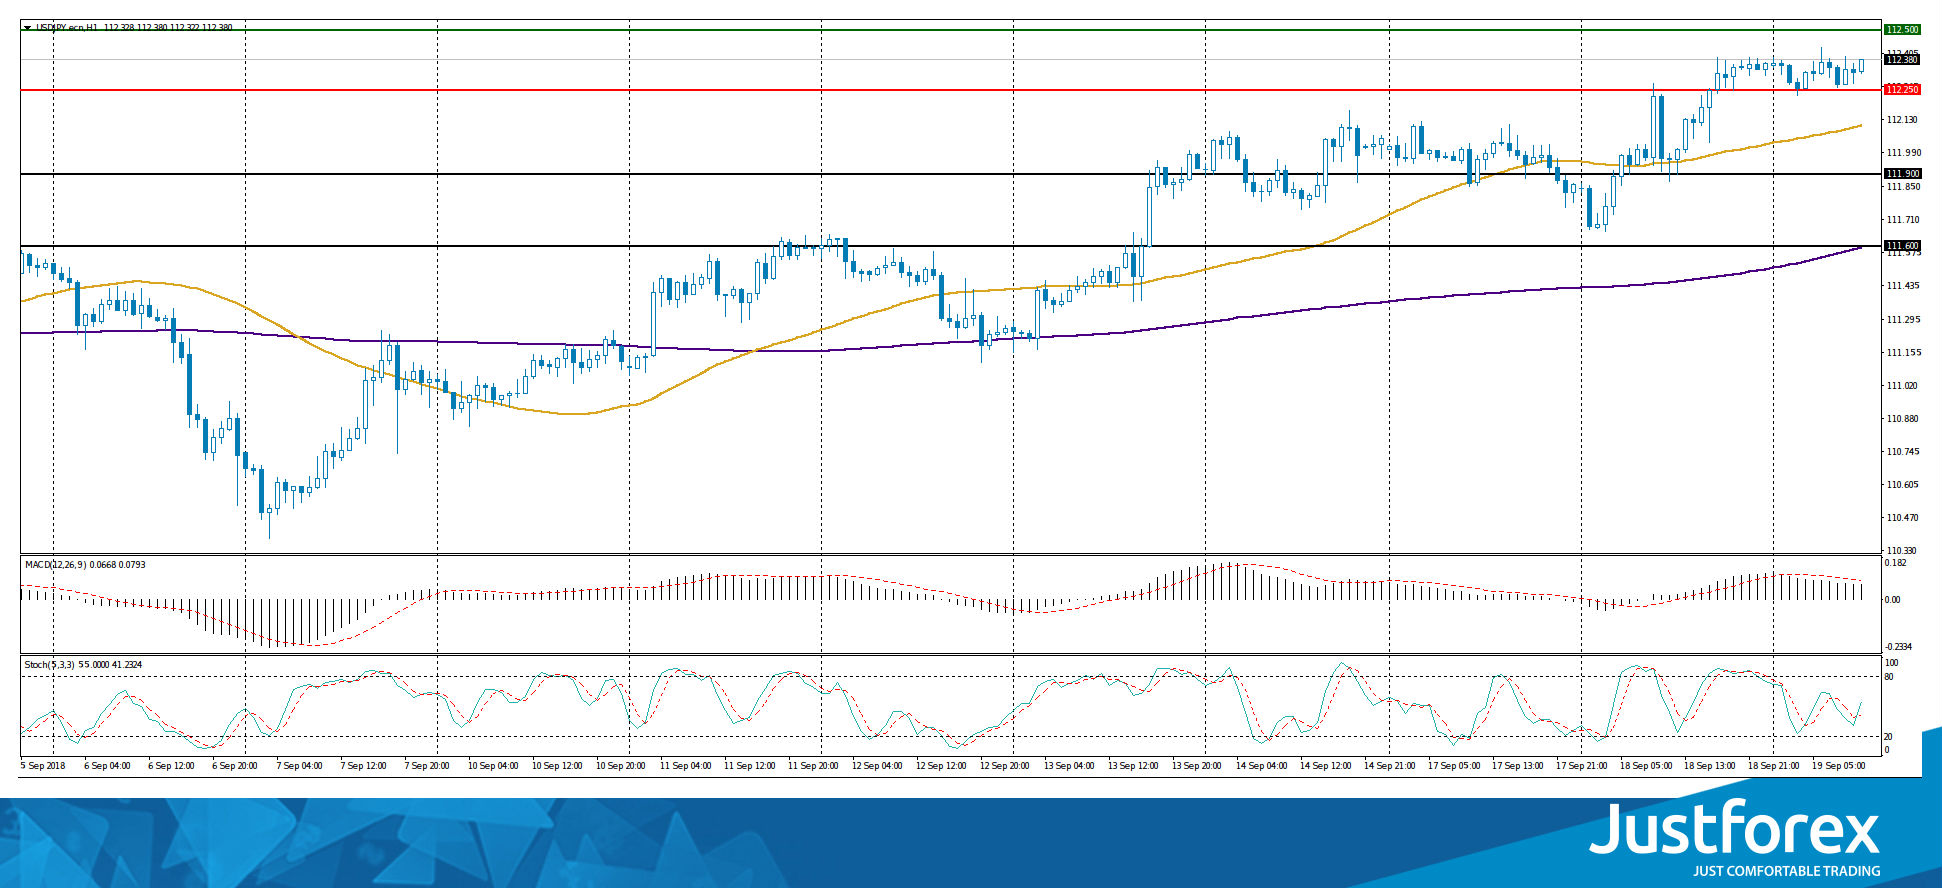
Indicators point to the power of buyers: the price is being traded above 50 MA and 200 MA.
The MACD histogram is located in the positive zone, but below the signal line, which gives a weak signal to buy USD/JPY.
Stochastic Oscillator is located in the neutral zone, the %K line is above the %D line, which gives a signal to buy USD/JPY.
Trading recommendations
Support levels: 112.250, 111.900, 111.600
Resistance levels: 112.500, 112.800
If the price fixes above the resistance level of 112.500, further growth of the USD/JPY quotes is expected. The movement is tending to 112.800-113.000.
Alternative option. If the price fixes below the already "mirror" support of 112.250, we recommend looking for entry points to the market to open short positions. The target movement level is 111.900-111.600.
GBP Is Bullish, But All Eyes On The CPI
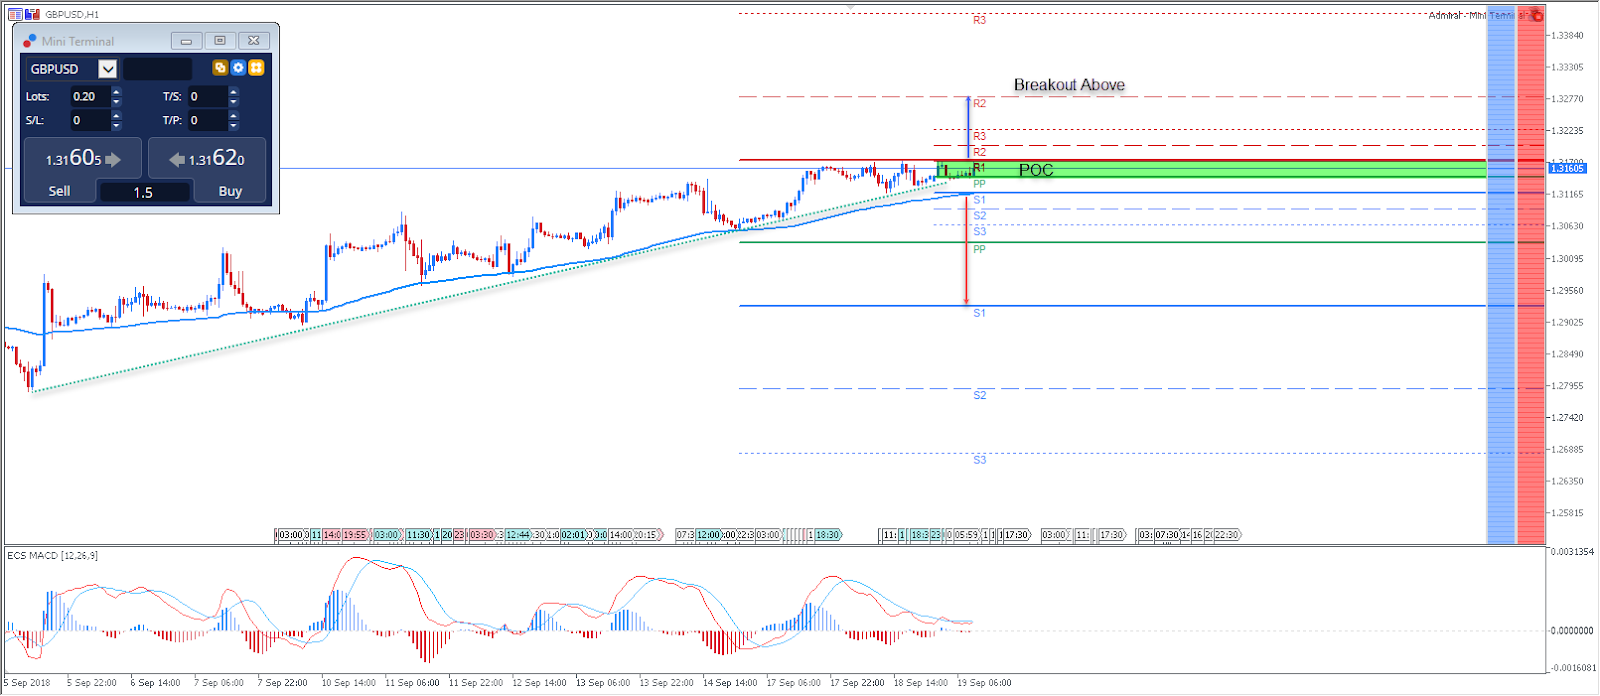
The GBPUSD currency pair has been recovering in the form of a bullish ZigZag, and at this point we can see a clear consolidation. The consolidation is occurring exactly between two important pivot points, that might break soon after the CPI data release, which is scheduled for 8:30 AM GMT+2. You can track economic announcements such as this via our Forex calendar, to ensure you don't miss them!
The CPI (Consumer Price Index) is the UK's most important inflation data. The Bank of England (BOE) uses it as the inflation target. Additionally, consumer prices account for a majority of overall inflation. Inflation is important to currency valuation because rising prices lead the central bank to raise interest rates out of respect for their inflation containment mandate.
Technically, the GBPUSD is bullish above 1.3170 and the targets are 1.3200, 1.3226 and 1.3280. Bears might get the advantage if the GBPUSD currency pair drops below S1, and the targets should be 1.3092, 1.3035 and 1.2980. However, depending on the CPI, the price could be bought on the dip as the pair is still supported by technical confluence of a zig zag pattern, an EMA, and a rising trend line. Additionally, the CPI is good for news traders, and attempting to make a potential trade just after a news release could be a good strategy for a fast scalping entry. Look for a deviation between the forecast results, as any deviation from the actual results might bring a lot of movement in the pair.
Short Pivot Lines - Daily Support and Resistance
Long Pivot Lines - Weekly Support and Resistance
POC - POC - Point Of Confluence (The zone where we expect the price to react - aka the entry zone)
The US Dollar Index Closed In The Negative Zone
The US dollar fell slightly against the basket of major currencies. The US dollar index (#DX) closed in the negative zone (-0.28%). However, in general, demand for the American currency is still high. Yesterday, the US introduced new duties on import of Chinese goods $200 billion worth. At the same time, Donald Trump threatened Beijing that if China retaliated, the US would be forced to introduce additional tariffs $267 billion worth.
Today, during the Asian trading session, a report on the monetary policy of the Bank of Japan has been published. As it became known, the regulator left the monetary policy unchanged. The 10-year government bonds yield of Japan remained at the level of around 0%, while the BoJ interest rate on deposits is at the level of -0.1%.
The "black gold" prices show positive dynamics. At the moment, futures for the WTI crude oil are testing a mark of $69.75 per barrel. Investors expect a report on the US crude oil inventories at 17:30 (GMT+3:00).
Market Indicators
Yesterday, the bullish sentiment was observed in the US stock market: #SPY (+0.54%), #DIA (+0.74%), #QQQ (+0.83%).
The 10-year US government bonds yield continues to show positive dynamics. At the moment, the indicator is at the level of 3.04-3.05%.
The news feed on 19.09.2018:
Consumer price index in the UK at 11:30 (GMT+3:00);
Statistics on the real estate market in the US at 15:30 (GMT+3:00).
We also recommend paying attention to the speech by the ECB president Draghi.
Forex Technical Analysis: EUR/USD, USD/JPY, GBP/USD
EUR/USD
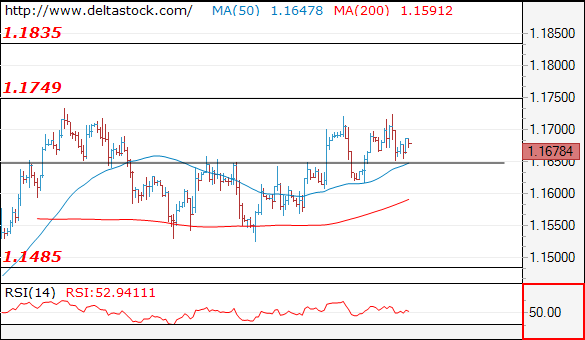
Current level - 1.1678
Still struggling below 1.1730, but a break through that area will clear the way for 1.1835. Initial intraday support lies at 1.1650, followed by 1.1610.
| Resistance | Support | ||
| intraday | intraweek | intraday | intraweek |
| 1.1730 | 1.1730 | 1.1650 | 1.1300 |
| 1.1840 | 1.1840 | 1.1530 | 1.1100 |
USD/JPY
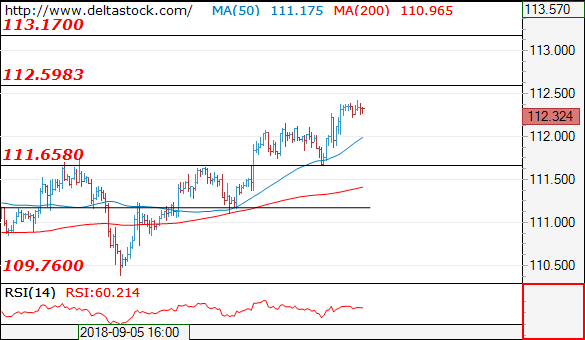
Current level - 112.32
The uptrend remains intact heading for a break through 112.60, en route to 113.20 area. Crucial low is projected at 111.65.
| Resistance | Support | ||
| intraday | intraweek | intraday | intraweek |
| 112.60 | 113.20 | 111.65 | 109.30 |
| 113.20 | 114.50 | 109.70 | 109.30 |
GBP/USD
Current level - 1.3169
Further rise is to be expected, towards 1.3250 zone. Crucial support lies at 1.3080-50 area.
| Resistance | Support | ||
| intraday | intraweek | intraday | intraweek |
| 1.3180 | 1.3120 | 1.3050 | 1.2570 |
| 1.3250 | 1.3250 | 1.2960 | 1.2570 |
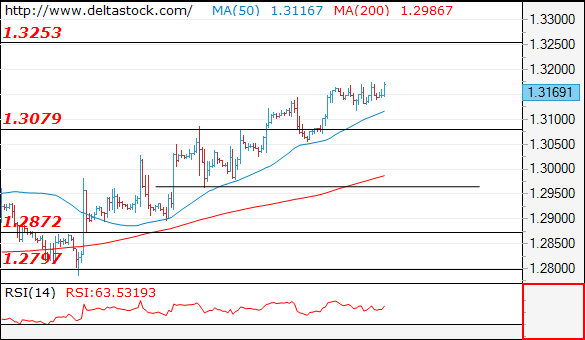
AUDUSD Oulook: Aussie Extends Recovery On Fresh Risk-On Mode
The pair holds in firm bullish mode for the third straight day and extends recovery leg from 0.7141(17 Sep trough) to probe through falling 30SMA (0.7244) and pressure key Fibo barrier at 0.7256 (61.8% of 0.7362/0.7085 descend).
Fresh extension higher was supported by decision of China to boost Yuan, which triggered fresh demand for riskier assets.
Further extension of short-covering could be expected on sustained break above 0.7268 Fibo barrier, which would expose falling 55SMA (0.7317).
North-heading momentum is approaching the border of positive territory and daily MA’s turning into more bullish setup, supporting the advance.
Broken 20SMA (0.7214) and broken Fibo 38.2% resistance (0.7198) mark solid supports which are expected to hold and maintain bullish bias.
Res: 0.7254, 0.7268, 0.7317, 0.7362
Sup: 0.7233, 0.7214, 0.7198, 0.7169
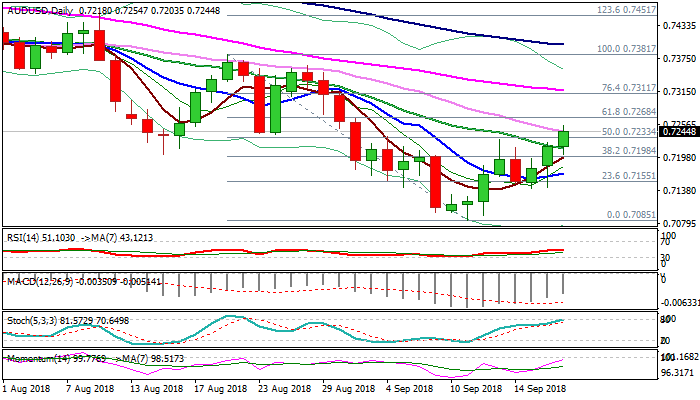
USDJPY Outlook: Extended Bulls Probe Through 112.37 Fibo Barrier
The pair holds in tight consolidation on Wednesday, following previous day's strong rally, when it advanced nearly half a percent.
Fresh two-month high was posted at 112.43 today, on probe through Fibo barrier at 112.37 (76.4% of 113.17/109.77 fall, where Tuesday's rally was capped.
Strong bullish acceleration higher revived momentum and sidelined risk top formation, leaving space for further stretch on sustained break above 112.37 pivot.
However, overbought slow stochastic gives initial warning, but the indicator is for now moving in sideways mode and lacking firmer signal.
Broken Fibo 61.8% barrier at 111.87 marks good support which is expected to contain extended dips and keep bulls in play.
Res: 112.62, 112.92, 113.17, 113.74
Sup: 112.22, 112.10, 111.87, 111.62
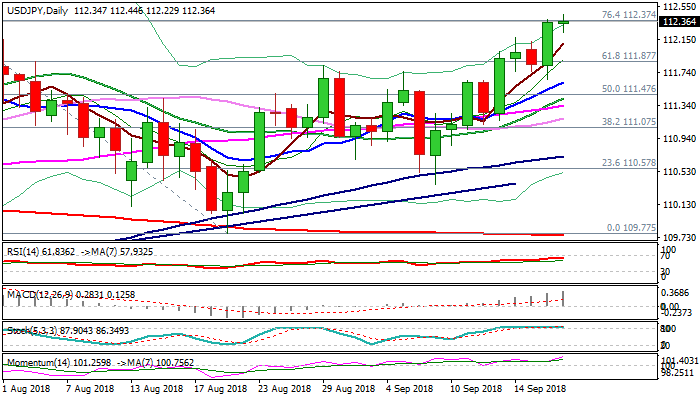
GBPUSD Outlook: Cable Stands At The Front Foot Ahead Of EU Summit/UK CPI Data
Cable stands at the front foot in early Wednesday’s trading and probes again above key barriers at 1.3162/63 (falling 100SMA / Fibo 61.8% of 1.3472/1.2661 descend, where the action in past two days faced strong headwinds.
Bullish techs support positive sentiment on hopes of reaching Brexit deal in coming months.
Two-day EU summit starts today and is on the list of top events for sterling, along with speech of BoE’s MPC member Haldane and release UK CPI data.
Annualized figure is expected to tick lower in Aug (2.4% f/c vs 2.5% prev) while monthly CPI is forecasted to rise 0.5% in Aug after staying unchanged previous month.
Upside surprise would provide fresh boost to sterling for eventual break through 1.3162/63 pivots and extension of recovery leg from 1.2661 (15 Aug low).
Top of falling and thickening daily cloud marks solid support at 1.3066, which should contain stronger dips and maintain bullish bias.
Res: 1.3176, 1.3213, 1.3280, 1.3335
Sup: 1.3136, 1.3118, 1.3066, 1.3008
EURUSD Outlook: Bullish Bias In Play For Renewed Attack At Strong 1.1730 Resistance Zone
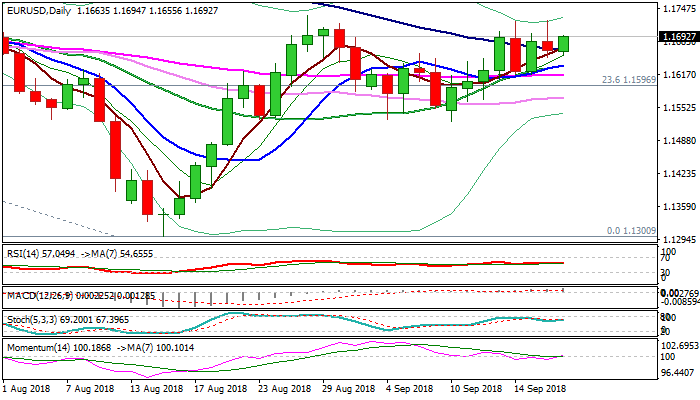
The Euro regained traction and bounced from Asian low at 1.1655, building hourly higher base and keeping bullish bias in play.
Renewed attempt higher is under way after bulls faced strong headwinds from 1.1730 resistance zone, which resulted in bearish daily candle with long upper shadow on Tuesday.
Return above falling 100SMA (1.1666) is bullish signal, reinforced by attempts to form 5/100SMA bull-cross, for fresh attack at 1.1733 (28 Aug high), break of which would unmask pivotal Fibo barrier at 1.1780 (38.2% retracement of 1.2555/1.1300 descend).
Break here is needed to complete inverse H/S pattern on weekly chart and signal further advance.
Momentum is breaking into positive territory and supporting scenario, along with daily MA’s in bullish confirmation, which also formed multiple bull-crosses. Broken 100SMA marks initial support, followed by converged 10/20SMA’s (1.1634) which are expected to keep the downside protected.
Res: 1.1724, 1.1733, 1.1750, 1.1780
Sup: 1.1666, 1.1634, 1.1616, 1.1601
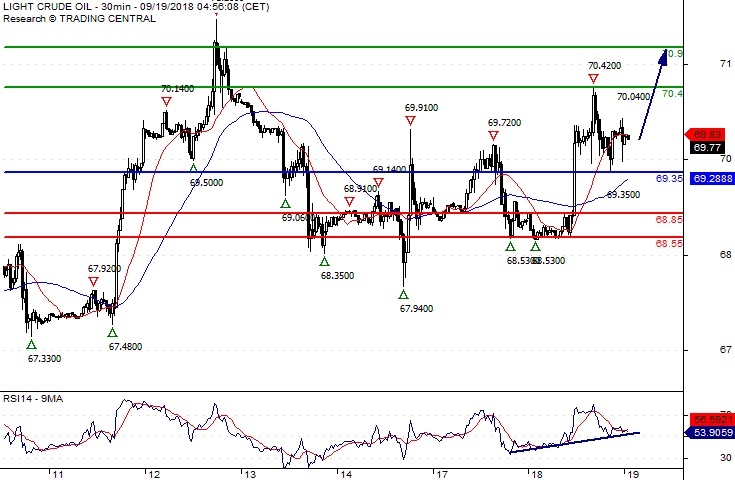
Crude Oil Further Upside
Pivot (invalidation): 69.35
Our preference Long positions above 69.35 with targets at 70.40 & 70.90 in extension.
Alternative scenario Below 69.35 look for further downside with 68.85 & 68.55 as targets.
Comment The RSI is supported by a rising trend line.
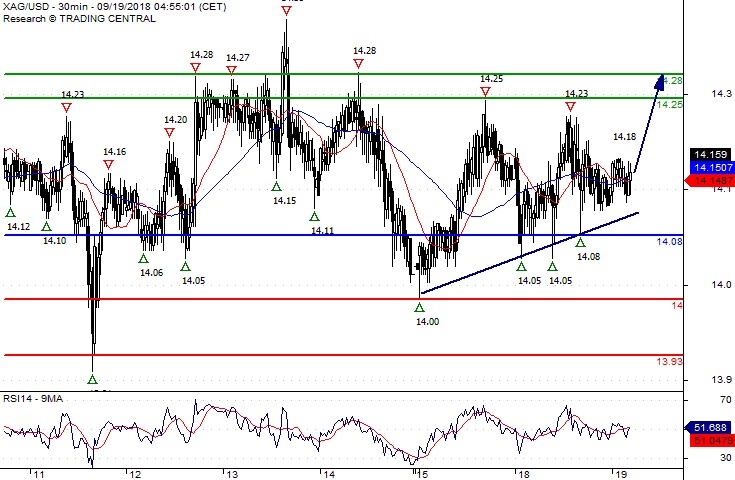
Silver Spot The Bias Remains Bullish
Pivot (invalidation): 14.0800
Our preference Long positions above 14.0800 with targets at 14.2500 & 14.2800 in extension.
Alternative scenario Below 14.0800 look for further downside with 14.0000 & 13.9300 as targets.
Comment The RSI is mixed with a bullish bias.