Sample Category Title
Swiss Franc Trading Higher In The Asian Session
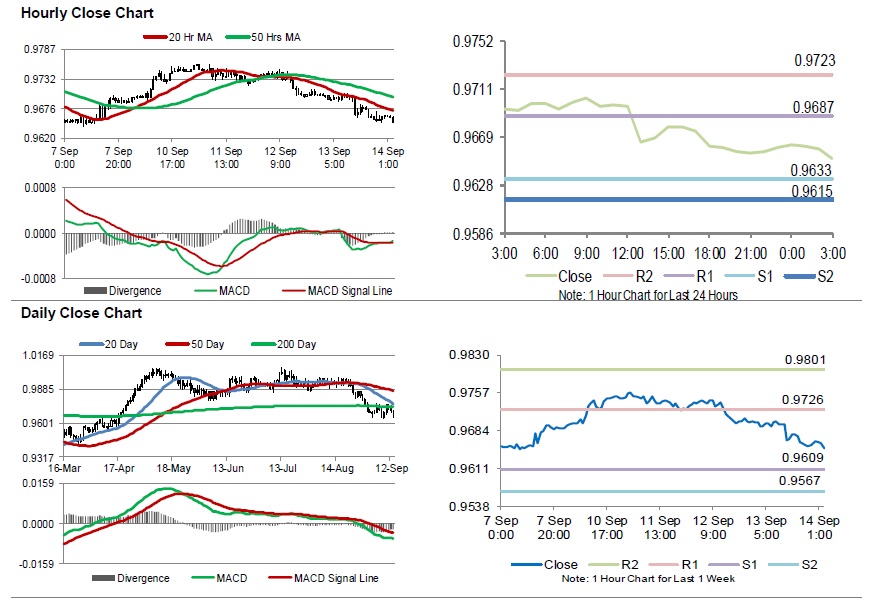
For the 24 hours to 23:00 GMT, the USD declined 0.42% against the CHF and closed at 0.9660.
In the macro news, Switzerland’s producer and import price index rose 3.4% on an annual basis in August, at par with market expectations. The index had recorded a gain of 3.6% in the previous month.
In the Asian session, at GMT0300, the pair is trading at 0.9651, with the USD trading 0.09% lower against the CHF from yesterday’s close.
The pair is expected to find support at 0.9633, and a fall through could take it to the next support level of 0.9615. The pair is expected to find its first resistance at 0.9687, and a rise through could take it to the next resistance level of 0.9723.
Moving forward, investors would keep an eye on the Swiss National Bank (SNB) interest rate decision and trade balance data, slated to release next week.
The currency pair is trading below its 20 Hr and 50 Hr moving averages.
Canada’s New House Price Index Rose As Estimated In July
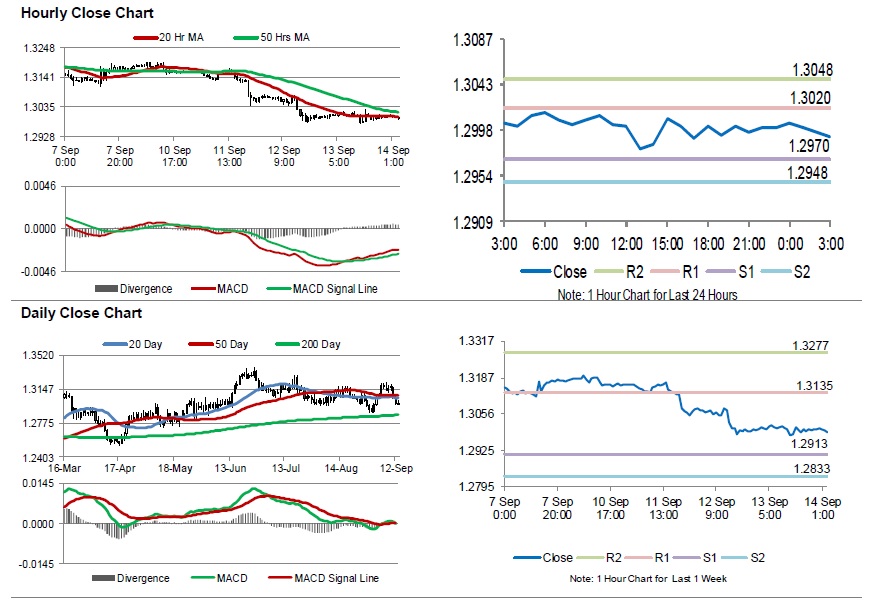
For the 24 hours to 23:00 GMT, the USD rose slightly against the CAD and closed at 1.3001.
Data indicated that, Canada's new housing price index advanced 0.1% on a monthly basis in July, in line with market expectations. In the previous month, the index had registered a similar rise.
In the Asian session, at GMT0300, the pair is trading at 1.2992, with the USD trading 0.07% lower against the CAD from yesterday's close.
The pair is expected to find support at 1.2970, and a fall through could take it to the next support level of 1.2948. The pair is expected to find its first resistance at 1.3020, and a rise through could take it to the next resistance level of 1.3048.
Looking ahead, traders would await Canada's consumer price index, existing home sales and manufacturing sales, all set to release next week
The currency pair is showing convergence with its 20 Hr moving average and trading below its 50 Hr moving average
Aussie Trading A Tad Higher In The Morning Session
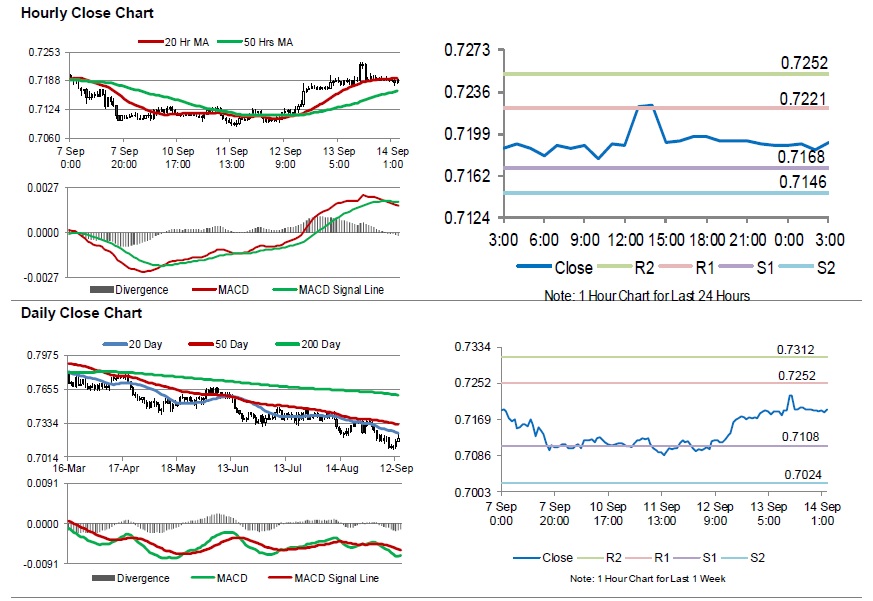
For the 24 hours to 23:00 GMT, the AUD rose 0.25% against the USD and closed at 0.7189.
LME Copper prices rose 1.7% or $100.0/MT to $5991.0/MT. Aluminium prices rose 1.7% or $33.0/MT to $2014.5/MT.
In the Asian session, at GMT0300, the pair is trading at 0.7191, with the AUD trading slightly higher against the USD from yesterday’s close.
Elsewhere in China, Australia’s largest trading partner, retail sales surged 9.0% on a yearly basis in August, more than market consensus for an advance of 8.8%. Retail sales had advanced 8.8% in the prior month. Moreover, the nation’s industrial production jumped 6.1% on an annual basis in August, in line with market forecast and compared to a gain of 6.0% in the preceding month.
The pair is expected to find support at 0.7168, and a fall through could take it to the next support level of 0.7146. The pair is expected to find its first resistance at 0.7221, and a rise through could take it to the next resistance level of 0.7252.
The currency pair is showing convergence with its 20 Hr moving average and trading above its 50 Hr moving average.
Gold: Yellow Metal Reverses Its Losses In The Asian Session
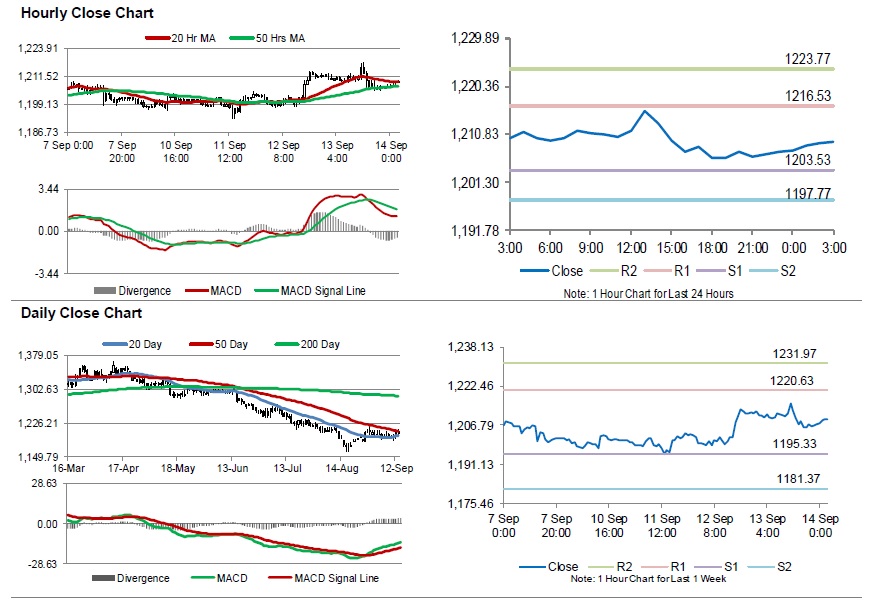
For the 24 hours to 23:00 GMT, Gold declined 0.40% against the USD and closed at USD1206.90 per ounce amid hopes for a new round of US-China trade talks.
In the Asian session, at GMT0300, the pair is trading at 1209.30, with gold trading 0.20% higher against the USD from yesterday’s close.
The pair is expected to find support at 1203.53, and a fall through could take it to the next support level of 1197.77. The pair is expected to find its first resistance at 1216.53, and a rise through could take it to the next resistance level of 1223.77.
The yellow metal is showing convergence with its 20 Hr moving average and trading above its 50 Hr moving average.
Silver: White Metal Trading On A Stronger Footing This Morning
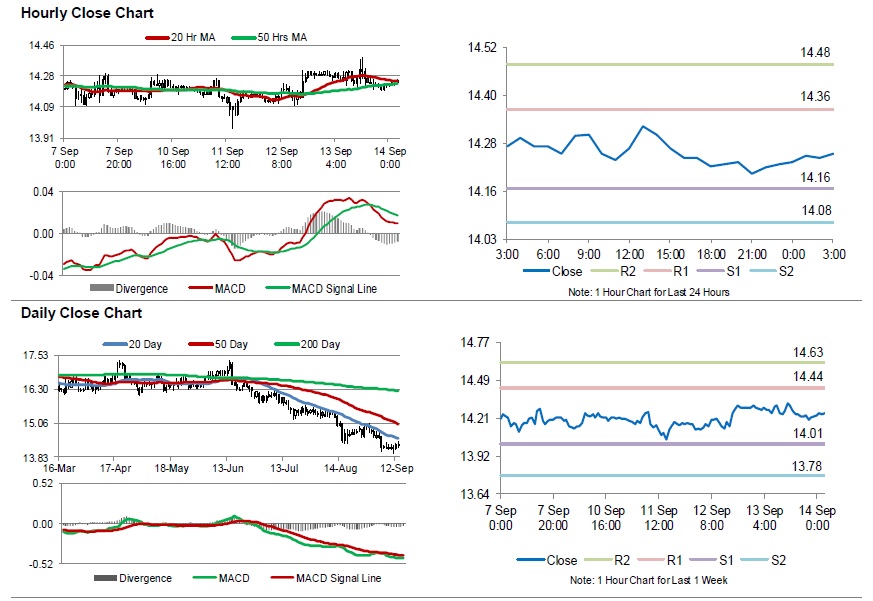
For the 24 hours to 23:00 GMT, Silver declined 0.42% against the USD and closed at USD14.23 per ounce, tracking losses in gold prices.
In the Asian session, at GMT0300, the pair is trading at 14.25, with silver trading 0.18% higher against the USD from yesterday’s close.
The pair is expected to find support at 14.16, and a fall through could take it to the next support level of 14.08. The pair is expected to find its first resistance at 14.36, and a rise through could take it to the next resistance level of 14.48.
The white metal is showing convergence with its 20 Hr and 50 Hr moving averages.
Crude Oil: Oil Trading Higher, Ahead Of Baker Hughes Weekly Rig Count Data
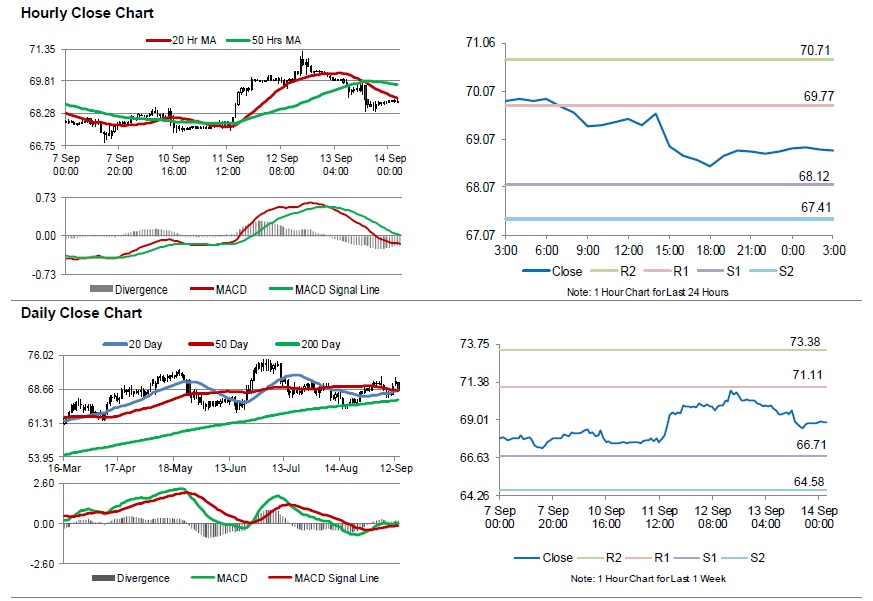
For the 24 hours to 23:00 GMT, Crude Oil declined 2.04% against the USD and closed at USD68.80 per barrel amid concerns that emerging market crises and trade disputes could lower demand for the commodity. Additionally, the International Energy Agency reported that daily crude-oil output in the OPEC climbed by 420,000bls a day to average 32.63mn a day in August.
In the Asian session, at GMT0300, the pair is trading at 68.83, with oil trading slightly higher against the USD from yesterday’s close.
The pair is expected to find support at 68.12, and a fall through could take it to the next support level of 67.41. The pair is expected to find its first resistance at 69.77, and a rise through could take it to the next resistance level of 70.71.
Crude oil is trading below its 20 Hr and 50 Hr moving averages.
USD/JPY Daily Outlook
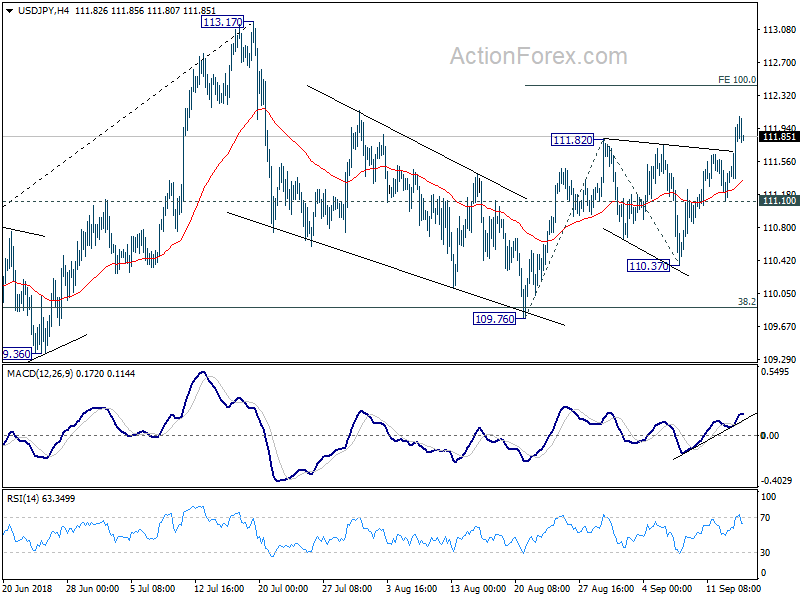
Daily Pivots: (S1) 111.39; (P) 111.69; (R1) 112.24; More...
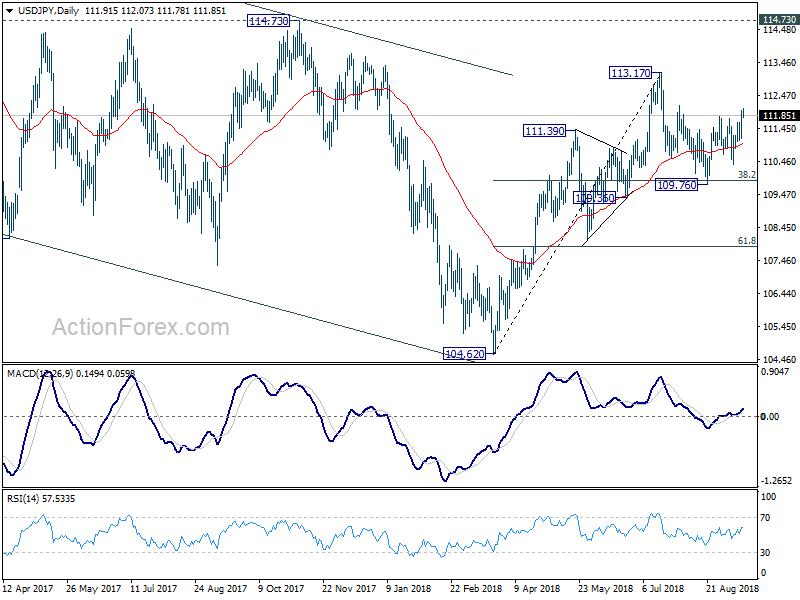
USD/JPY's break of 111.82 resistance finally confirmed resumption of rebound from 109.76. Intraday bias is now on the upside for 100% projection of 109.76 to 111.82 from 110.37 at 112.43 first. Break will target a test on 113.17 high. On the downside, below 111.10 minor support will delay the bullish case again and turn bias neutral first.
In the bigger picture, corrective fall from 118.65 (2016 high) should have completed with three waves down to 104.62. Decisive break of 114.73 resistance will likely resume whole rally from 98.97 (2016 low) to 100% projection of 98.97 to 118.65 from 104.62 at 124.30, which is reasonably close to 125.85 (2015 high). This will stay as the preferred case as long as 109.36 support holds. However, decisive break of 109.36 will mix up the outlook again. And deeper fall should be seen back to 61.8% retracement of 104.62 to 113.17 at 107.88 and below.
USD/CHF Daily Outlook
Daily Pivots: (S1) 0.9633; (P) 0.9675; (R1) 0.9699; More.....
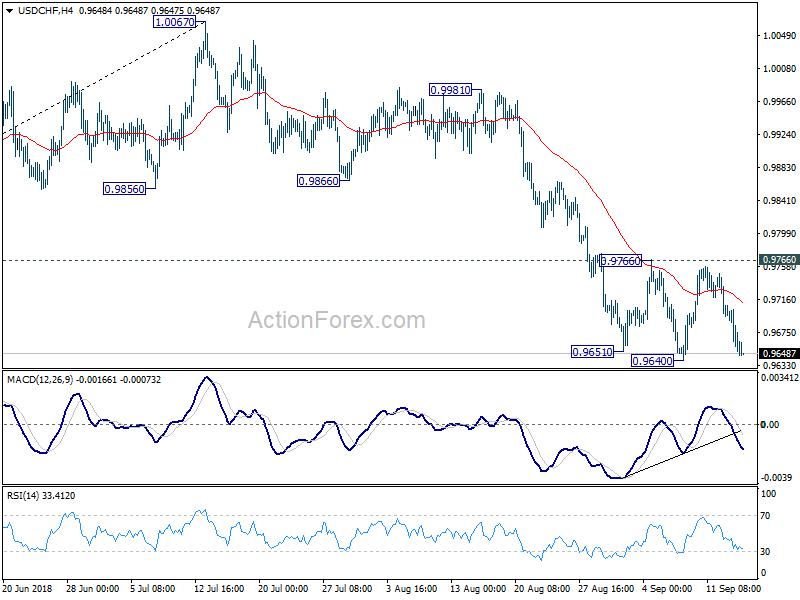
Focus remains on 0.9640 low in USD/CHF. Decisive break there will resume whole fall from 1.0067. Next downside target will be 0.9523 fibonacci level. On the upside, break of 0.9766 resistance is needed to indicate near term reversal. Otherwise, outlook will stay bearish even in case of recovery.
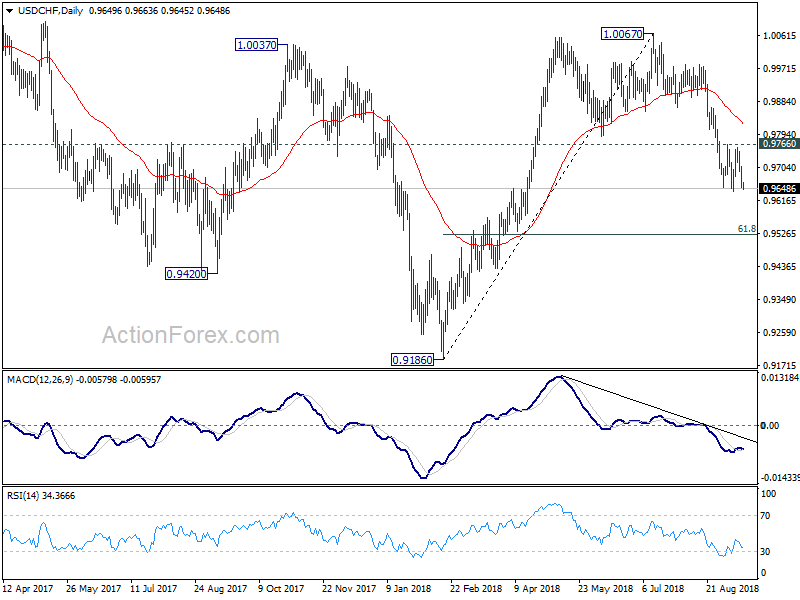
In the bigger picture, current development suggests that rise from 0.9186 low has completed at 1.0067, after failing to sustain above 1.0037 resistance. Fall from 1.0067 could extend to 61.8% retracement of 0.9816 to 1.0067 at 0.9523 and below. But for now, we don't expect a break of 0.9186 low. On the upside, firm break of 0.9866 support turned resistance will suggests that fall from 1.0067 has completed and rise from 0.9186 is resuming.
GBP/USD Daily Outlook
Daily Pivots: (S1) 1.3048; (P) 1.3085; (R1) 1.3143; More...
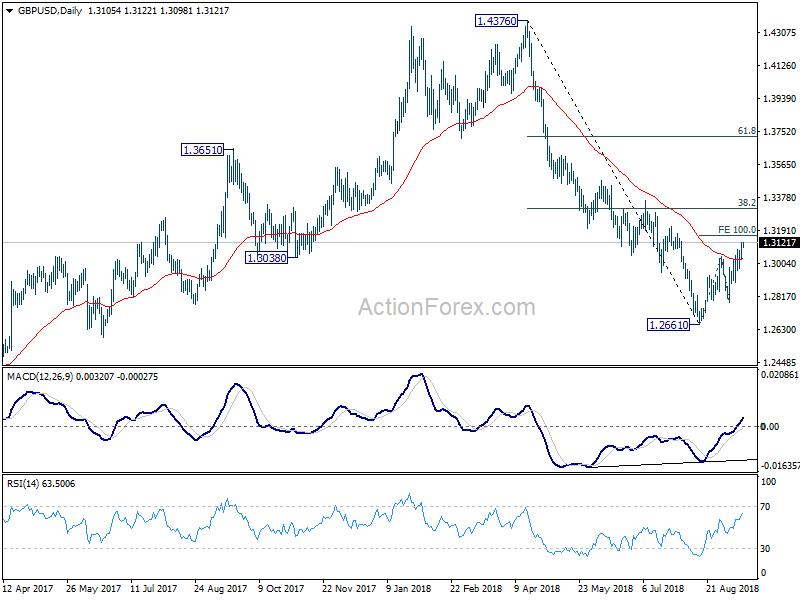
Intraday bias in GBP/USD remains on the upside at this point. Current rebound from 1.2661 is on track to 100% projection of 1.2661 to 1.3042 from 1.2784 at 1.3165, and possibly above. However, such rebound is still seen as a corrective move. Hence, Upside should be limited by 1.3316 key fibonacci level to bring near term reversal. On the downside, break of 1.2963 minor support will now argue that rebound from 1.2661 has completed. In such case, intraday bias will be turned back to the downside for 1.2784 and then 1.2661.
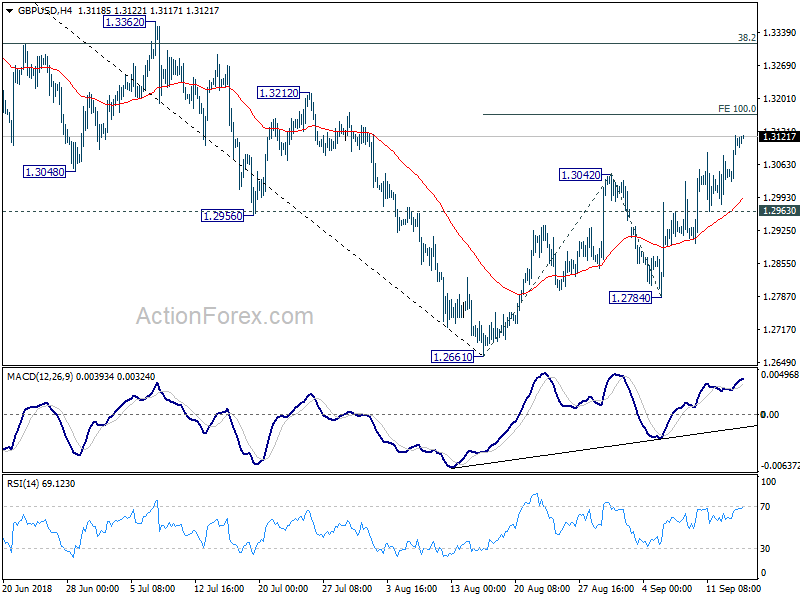
In the bigger picture, whole medium term rebound from 1.1946 (2016 low) should have completed at 1.4376 already, after rejection from 55 month EMA (now at 1.4099). The structure and momentum of the fall from 1.4376 argues that it's resuming long term down trend. And this will be the preferred case as long as 38.2% retracement of 1.4376 to 1.2661 at 1.3316 holds. However, firm break of 1.3316 would bring stronger rebound to 61.8% retracement at 1.3721. And, the eventual depth of the fall from 1.4376, and the chance of hitting 1.1946 low, will depend on the strength of the interim corrective rebound from 1.2661.
EUR/USD Daily Outlook
Daily Pivots: (S1) 1.1632; (P) 1.1667; (R1) 1.1725; More.....
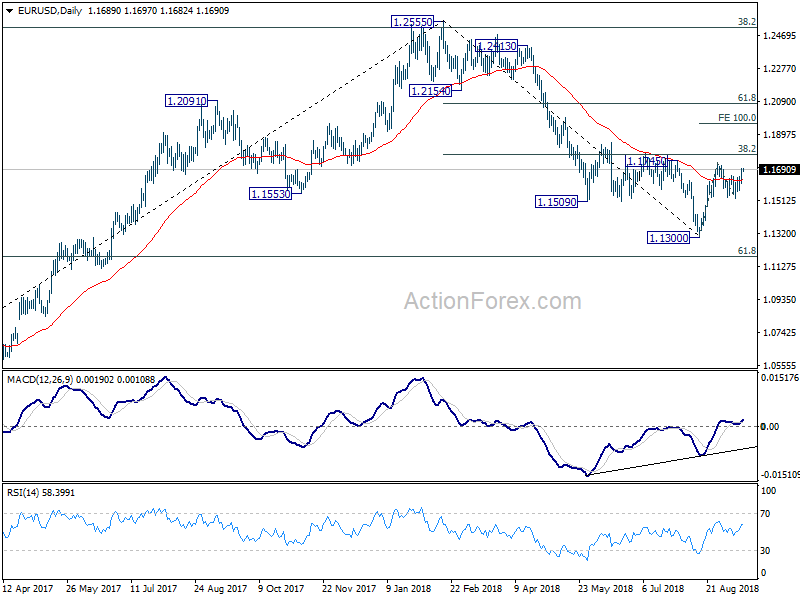
Intraday bias in EUR/USD remains on the upside for 1.1733 resistance and above. For now, we'd still expect strong resistance from 38.2% retracement of 1.2555 to 1.1300 at 1.1779 to limit upside. On the downside, break of 1.1608 minor support will turn bias to the downside for 1.1525 support. Break will indicate completion of whole rebound from 1.1300. However, firm break of 1.1779 will extend the rise to 100% projection of 1.1300 to 1.1733 from 1.1525 at 1.1958.
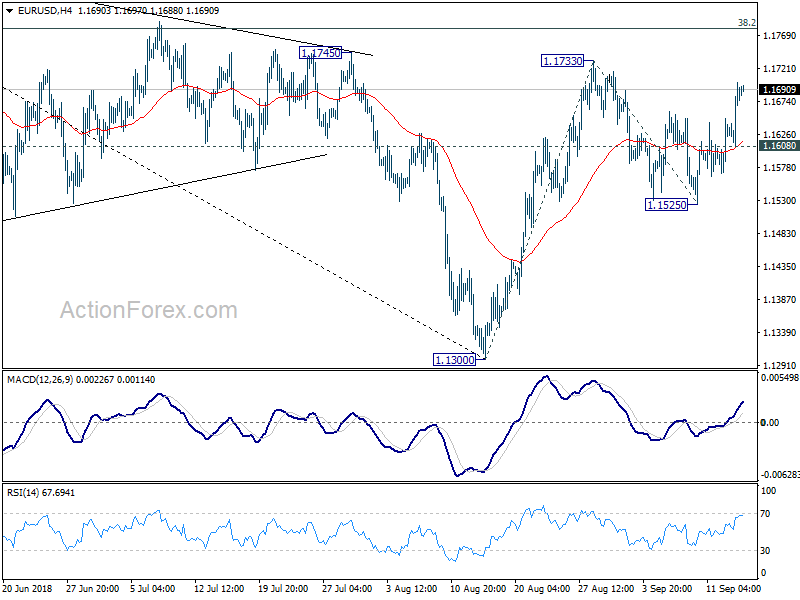
In the bigger picture, a medium term bottom should be in place at 1.1300, on bullish convergence condition in daily MACD and some consolidations would be seen. But still, note that EUR/USD was rejected by 38.2% retracement of 1.6039 (2008 high) to 1.0339 (2017 low) at 1.2516. That carries some long term bearish implications. Thus, we'd expect fall from 1.2555 high to resume after consolidation completes. Below 1.1300 should send EUR/USD through 61.8% retracement of 1.0339 to 1.2555 at 1.1186. And, in that case, EUR/USD would head to retest 1.0339 (2017 low).