Sample Category Title
Sterling Falls Against The USD As Traders Eye Key Data
On Friday, the dollar strengthened after data from the Department of Labor showed a tightening labor market and wage growth. In August, wages rose at an annualized rate of 2.9%, which was the highest growth rate in nine years. While this was positive news, it also brought worries that the Fed will continue hiking interest rates.
Pound sterling was a major market mover last week. On Wednesday, it jumped after Germany and the UK took steps towards a smoother Brexit deal. It jumped further on Friday after a transcript of a statement by Michael Bernier showed that the EU was ready to offer some concessions. Today, the sterling will likely be volatile as the ONS releases crucial data on the GDP, manufacturing, trade, and industrial production. Tomorrow, it will release the jobs numbers and on Thursday, the BOE will deliver its interest rates decision.
With regards to trading, the public hearings session on the proposed $267 billion worth of Chinese tariffs ended last week. On Friday, Trump indicated that the tariffs will go on, which led to a lengthy letter by Apple, decrying the proposed tariffs. The company said that the tariffs will be a tax to consumers, who will be forced to pay higher prices. There are indications that China will implement non-tariff-based retaliations such as halting the purchases of US treasuries.
The Japanese yen strengthened against the USD after Japan released GDP numbers for the second quarter. In the quarter, the economy expanded by 3.0%, which was higher than the expected 2.6%. This growth was attributed to the increased spending on capital expenditures by Japanese firms. The data provided some relief to Japanese policymakers but the recent soft data like the exports and factory outputs coupled by recent floods and earthquakes have lowered expectations for the third quarter.
NAS100
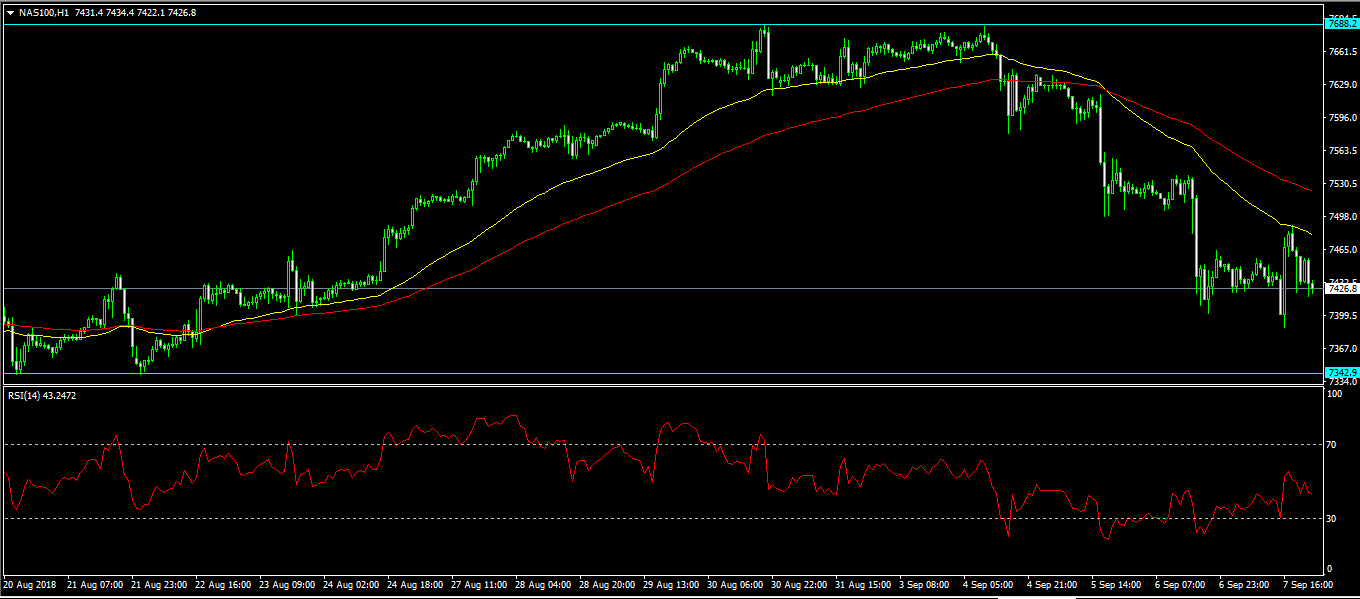
Last week, the Nasdaq index reached an all-time high of $7688 and established a strong top position as shown below. On Friday, the index started falling as traders waited for a decision on tariffs. It ended the week at the $7325 level. The longer-term EMA (100) crossed the shorter-term EMA (50), which is a sign that the downward momentum could continue. Today, the index is likely to hit the important support of $7340 as the trade rhetoric escalates.
USD/JPY
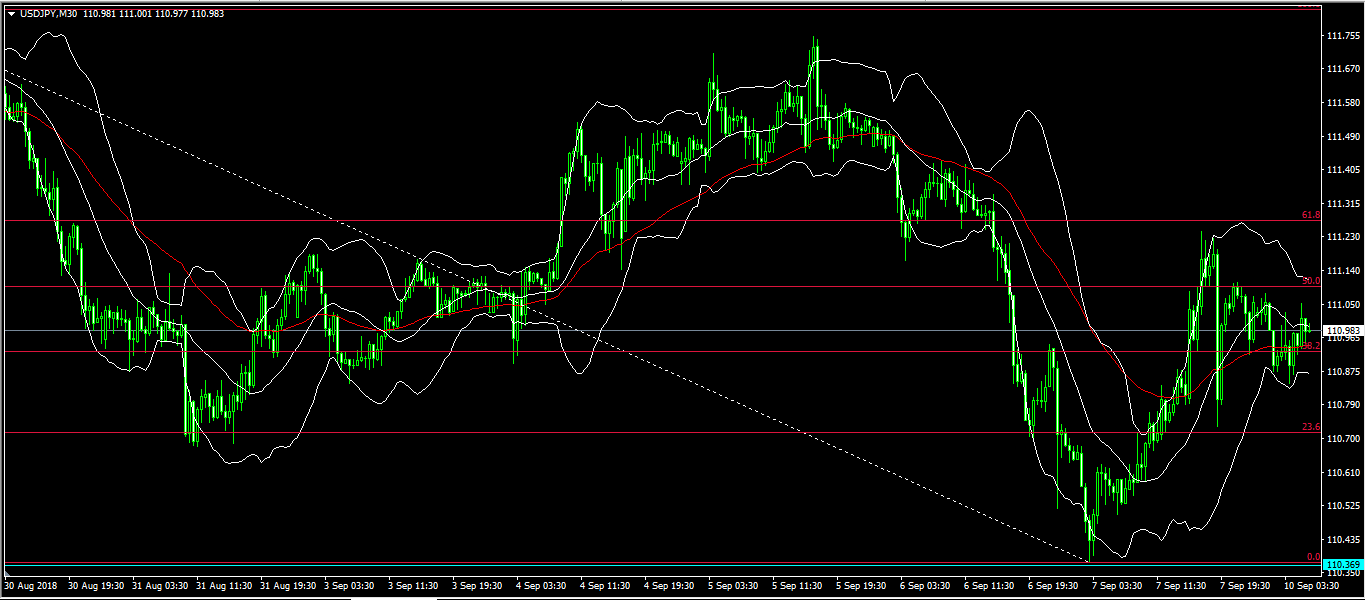
The USD/JPY pair fell to an intraday low of 110.734. It then rose to a high of 111.09 as trade war talks clouded the good economic data from Japan. The current price is between the 38.2% and 50% Fibonacci Retracement level. It is also slightly above the 50-day EMA and on the middle band of the Bollinger Bands. The pair could continue moving up to the upper band of 111.126 and then proceed to the important resistance level of 111.270. If it reverses, it could move to the 110.827 level.
EUR/USD
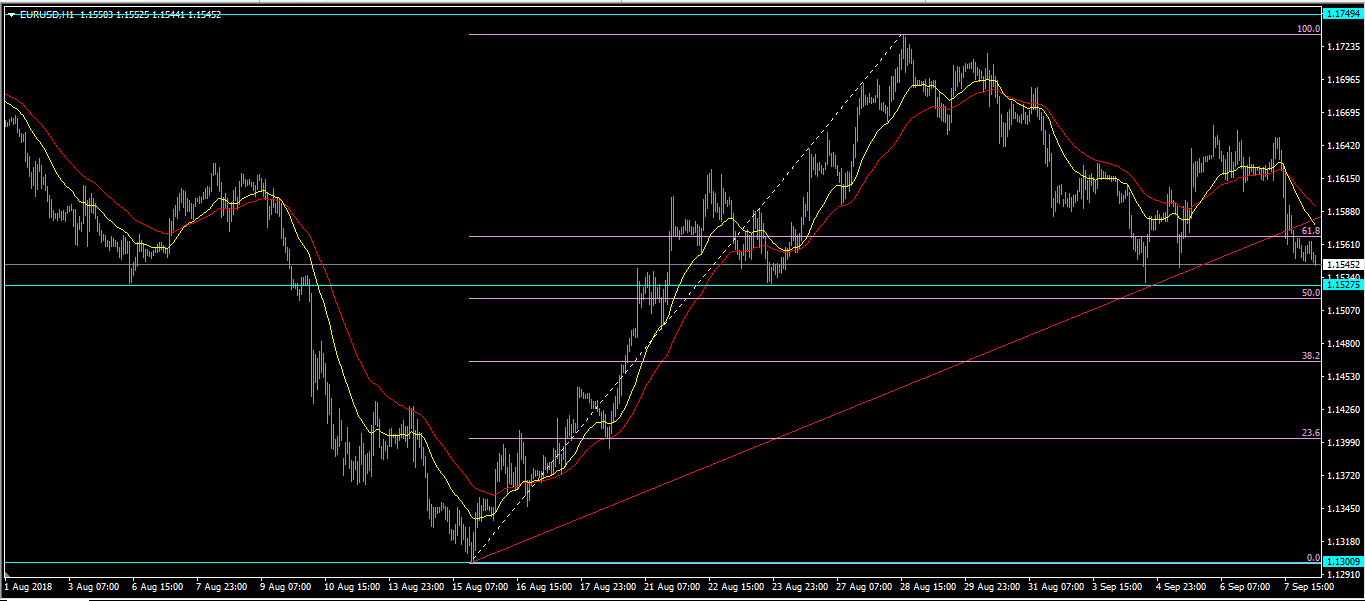
On Friday, the EUR/USD pair moved below the important support level of 1.1573. The longer-term EMA also crossed the shorter-term EMA, which was a sign that the downward momentum could continue. Today, in the Asian session, the pair continued the slide and the pair reached an intraday low of 1.1546. If the pair continues moving lower, it will test the support of the 1.1527 level, which is also slightly above the 50% Fibonacci Retracement level.
EURUSD Stays Neutral Below 1.1600
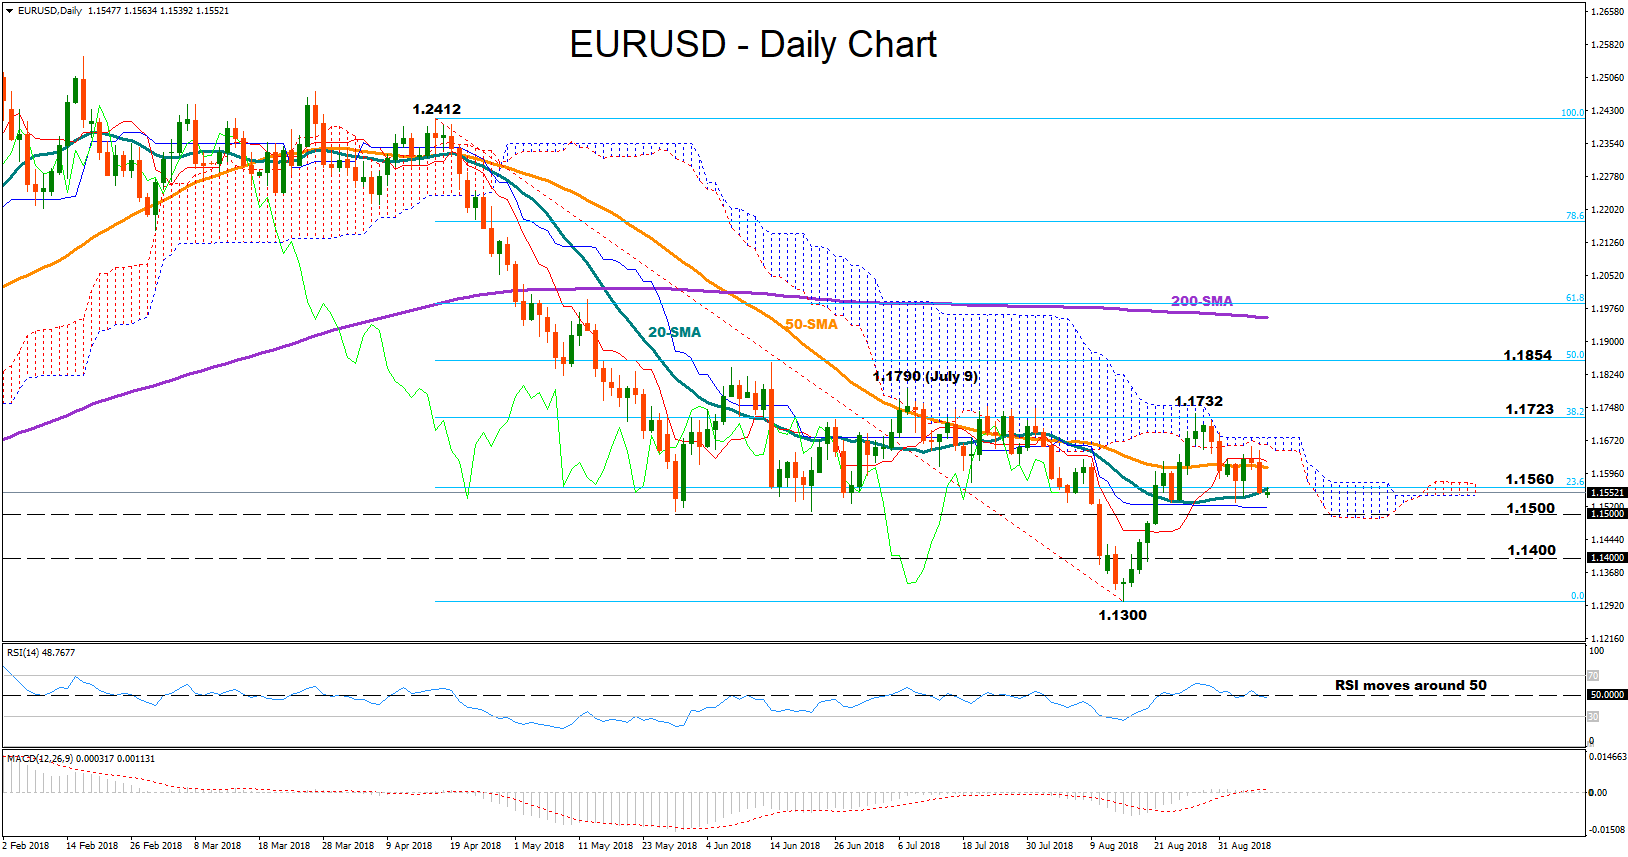
EURUSD closed below the 1.1600 key level after a negative session on Friday, though the pair remains neutral since the end of August, trading between 1.1529- 1.1732. In the short-term, consolidation is likely to stay in place as the RSI continues to move around its 50 neutral mark and the MACD holds around zero and its red signal line.
A leg higher could meet immediate resistance at the 23.6% Fibonacci of the downleg from 1.2412 to 1.1300, near 1.1560 where the 20-day simple moving average is currently located. Further up, the area between the 38.2% Fibonacci of 1.1723 and July 9’s peak of 1.1790 could be the next target ahead of the 50% Fibonacci of 1.1854, which if successfully broken, bullish actions could gain stronger momentum, potentially confirming the start of an uptrend.
In the alternative scenario, an extension to the downside may find a challenge at 1.1500 which the market was unable to breach a couple of times since the end of May. However, if the price manages to cross below that point, traders could look for support around 1.1400 before eyes turn to the 1.1300 bottom.
In the medium-term picture, the pair has been lacking direction over the past three months, a status which is not expected to change into a bullish one unless the price breaks above the 50% Fibonacci of 1.1854. A bearish outlook could resume below 1.1300.
To sum up, EURUSD outlook is neutral both in the short and the medium-term picture
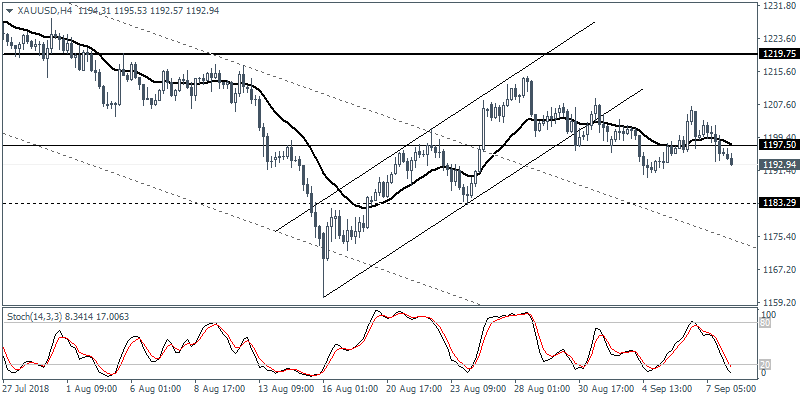
XAUUSD Intraday Analysis
XAUUSD (1192.94): Gold was trading flat on Friday. Despite the previous attempt to break above 1197.50 the precious metal gradually gave up the gains. The 20-period EMA on the 4-hour chart is flat indicating the sideways price action. However, the daily chart is signaling a potential bearish flag pattern. With the recent bounce failing to test new highs, the precious metal could be seen heading lower. Watch for the retest of support at 1183.30 region in the short term.
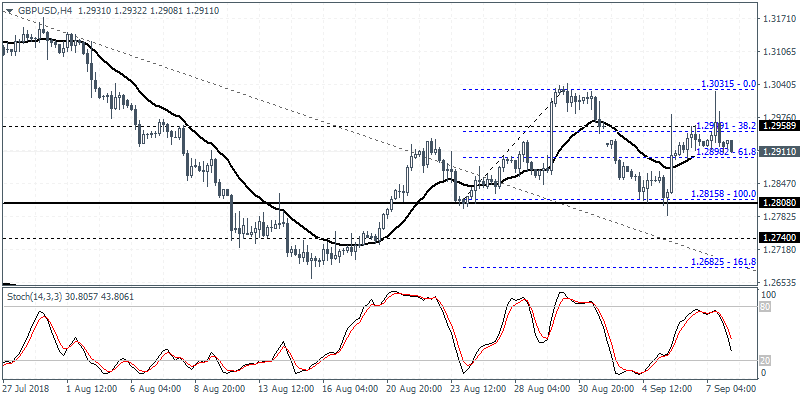
GBPUSD Intraday Analysis
GBPUSD (1.2911): The British pound continues to remain volatile with the currency pair reacting to any report on Brexit talks. After rising to session highs of 1.3028, the currency pair fell back towards Friday's close. We continue to watch the potential head and shoulders pattern that is evolving. A continued decline to 1.2808 neckline support and a break down below this level will trigger further selling. This could push the cable down to 1.2682 as the measured downside target.
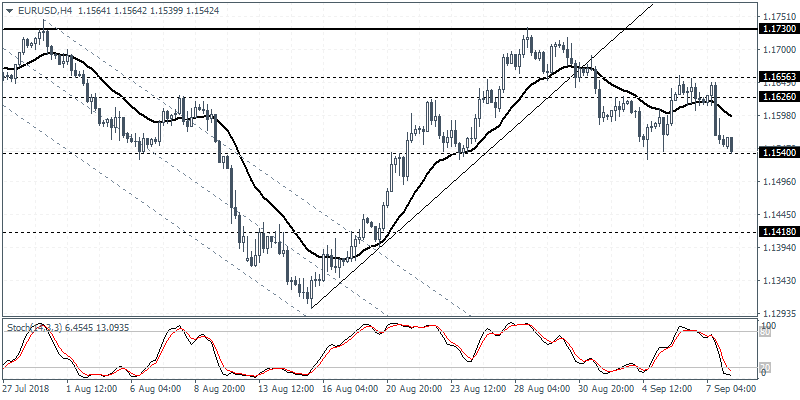
EURUSD Intraday Analysis
EURUSD (1.1539): The EURUSD extended declines on Friday as price action is seen testing the 1.1540 level of support. With the ECB's monetary policy meeting due later this week, the currency pair could ease back and settle into a range ahead of Thursday's big ticket event. The support at 1.1540 will be crucial as a break down below this level could send the common currency down to 1.1418 support. To the upside, the resistance area of 1.16656 - 1.1626 will need to be breached to post further gains.
EUR/GBP Daily Outlook
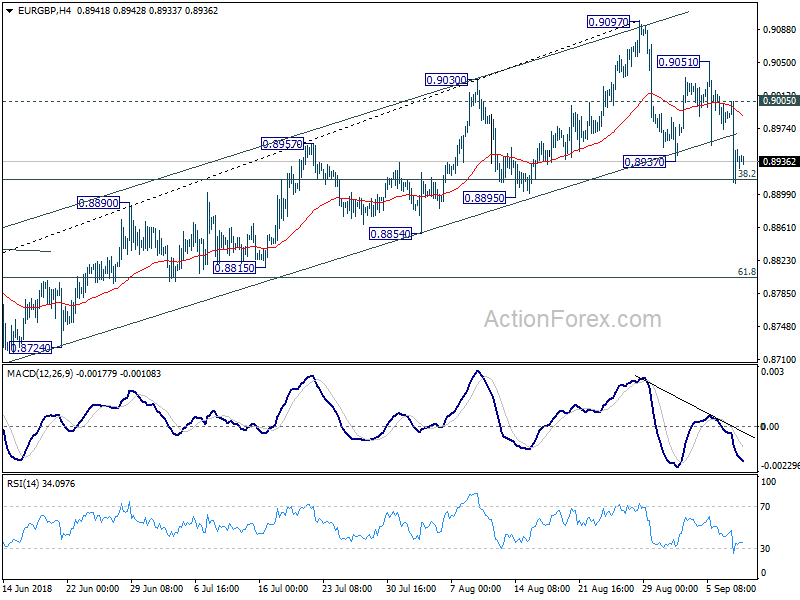
Daily Pivots: (S1) 0.8902; (P) 0.8956; (R1) 0.8997; More...
Intraday bias in EUR/GBP remains on the downside at this point. A short term top was formed at 0.9097, and the corrective rise from 0.8620 could have completed too. Firm break of 38.2% retracement of 0.8620 to 0.9097 at 0.8915 will affirm our bearish view and target 61.8% retracement at 0.8802 and below. On the upside, though, above 0.9005 minor resistance will turn focus back to 0.9097 high instead.
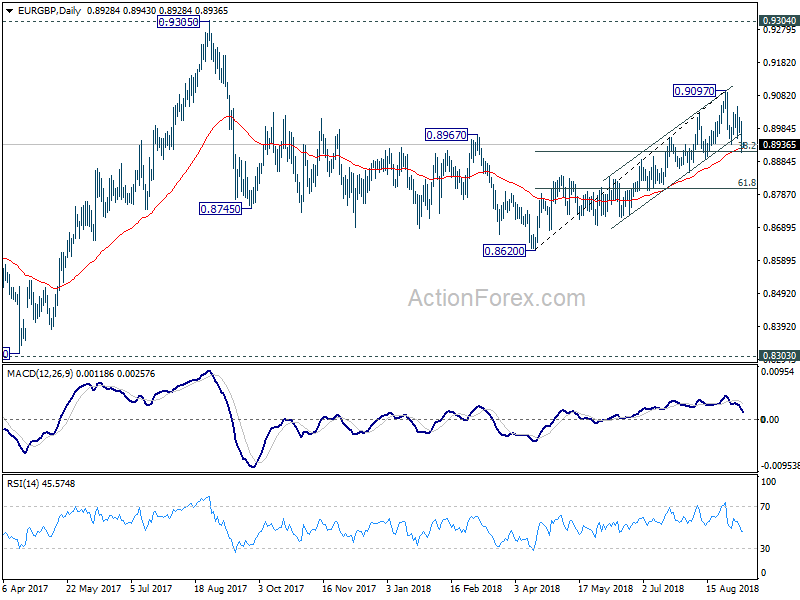
In the bigger picture, EUR/GBP is staying in long term range pattern from 0.9304 (2016 high). At this point, there is no clear sign of range break out yet. And more corrective trading would continue. On the upside, in case of another rise, we'd stay cautious on strong resistance from 0.9304/5 to limit upside in case of further rally. Meanwhile, if there is another medium term decline, strong support will likely be seen from 0.8303 to contain downside.
USD To Open The Week On A Firm Footing
The U.S. dollar posted strong gains on Friday fuelled by strong wage growth and overall positive sentiment for the currency. The official payrolls report for the month of August showed that the U.S. economy added 201,000 jobs during the beat.
This beat estimates of a 191k forecast. The unemployment rate held steady at 3.9% while the average hourly earnings doubled to rise 0.4%, beating estimates of a 0.2% increase.
On a year over year basis, average earnings rose 2.9% in August.
Canada's jobs report was also released on Friday. Data showed that the economy shed 51.6k jobs during August with the unemployment rate rising to 6.0%.
Elsewhere, volatility spiked in the British pound once again on Brexit headlines but the cable soon eased back to give up its gains.
Earlier today, Japan released its final quarterly GDP figures. As expected, there were no revisions with the economy rising 0.7% in the second quarter. The data comes ahead of the BoJ's meeting due the week after.
China's inflation figures were also released. Data showed that headline CPI rose 2.3% beating estimates of a 2.1% increase. Producer prices jumped 4.1%, in line with estimates but slower than 4.6% from the month before.
Later in the day, the UK's monthly GDP report will be released. Economists forecast a 0.2% increase on the month for August. The data is followed by industrial, manufacturing and construction output.
The NY trading session is relatively quiet for the day
Investors Still Playing Defensive As Trade War Enters A New Phase
Asian stocks started the week in negative territory and the dollar traded higher as investors continued to monitor the escalating U.S. trade war with . President Trump threatened last week that he's ready to impose tariffs on $267 billion in Chinese goods on top of the proposed $200 billion that may come into effect soon. The total sum would then cover all U.S. imported goods from China, which is definitely not yet priced in the financial markets.
U.S. equity investors who have ignored the selloff in emerging market assets over the past couple of months started looking a bit shaky last week. The S&P 500 ended last week 1% lower, while the Nasdaq composite declined 2.55%. It's unclear yet whether the contagion effect has started spreading into U.S. assets, but if signs of stress begin to show in U.S. equities, expect to see further steep selloffs in global equity markets. It requires remarkable positive news to sway investors from the ongoing EM troubles and escalating trade tensions - and so far, there isn't any.
The dollar has become the destination for safe-haven flows amid the escalation of trade tensions, but also supporting the greenback was the recent batch of economic data. The latest ISM data showed manufacturing and service sectors activity grew faster than most optimistic economists' predictions. Job growth remains robust, but more importantly, wage growth hit a nine-year high in August. The upcoming data this week may also show solid performance for retail sales and consumer inflation. This should further boost expectations for two more rate hikes in 2018, leading to further divergence in monetary policies.
Investors this week will also focus on monetary policy decisions, particularly emerging marketscentral banks which are aiming to put an end to their currency turmoil. The Turkish central bank will be -front and center on Thursday after policymakers vowed to step in to contain inflationary pressures. I think a rate hike is imminent, but it's the magnitude of the rate hike thatmatters now. The central bank needs to push rates to more than 600 basis points to restore investors' confidence and bring real interest rates into positive territory. Any disappointment here will likely lead to a continued selloff in the Turkish Lira.
The European Central Bank and Bank of England will also be meeting on Thursday, but do not expect a lot of excitement here. ECB President Draghi will likely give reassurance that the ECBbond buying stimulus program will be ending by year's end. Meanwhile, investors would like to know what the BoE's views are on the latest Brexit talks. However, both central banks will stand pat on rates.
EUR/AUD Daily Outlook
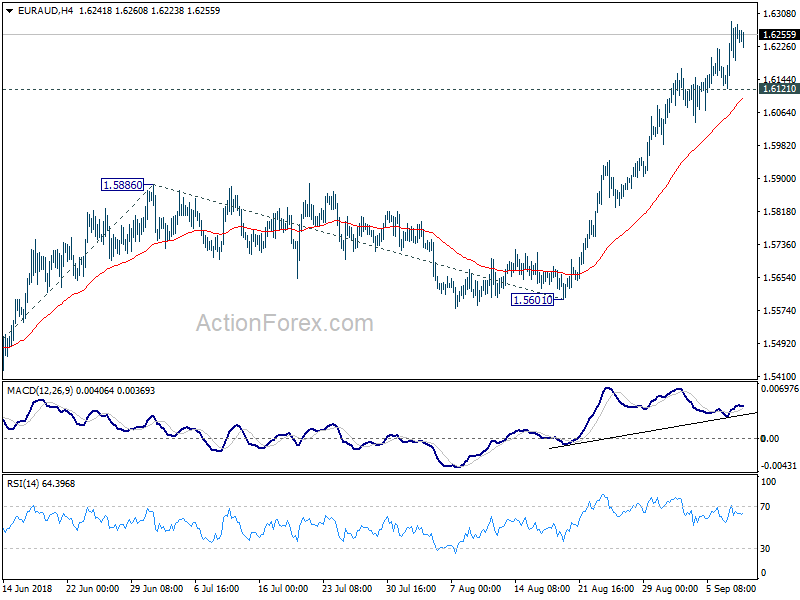
Daily Pivots: (S1) 1.6160; (P) 1.6226; (R1) 1.6323; More....
Intraday bias in EUR/AUD remains on the upside at this point. Current rally should target 161.8% projection of 1.5271 to 1.5886 from 1.5601 at 1.6596, which is close to another key resistance level at 1.6587. On the downside, below 1.6121 minor support will turn intraday bias neutral and bring consolidation first, before staging another rise.
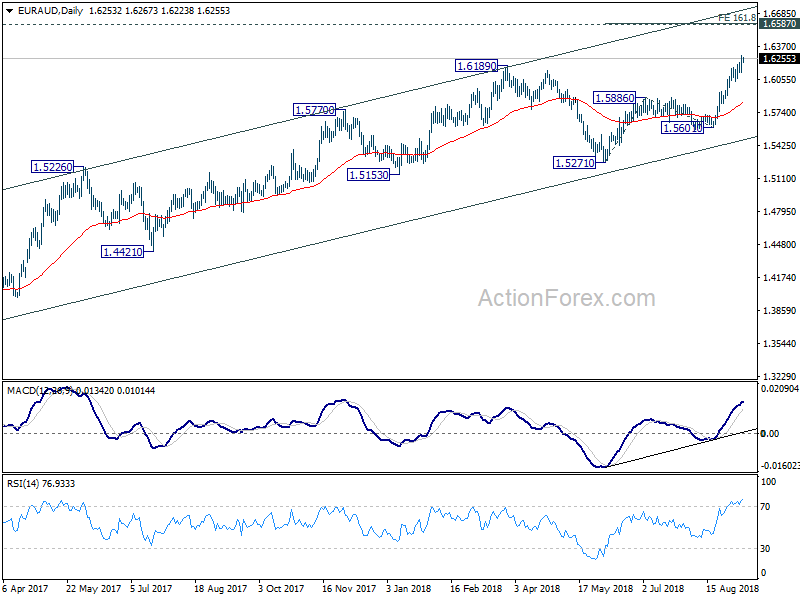
In the bigger picture, up trend from 1.3624 (2017 low) has just resumed. Further rise should be seen to retest 1.6587 (2015 high). Decisive break there will resume the long term rally and target 1.7488 fibonacci level. On the downside, break of 1.5601 support is need to be the first sign of medium term reversal. Otherwise, outlook will remain bullish in case of deep pull back.
EUR/CHF Daily Outlook
Daily Pivots: (S1) 1.1174; (P) 1.1209; (R1) 1.1236; More...
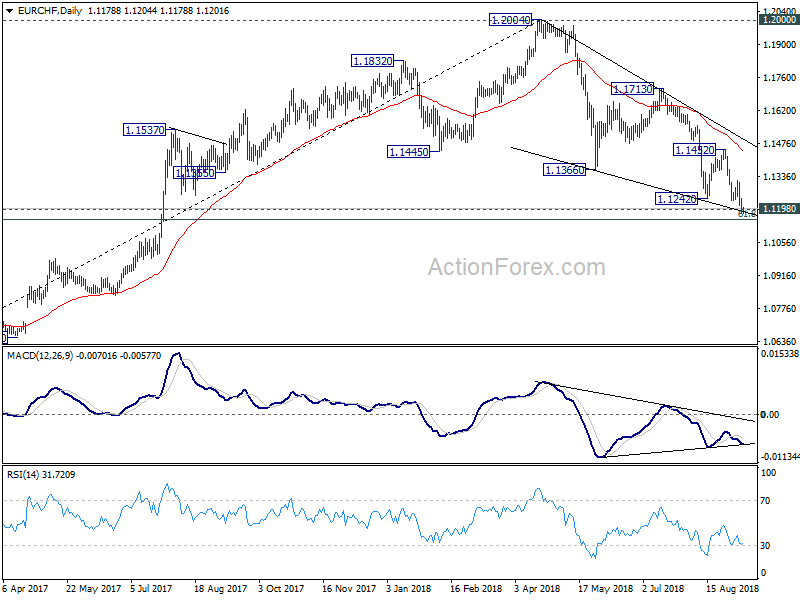
No change in EUR/CHF's outlook. We'd continue to expect strong support from key support zone of 1.1154/98 to bring rebound. On the upside, break of 1.1319 resistance will indicate short term bottoming. In such case, intraday bias will be turned back to the upside for 1.1452 resistance next. However, sustained break of 1.1154/98 will carry larger bearish implications.
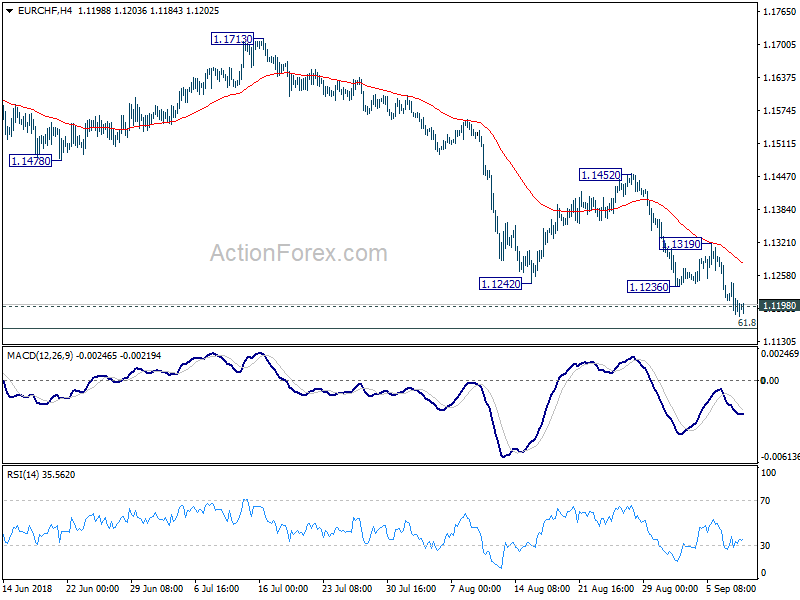
In the bigger picture, for now, the price actions from 1.2004 medium term top is seen as a correction only. Downside should be contained by support zone of 1.1198 (2016 high) and 61.8% retracement of 1.0629 to 1.2004 at 1.1154 to complete it and bring rebound. This cluster level is in proximity to long term channel support (now at 1.1196) too. A break of 1.2 key resistance is still expected in the medium term long term. However, sustained break of the mentioned support zone will mark reversal of the long term trend. In that case, 1.0629 key support will be back into focus.