Sample Category Title
XAUUSD Intraday Analysis
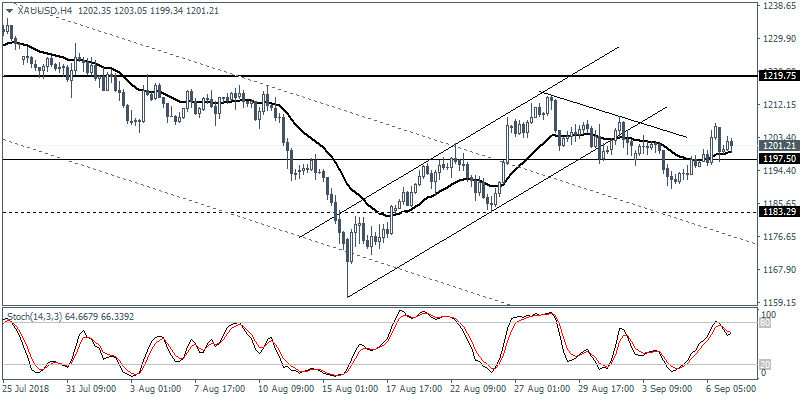
XAUUSD (1201.21): Gold prices managed to post some gains on Thursday as price action rallied past the 1197.50 handle. With this level likely to turn to support, we expect further gains to push the price of the precious metal to 1219.75. In the near term, gold prices could remain flat within these two levels. A breakout above 1219.75 will likely push prices higher to the next main target of 1242.25. To the downside, we expect the support at 1183.29 to be tested.
GBPUSD Intraday Analysis
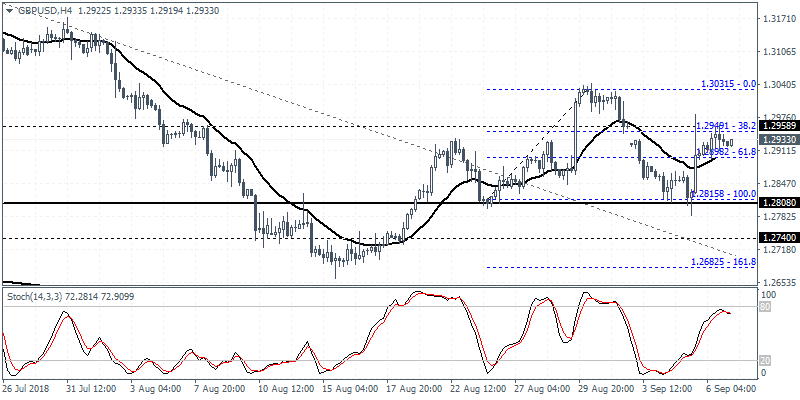
GBPUSD (1.2933): The British pound posted modest gains to test the 1.2950 region. The brief rally back to the unfilled gap from last week is likely to signal a decline back to the support at 1.2808. This will form a potential head and shoulders pattern. If the neckline support at 1.2808 breaks, the declines could be seen pushing the price to 1.2682 level. To the upside, if GBPUSD breaks out higher, we anticipate a test o 1.3031 marking the highs of August 30.
EURUSD Intraday Analysis
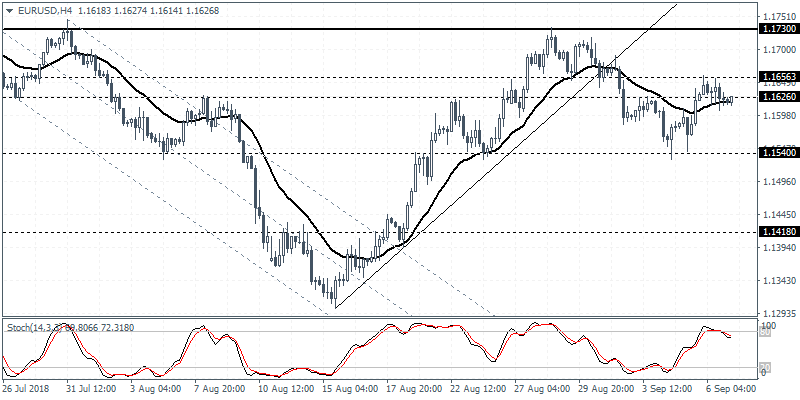
EURUSD (1.1626): The euro currency closed with a doji on Thursday. Price action has become somewhat flat above the 1.1540 level of support. To the upside, the consolidation is seen just near the resistance area of 1.1656 - 1.1626 region. A breakout above this level is required in order for price action to test the next main resistance at 1.1730. To the downside, we expect the EURUSD to potentially retest the lower support at 1.1540.
Investors Turn To Payrolls Report For August
The U.S. dollar was seen easing back on Thursday. On the economic front, the ADP private payrolls showed that private sector hiring added 163k jobs during August. This was below forecasts of 195k that was estimated.
The ISM's non-manufacturing PMI advanced to 58.5 beating estimates of 56.8. This was also an increase from July's print of 55.6.
The economic calendar today will see the German industrial production numbers coming out. Forecasts point to a 0.3% increase on the month following last month's decline of 0.9%.
The UK's consumer inflation expectations report will also be coming out. The previous survey showed inflation expectations at 2.9%. The revised second-quarter GDP figures will be on the tap as well. No changes are expected to the Eurozone's quarterly GDP growth rate of 0.4%.
A busy NY session will see the release of Canada and the U.S.unemployment figures. Canada is expected to add 5.1k jobs in August with the unemployment rate forecast to rise to 5.9%.
Meanwhile, the U.S. is forecast to add 193k jobs with the unemployment rate forecast to tick lower to 3.8%. The monthly average earnings are expected to rise at a slower pace of 0.2%.
EURUSD Unraveling A Bullish Reversal
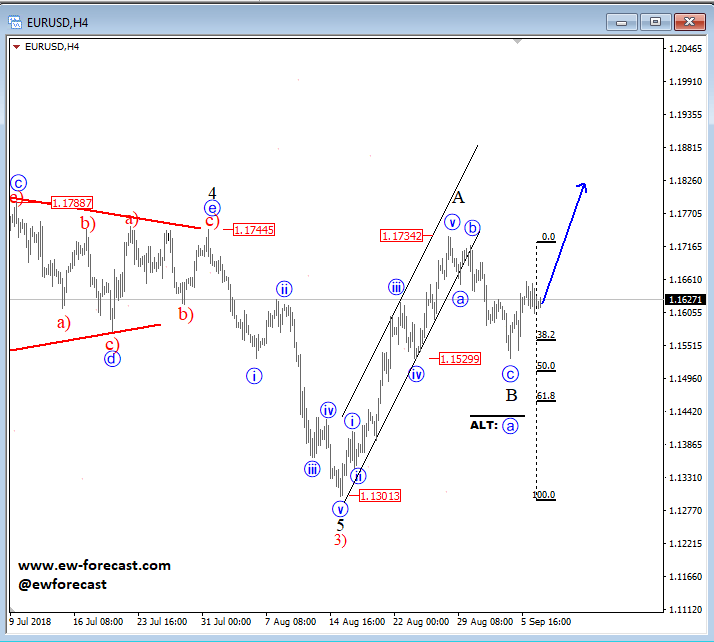
Euro has recovered against the USD with nice and sharp move up from 1.1300 that has an impulsive personality so it seems that more gains will follow as pair formed a bottom. But nothing moves in a straight line so a pullback that we are seeing right now is likely going to a be a corrective wave B which can slow down around 1.1500. Also current leg down can be sub-wave a of a deeper correction which can look for support near the 1.1440 region for the alternate scenario.
A break above the 1.1800 region will confirm more gains.
EURUSD, 4h
USDCAD Eases In Short Term But Outlook Remains Strongly Bullish
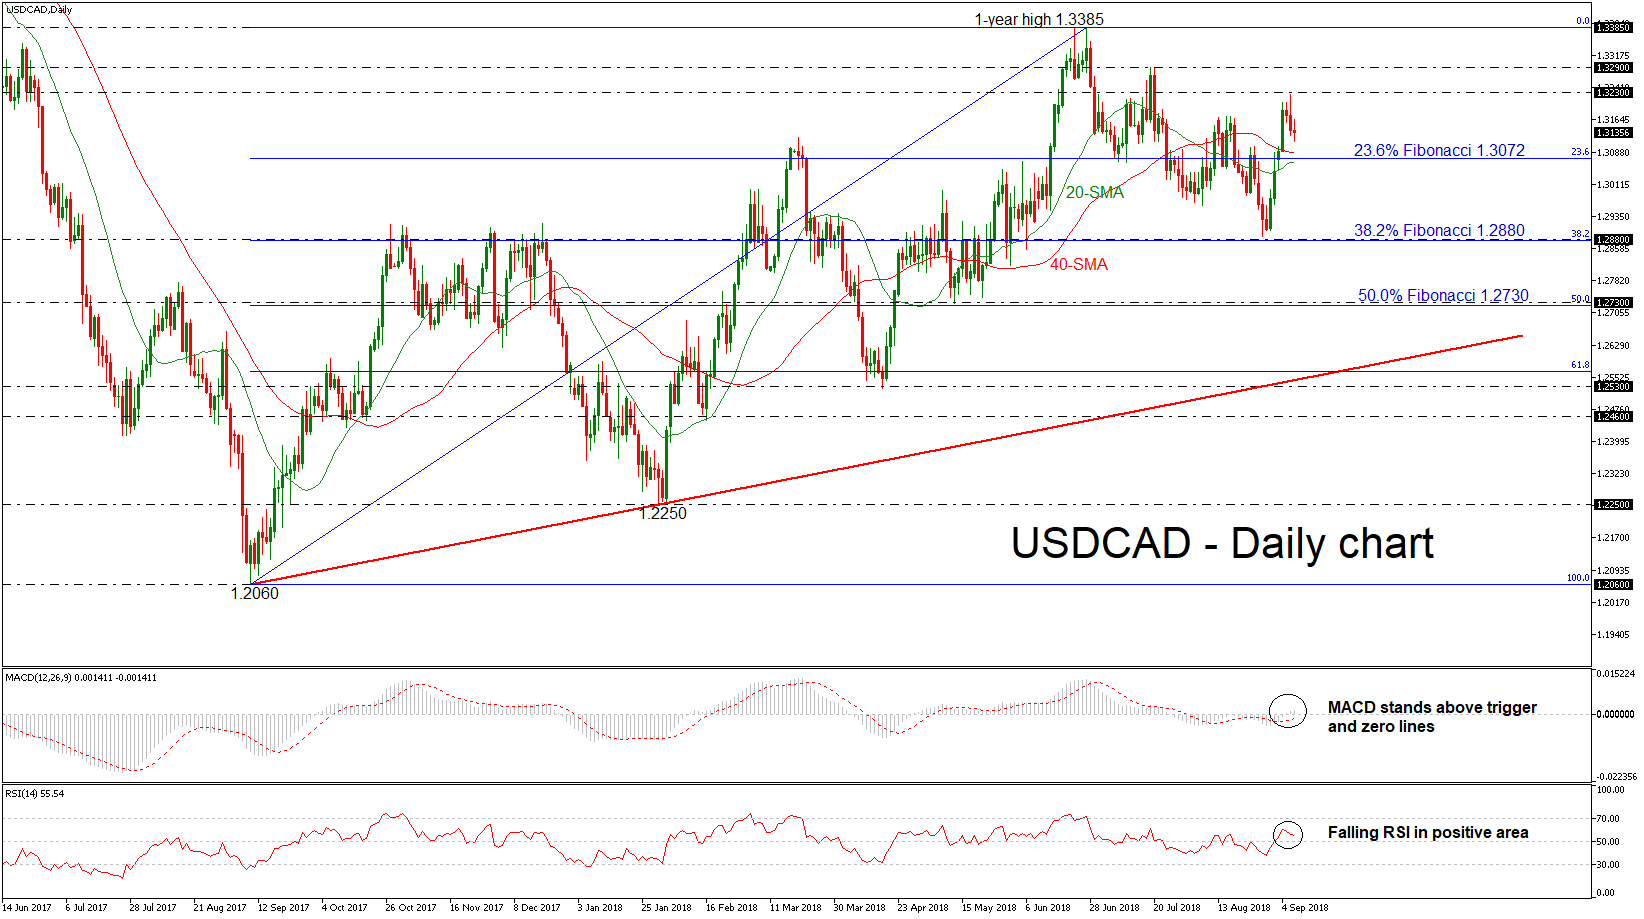
USDCAD has lost its positive momentum over the last couple of days after the bounce on the 1.3230 resistance level. In the short-term, the market could retain its neutral to bearish mode, confirmed by the 20- and 40-simple moving averages which are heading sideways. The RSI indicator is pointing south in the positive territory, while the MACD oscillator holds above its zero and trigger lines but with weak momentum.
An extension to the downside and below the 23.6% Fibonacci retracement level of the upleg from 1.2060 to 1.3385, around 1.3072 could open the door for the 38.2% Fibonacci mark which overlaps with the 1.2880 support. Even lower, the 50.0% Fibonacci near 1.2730 could attract a greater attention as any leg lower could endorse the short-term bearish bias.
On the other side, if the pair manages to jump higher, the immediate resistance level of 1.3230 could be the first stop for the bulls. Above this level the pair could hit the 1.3290 barrier, taken from the high on July 20 before being able to challenge again the one-year high of 1.3385.
In the bigger picture, USDCAD has been developing within an ascending movement over the last year following the rebound on the 1.2060 support hurdle.
EURUSD Attempting To Break Key Resistance
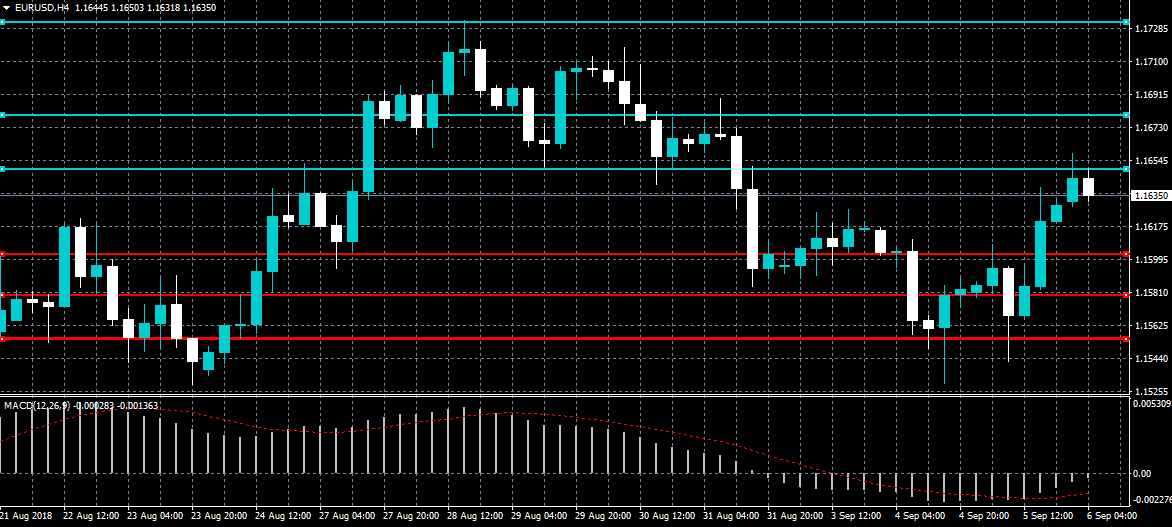
The euro currency continues to press higher against the greenback after the U.S. Dollar Index failed to hold above the key 95.50 support level for the second consecutive day. The short-term trend on the EUR/USD pair will turn bullish if buyers can hold price above the 1.1650 resistance level. The MACD indicator across the one-hour time frame continues to trend higher.
The EURUSD pair is only bullish while trading above the 1.1650 level, key technical resistance is now found at the 1.1681 and 1.1730 levels.
If the EURUSD sellers move price below the 1.1600 level once again, sellers will likely test the 1.1580 and 1.1553 levels.
USDJPY Under Pressure Below 110.90 Level
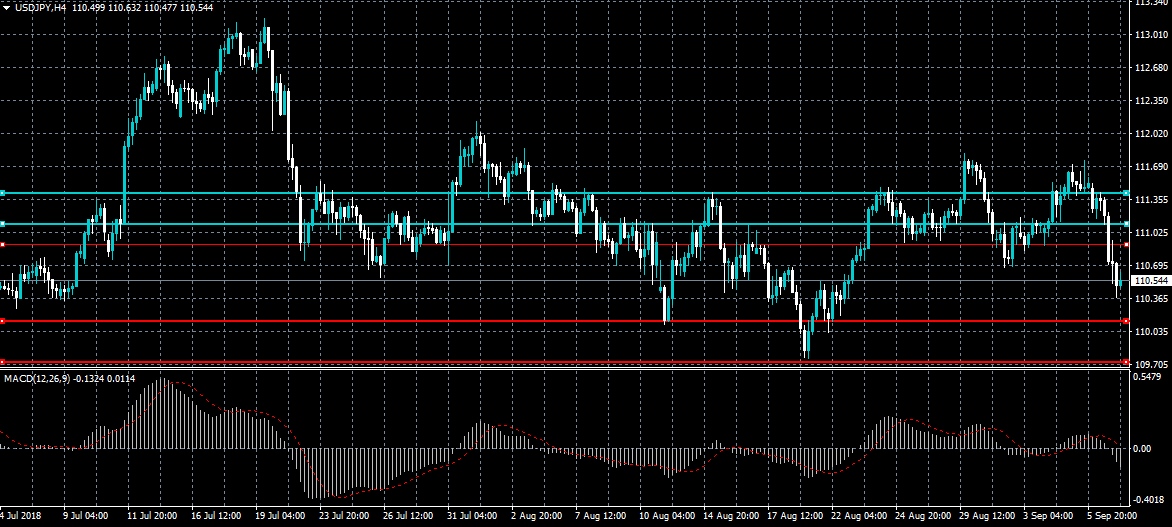
The US dollar has fallen below the 110.90 level against the Japanese yen currency, as falling equity prices are forcing investors into safe haven asset classes. The intraday sentiment towards the USDJPY pair is bearish while trading below the 110.90 level, caution is still warranted as the USDJPY pair has recently been unable to find a trending directional.
The USDJPY pair is bearish while trading below the 110.90 level, key support is now found at the 110.10 and 109.65 levels.
If the USDJPY pair moves above the 110.90 level, a correction towards the 111.10 and 111.39 levels cannot be ruled out.
Dollar Unchanged In Asian Session As Traders Wait For NFP
The Japanese yen is rising against the US dollar after a government report found increased household spending. In July, the household spending in Japan rose by an annualized rate of 0.1%. This was higher than the expected decline of minus 0.8%. It was also the first time the household spending data has been above 0 since March this year.
Spending rose despite average cash earnings climbing by just 1.5%, which was lower than the expected 2.4%. This data measures the change in employment income, including bonuses and overtime pay. On a month-on-month basis, household spending fell by minus 1.1%. This was better than the expected minus 1.2%.
The US dollar is little moved against its top global peers as traders wait for official employment data from the government. Traders expect the non-farm payrolls for August to be 191K. This will be higher than the disappointing 157K released a month ago. The participation rate is expected to increase to 63% while the unemployment rate is expected to drop to 3.8%. Manufacturing payrolls are expected to increase by 24K, which will be lower than last month's 37K. Average weekly hours are expected to remain at 34.5. The data will come a day after ADP reported Nonfarm Employment change of 163K.
The Canadian dollar fell below an important support after the ADP jobs numbers. During the Asian session, the USD/CAD pair traded below this support level. Today, Statistics Canada will release the employment change numbers. Traders expect that the unemployment rate will increase to 5.9% from last month's 5.8%. Two hours after the data is released, Ivey will release the PMI data that is expected to drop to 61.4 from last month's 61.8. These data will be watched closely because they will determine whether the Bank of Canada will increase interest rates as expected in October.
EUR/USD
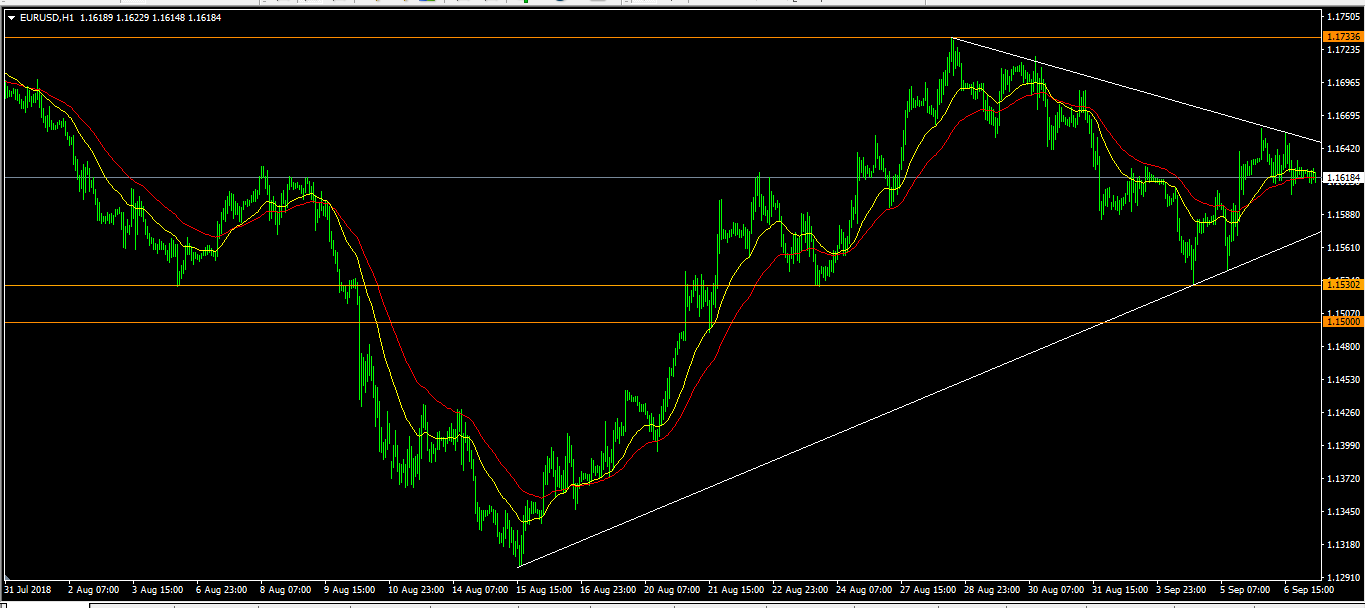
Over the past few days, the EUR/USD pair has formed a symmetrical triangular pattern as shown on the hourly chart below. It is now trading at 1.1617 as traders wait for the jobs numbers. This level is higher than the 61.8% Fibonacci Retracement and in line with the short-term – 25 EMA – and the longer-term 50 EMA. Positive employment numbers today will make the case for a continued pace of rate hikes and will see the pair fall to the support of 1.1500. Disappointing numbers will take the pair above 1.1700.
USD/CAD
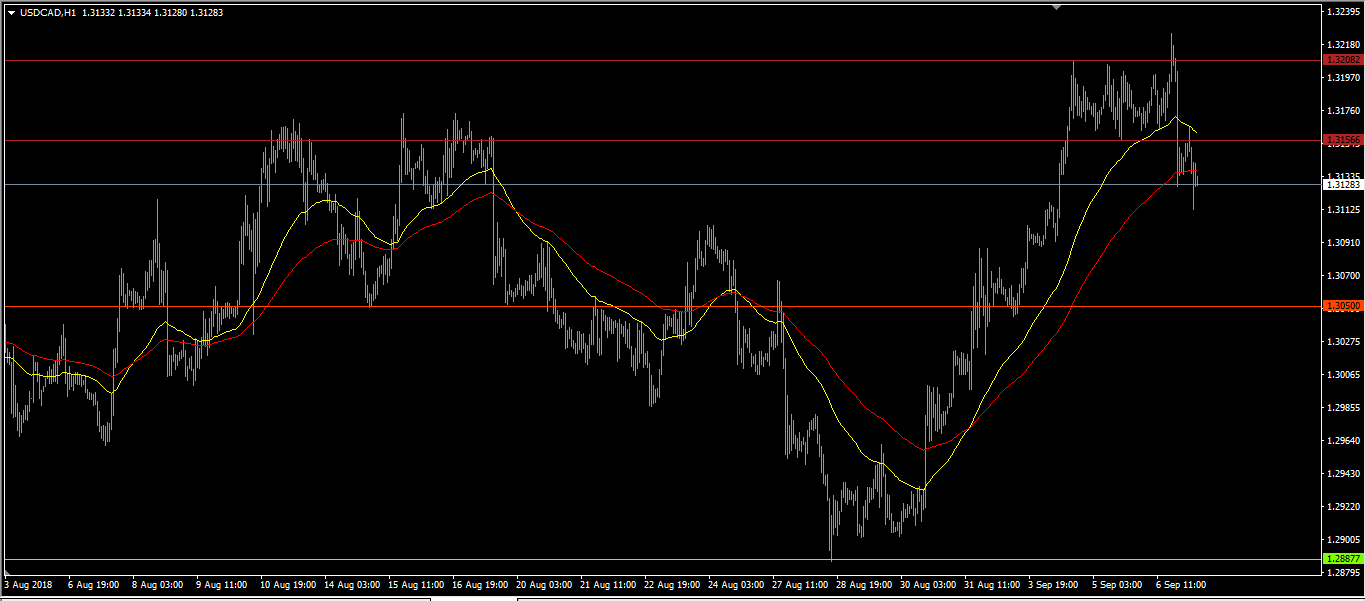
The USD/CAD fell below the support level of 1.3156 yesterday. During the Asian session, the pair remained below this level as traders waited for the US and Canada employment numbers. It is now trading at 1.3130. Positive US employment numbers will likely take the pair back to above the 1.3200 level while positive Canadian employment numbers will take the pair to below the 1.3050 level.
GBP/USD
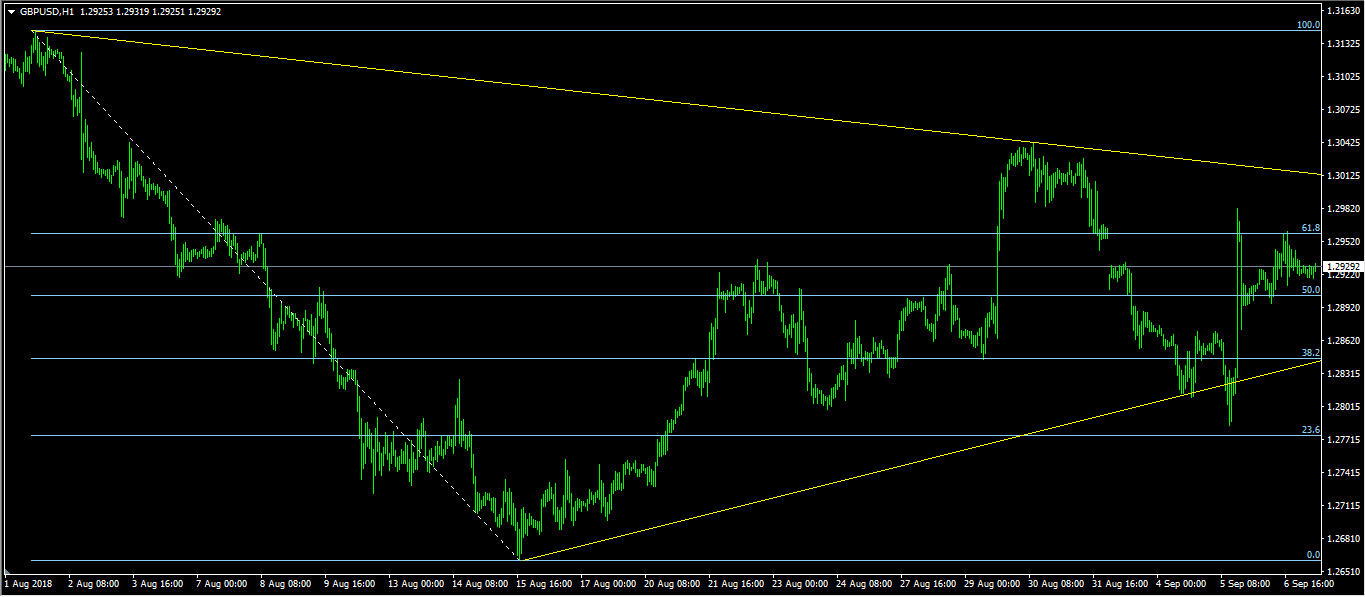
The GBP/USD pair jumped sharply on Wednesday after the UK and Germany made a deal. It reached a high of 1.2983. Since then, the pair has consolidated slightly below this level and is currently trading at 1.2928. This price is between the 61.8% and 50% Fibonacci Retracement level. With no major data expected from the UK today, the pair will continue trading in range as traders wait for US jobs numbers. Positive jobs numbers will take the pair to the 1.2850 level while disappointing numbers will take it above the 1.3050 level.
Elliott Wave Analysis: ES_F Correction Taking Place
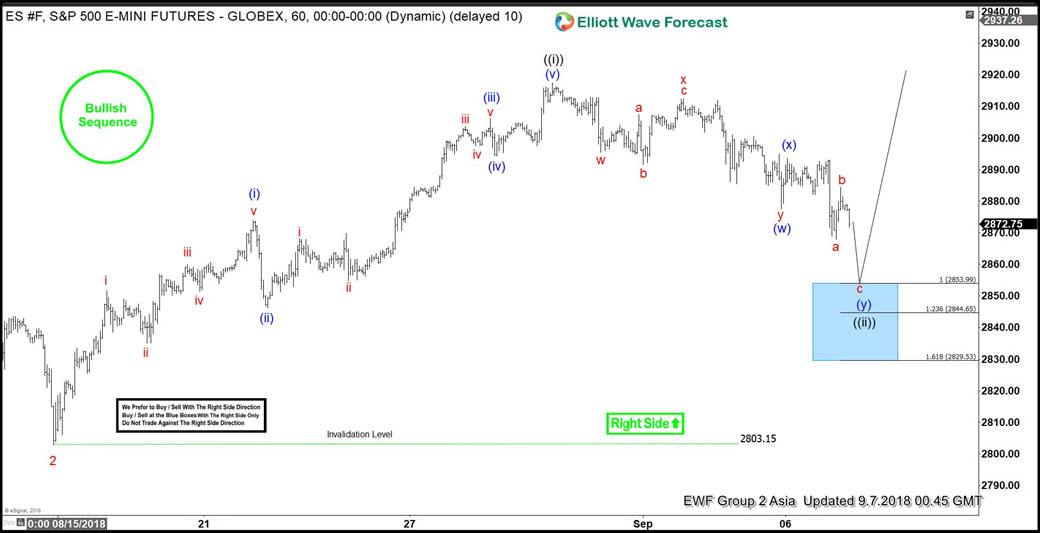
ES_F Short-term Elliott wave analysis suggests that the pullback to $2803.15 ended Minor wave 2 pullback. Up from there, the index has rallied higher into new highs confirming that Minor wave 3 has started. The internals of that rally higher is unfolding as impulse structure with the sub-division of 5 waves structure in the lesser degree, i.e. Minutte wave (i), (iii) & (v).
Above from $2803.15, the initial rally in 5 waves to $2874 high ended Minutte degree wave (i). Down from there, the pullback to $2846.25 low ended Minutte wave (ii). A rally higher to $2903.25 high unfolded in another 5 wave structure & completed Minutte wave (iii). A pullback to $2894.25 low ended Minutte wave (iv). Then finally a rally higher to $2917.50 ended Minutte wave (v) & also completed the Minute wave ((i)). Below from there, the index is doing a Minute wave ((ii)) pullback as a double three structure looking to extend 1 more time towards blue box area at $2853.99-$2829.53, which is 100%-161.8% Fibonacci extension area of Minutte wave (w)-(x). Afterwards, the index is expected to resume the upside or to do a 3 wave bounce at least. We don’t like selling it and expect buyers to appear in 3, 7 or 11 swings against $2803.15.
ES_F 1 Hour Elliott Wave Chart