Sample Category Title
EUR/USD Bull Flag Bounces At 1.15 And 50% Fib
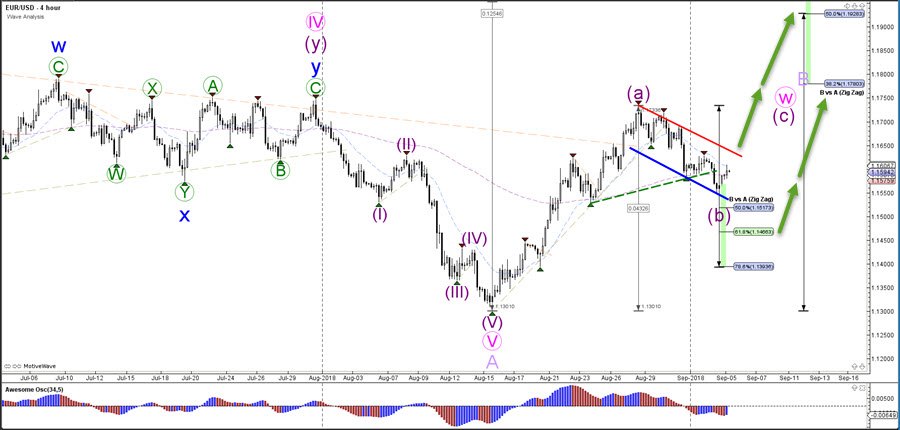
The EUR/USD seems to be building a larger bull flag chart pattern. A bullish breakout could see price move towards the Fibonacci targets of wave C.
The EUR/USD could be completing a larger ABC (purple) pattern, which becomes less likely to occur if price breaks below the 61.8% Fib of wave B vs A and is invalidated if price breaks below the bottom near 1.13. A bullish break above the resistance (red) line of the flag pattern could indicate a bullish continuation within wave C (purple).
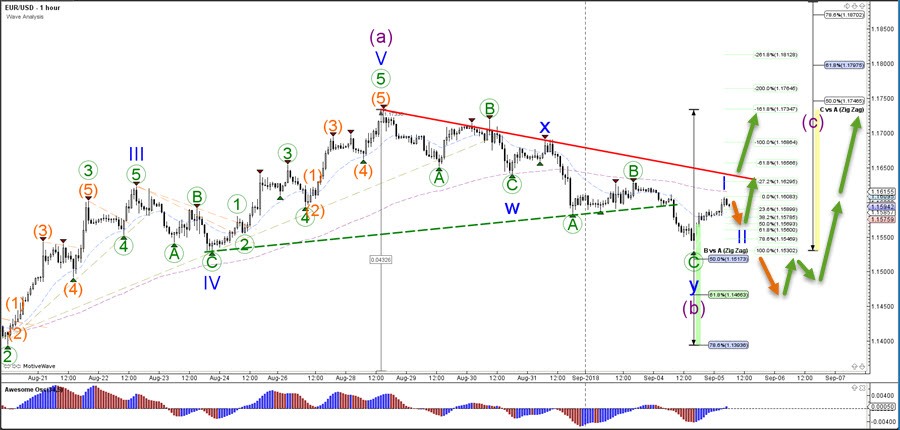
The EUR/USD could be building a wave 1-2 (blue) pattern within wave C (purple) if price stays above the 100% Fibonacci level. In that case, an ABC correction (green) has completed the wave B (purple). A break lower could indicate a fall towards the 61.8% Fibonacci retracement level, which is a new potential support level.
Elliott Wave Analysis: FTSE Started 7th Swing Lower
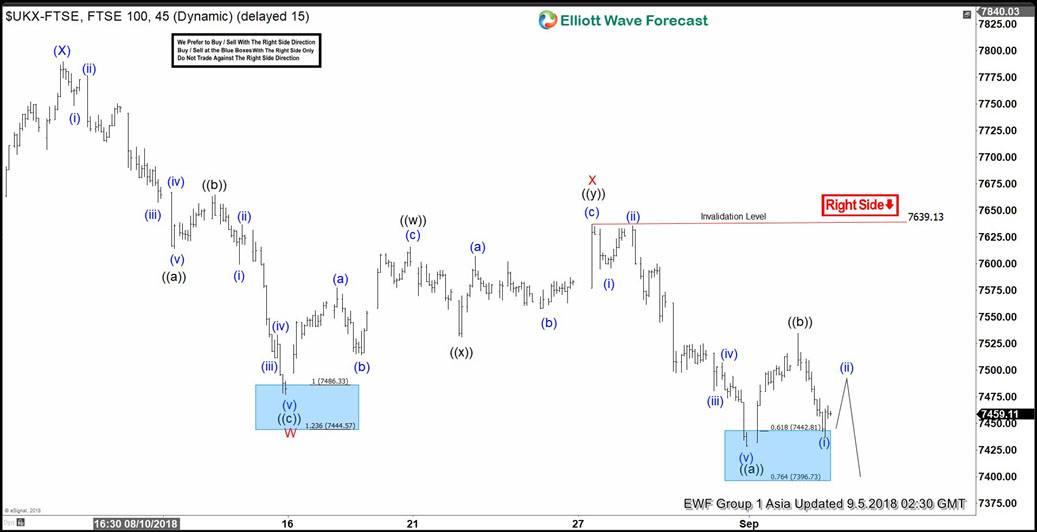
FTSE short-term Elliott Wave view suggests that the rally to 7790.17 high ended intermediate wave (X) bounce. Down from there, intermediate wave (Y) remains in progress with instrument showing a lower low sequence. The internals of that leg lower is taking place as double correction lower due to overlapping price action happening from 7790.17 high thus suggesting that the decline is unfolding in 3 waves corrective sequence.
Down from 7790.17 high, the initial move to 7477.05 low ended Minor wave W of (Y). The internals of that lesser degree decline unfolded as Zigzag structure where Minute wave ((a)) ended in 5 waves at 7614.48 low. Then the bounce to 7665.24 high ended Minute wave ((b)) bounce. And decline to 7477.05 low ended Minute wave ((c)) of W in another 5 waves structure. Up from there, the bounce higher to 7639.13 high ended Minor wave X of (Y). The internals of that bounce unfolded as double three structure where Minute wave ((w)) ended at 7616.15 high. Minute wave ((x)) ended at 7531.24 low and Minute wave ((y)) of X ended at 7639.13 high. Down from there, the index has made a new low confirming that Minor wave Y of (Y) has started and looking for extension lower towards 7323.99-7250.04, which is 100%-123.6% Fibonacci extension area of W-X. Near-term, while bounces stay below 7639.13 high expect index to extend lower. We don’t like selling it.
FTSE 1 Hour Elliott Wave Chart
Aussie GDP Beats Ests, China Services PMI At 10-Month Low
General Trend:
- Asian equities track declines in the US
- Materials companies trade generally lower
- Tencent declines over 2%
- Chinese telecoms decline despite M&A speculation
- Indonesia equity market drops over 3%
- Fast Retailing rises after Aug sales figures
- Aussie rises on better than expected Q2 GDP data
- China services PMI hits 10-month low
- Hong Kong business confidence hits 20-month low amid US/China trade concerns (Aug PMI data)
- Reminder: The public comment period related to the US’ proposed tariffs on $200B in China goods is due to end on Sept 6th (Thursday).
- Malaysia Central Bank to hold policy meeting later today, no changes expected
Headlines/Economic Data
Australia/New Zealand
- ASX 200 opened -0.1%
- ASX 200 Resources index -1.5%, Utilities -1.4%, Telecom -1%, Financials -0.9%; REIT +0.3%
- (AU) AUSTRALIA Q2 GDP Q/Q: 0.9% V 0.7%E; Y/Y: 3.4% V 2.9%E (fastest growth rate since 2014)
- (AU) Australia Weather Bureau: Rainfall deficiencies have worsened in parts of Eastern Australia
- (AU) Australia Aug CBA PMI Services: 51.8 v 52.3 prior
- (NZ) NEW ZEALAND Q2 VOLUME OF ALL BUILDINGS Q/Q: 0.8% V 2.9%E
- (NZ) Reserve Bank of New Zealand (RBNZ) Gov Orr to speak on Sept 7th about geopolitics
- (NZ) New Zealand Aug ANZ Commodity Price: -1.1% v -3.2% prior
- (NZ) New Zealand to auction NZ$100M in Sept 2040 indexed bonds on Sept 6th
China/Hong Kong
- Shanghai Composite opened -0.3%, Hang Seng -0.7%
- Hang Seng Property/Construction index -2.3%, Info Tech -2.1%, Materials -2%, Energy -1.9%, Services -1.9%, Industrial Goods -1.7%, Consumer Goods -1.5%, Telecom -1.3%, Financials -1.2%
- (CN) CHINA AUG CAIXIN PMI SERVICES: 51.5 V 52.6E (10-month low)
- (CN) China PBoC set yuan reference rate: 6.8266 v 6.8183 prior
- (CN) China PBoC Open Market Operation (OMO):Skips OMO (11th straight skip)
- (CN) China PBoC said to have drained CNY300B by using repos in Aug - US financial press
- (CN) China said to begin crackdown related to foreign tax invasion - Global Times
- (HK) Hong Kong Aug PMI: 48.5 v 48.2 prior
Japan
- Nikkei 225 opened -0.2%
- TOPIX Real Estate index -1.9%, Marine Transportation -1.7%, Information & Communication -1.7%, Iron & Steel -0.7%, Retail Trade -0.6%, Electric Appliances -0.6%
- (JP) Japan MoF sells ¥2.2T v ¥2.2T indicated in 0.10% 10-year JGBs, avg yield 0.1130% v 0.126% prior, bid to cover 4.55x v 4.17x prior
- (JP) JAPAN AUG PMI SERVICES: 51.5 V 51.3 PRIOR (4-month high)
- (JP) BoJ would need to see the 10-year JGB yield test 0.20% before any change; the central bank is said to believe its policy tweaks are working and it is satisfied with the yield range - US financial press
Korea
- Kospi opened -0.2%
- (KR) South Korea President Moon's Envoys have departed for North Korea - South Korean Press
- (KR) South Korea Aug Foreign Reserves: $401.1B v $402.5B prior (first decline in 6 months)
Other
- (MY) Malaysia July Trade Balance (MYR): 8.3B v 6.7Be
- (PH) Philippines Central Bank (BSP) Chief Espenilla comments after higher than expected Aug inflation data: CPI warrants more decisive non-monetary measures; will weigh the need for further monetary policy action
- (PH) PHILIPPINES AUG CPI Y/Y: 6.4% V 5.9%E (new multi-year high)
- (SG) Singapore Aug PMI: 51.1 v 53.0 prior
- (SG) Singapore Monetary Authority Quarterly Survey: 2018 GDP growth seen at 3.2% v 3.2% in June; USD/SGD forecast raised to S$1.37 by year end v S$1.32 prior
North America
- US equities ended lower: Dow -0.1%, S&P500 -0.2%, Nasdaq -0.2%, Russell 2000 -0.4%
- S&P500 Communication Services -1.2%
- (US) Special Counsel Mueller said to plan to accept written answers from US President Trump – NYT
- (US) Fed Study: There is little evidence that major US companies are using the benefits from tax cuts for Capex – financial press
- (US) SIA: July global sales of semiconductors $39.5B, +17.4% y/y and +0.4% m/m
Europe
- Reportedly EU Brexit negotiator Barnier told UK that the Chequers plan is unacceptable – press
- (UK) Germany Chancellor Merkel: aim is to come to agreement with UK on Brexit; Britain can't enjoy same rights as EU members post-exit
- (UK) BOE Gov Mark Carney reportedly expecting to remain in post until 2020 - FT
- (DE) German Finance Ministry reportedly set to drop plan to tax internet companies - press
- (SA) Saudi Arabia said to be seeking to keep oil prices in the $70-80/bbl range - financial press
Levels as of 01:30ET
- Nikkei 225, -0.2%, ASX 200 -0.9%, Hang Seng -1.7%; Shanghai Composite -0.7%; Kospi -0.3%
- Equity Futures: S&P500 -0.1%; Nasdaq100 -0.1%, Dax -0.2%; FTSE100 -0.2%
- EUR 1.1609-1.1576 ; JPY 111.73-111.33 ; AUD 0.7220-0.7171 ;NZD 0.6563-0.6530
- Aug Gold flat at $1,199/oz; Sept Crude Oil -0.7% at $69.40/brl; Sept Copper flat at $2.599 /lb
Emerging Markets Contagion
Market movers today
The US-China trade war is back on the agenda, as the public hearing on possible tariffs on an additional USD200bn worth of imports from China ends today. An announcement may come within a week. We think President Trump will impose the tariffs, which would force China to retaliate.
The UK Services PMI is out today; we expect it to be unchanged, indicating weak growth, which would mean UK growth remains on the weak side.
Look out for Polish and the Canadian policy rate decisions today.
Norwegian house prices are out today; we expect prices to have risen moderately.
Selected market news
The emerging markets crisis broadened as South Africa's economy tumbled into a recession and Indonesia's rup iah joined the ranks of EM currencies hurtling towards fresh lows. The sell-off encapsulates almost all EM assets, including currencies, bonds and equities. Emerging market equities have fallen throughout the year and currencies have been battered since April. Dismal performance has been in stark contrast to a stellar 2017. We highlighted the escalating emerging markets crisis in our recent strategy piece New ‘fragile five' in emerging markets.'
This EM crisis shares common characteristics with past EM crises in that these economies are dependent on external financing due to weak macroeconomic fundamentals amplified by large current account deficits. In times of rising US rates and USD, these economies become vulnerable to outflows.
This particular EM crisis bears an additional imprint, which seems the hallmark of recent investing times, namely geopolitics. Among the new ‘fragile five', Russia and Turkey have seen their crises aggravated by geopolitical confrontation with the US. Rising US rates, weak EM macro fundamentals and jittery geopolitics make for a poisonous concoction for EM assets.
The nexus of geopolitical shocks, US President Donald Trump ramped up pressure on Canada to join the revamped NAFTA deal agreed to by the US and Mexico. Meanwhile, the public hearing on tariffs on USD200bn worth of Chinese imports is set to end today. We expect Trump to announce the imposition of said tariffs and China to retaliate. We do not expect any deal between the US and China before the US Midterm Elections on 6 November. With regards to the midterms, we expect the Democrats to take the House, but the Republicans to retain the Senate. For more, see our report US Midterm Elections.
In the UK, Bank of England Governor Carney confirmed he was in discussions to extend his term to 2020 to smoothen any potential Brexit-related disruption.
Confounding expectations, the ISM Manufacturing Index rose significantly, by 3.2 points to 61.3, which is its highest level since May 2004.
Euro-Zone’s Producer Price Inflation Accelerated In July
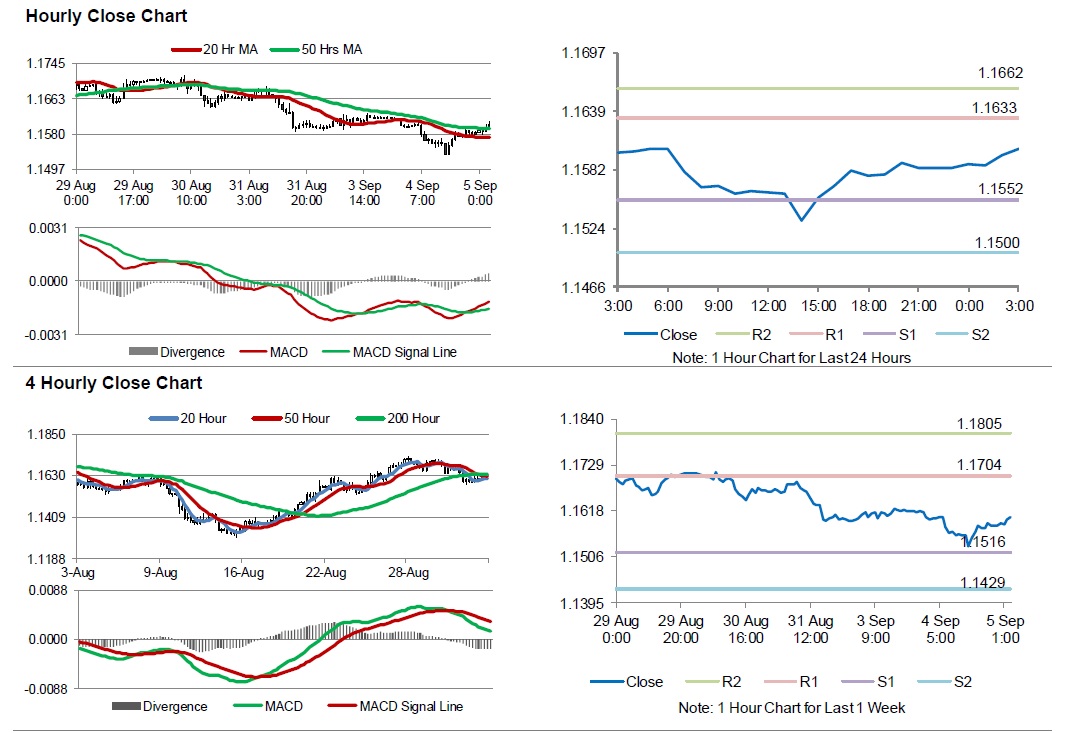
For the 24 hours to 23:00 GMT, the EUR declined 0.29% against the USD and closed at 1.1583.
On the macro front, the Euro-zone's producer price index (PPI) advanced to 4.0% on an annual basis in July, boosted by higher energy prices and beating market expectations for a rise of 3.9%. In the previous month, the PPI had risen 3.6%.
In the US, data showed that the final Markit manufacturing purchasing managers' index (PMI) dropped to 54.7 in August, marking its weakest reading since November 2017 and less than market expectations for a fall to a level of 54.5. The Markit manufacturing PMI had recorded a reading of 55.3 in the previous month. The preliminary figures had indicated a fall to a level of 54.5. Meanwhile, the nation's construction spending rose 0.1% on a monthly basis in July, less than market expectations for a rise of 0.5%. In the prior month, construction spending had dropped by a revised 0.8%. On the contrary, the ISM manufacturing activity index unexpectedly advanced to 61.3 in August, helped by a rise in new orders and compared to a level of 58.1 in the prior month. Market participants were expecting the ISM manufacturing activity index to fall to a level of 57.6.
In the Asian session, at GMT0300, the pair is trading at 1.1603, with the EUR trading 0.17% higher against the USD from yesterday's close.
The pair is expected to find support at 1.1552, and a fall through could take it to the next support level of 1.1500. The pair is expected to find its first resistance at 1.1633, and a rise through could take it to the next resistance level of 1.1662.
Going ahead, investors would keep an eye on the Euro-zone's retail sales data for July, along with the final services PMI for August, set to release across the euro bloc in a few hours. Moreover, the US MBA mortgage applications followed by trade balance data for July, set to release later in the day, will be on investors' radar.
The currency pair is trading above its 20 Hr moving average and showing convergence with its 50 Hr moving average.
UK Construction Sector Growth Declined To A 3-Month Low In August
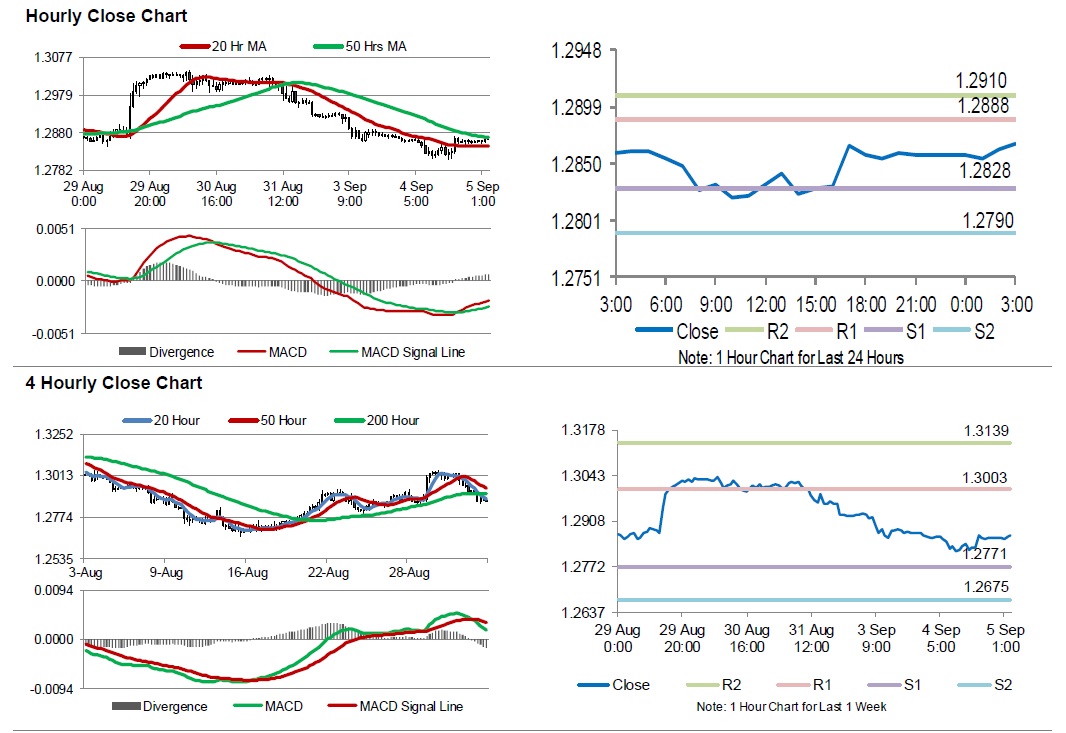
For the 24 hours to 23:00 GMT, the GBP declined 0.12% against the USD and closed at 1.2857, after Britain's construction PMI fell more than expected in August.
Data revealed that UK's construction PMI declined to 52.9 in August, notching its lowest level in three months and more than market forecast for a fall to a level of 54.9. In the previous month, the PMI had recorded a reading of 55.8.
In the Asian session, at GMT0300, the pair is trading at 1.2867, with the GBP trading 0.08% higher against the USD from yesterday's close, after the Bank of England (BoE) Governor, Mark Carney indicated that he would stay on the central bank board beyond his planned June 2019 departure to ensure a smooth Brexit. Additionally, he indicated that he would do “whatever he could” to promote both a smooth Brexit and an effective transition at the central bank.
The pair is expected to find support at 1.2828, and a fall through could take it to the next support level of 1.2790. The pair is expected to find its first resistance at 1.2888, and a rise through could take it to the next resistance level of 1.2910.
Trading trend in the Pound today is expected to be determined by the UK's Markit services PMI for August, slated to release in a few hours.
The currency pair is trading above its 20 Hr moving average and showing convergence with its 50 Hr moving average.
Japan’s Services PMI Notches A 4-Month High In August
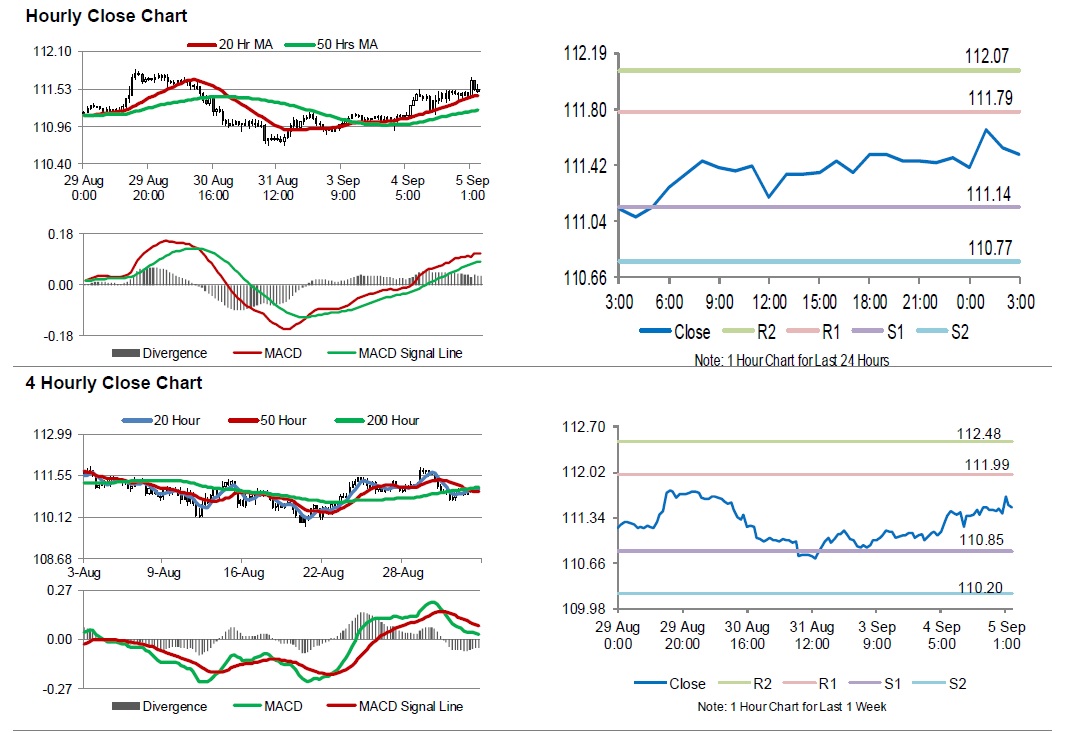
For the 24 hours to 23:00 GMT, the USD rose 0.34% against the JPY and closed at 111.48.
In the Asian session, at GMT0300, the pair is trading at 111.50, with the USD trading slightly higher against the JPY from yesterday's close.
Data revealed that Japan's Nikkei services PMI climbed to 51.5 in August, compared to a level of 51.3 in the prior month. The services sector advanced to the highest level in four months amid higher sales and new store openings.
The pair is expected to find support at 111.14, and a fall through could take it to the next support level of 110.77. The pair is expected to find its first resistance at 111.79, and a rise through could take it to the next resistance level of 112.07.
The currency pair is trading below its 20 Hr and 50 Hr moving averages.
Swiss Franc Reverses Its Losses In The Morning Session
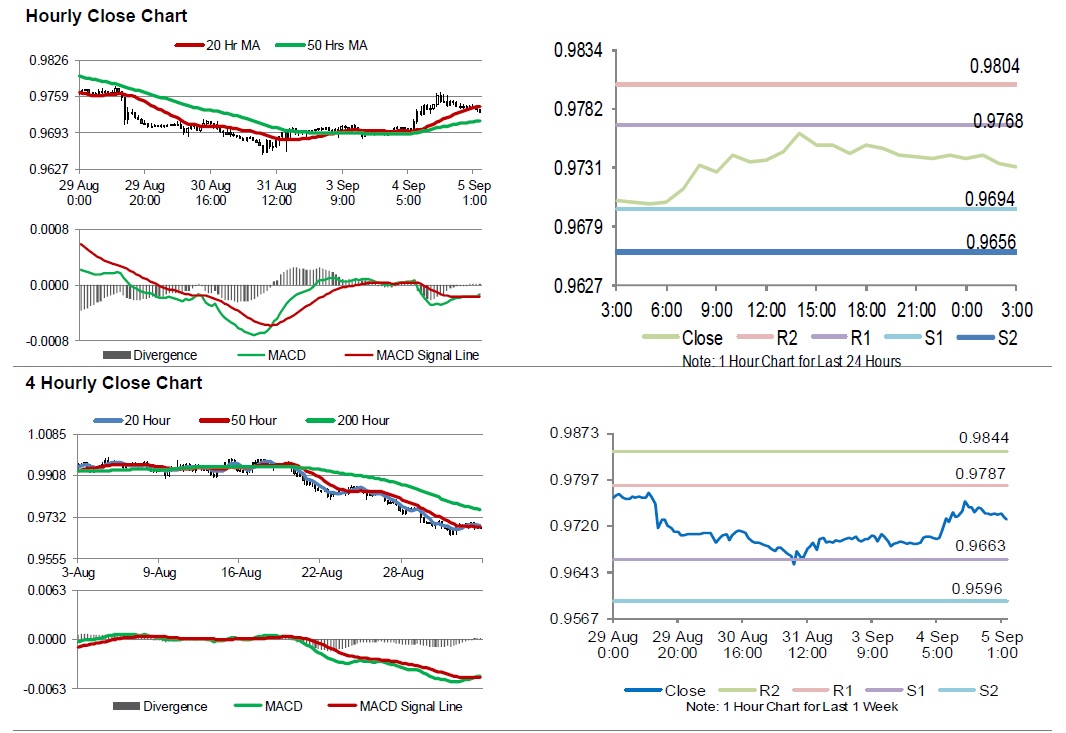
For the 24 hours to 23:00 GMT, the USD rose 0.52% against the CHF and closed at 0.9741.
Data showed that Switzerland’s consumer price index (CPI) rose 1.2% on a yearly basis in August, at par with market expectations and compared to a similar rise in the previous month.
In the Asian session, at GMT0300, the pair is trading at 0.9731, with the USD trading 0.10% lower against the CHF from yesterday’s close.
The pair is expected to find support at 0.9694, and a fall through could take it to the next support level of 0.9656. The pair is expected to find its first resistance at 0.9768, and a rise through could take it to the next resistance level of 0.9804.
Amid no macroeconomic releases in Switzerland today, investor sentiment would be governed by global macroeconomic factors.
The currency pair is trading between its 20 Hr and 50 Hr moving averages.
Canada’s Manufacturing PMI Dipped In August
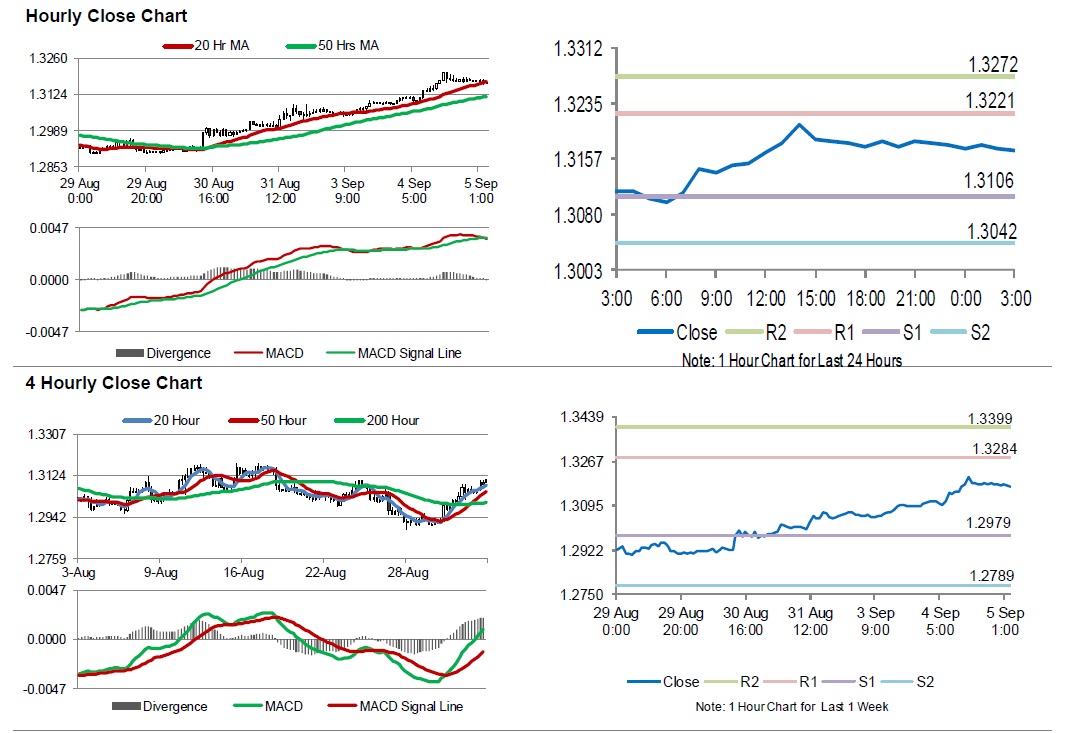
For the 24 hours to 23:00 GMT, the USD rose 0.65% against the CAD and closed at 1.3178.
In economic news, Canada's manufacturing PMI dropped to a 4-month low level of 56.8 in August, following a reading of 56.9 in the previous month.
In the Asian session, at GMT0300, the pair is trading at 1.3170, with the USD trading 0.06% lower against the CAD from yesterday's close.
The pair is expected to find support at 1.3106, and a fall through could take it to the next support level of 1.3042. The pair is expected to find its first resistance at 1.3221, and a rise through could take it to the next resistance level of 1.3272.
Looking ahead, market participants would keep a close watch on the Bank of Canada's (BoC) key rate decision and merchandise trade balance data for July, slated to release later in the day.
The currency pair is showing convergence with its 20 Hr moving average and trading above with its 50 Hr moving average.
Australia’s 2Q GDP Growth Beat Estimates On Robust Domestic Spending
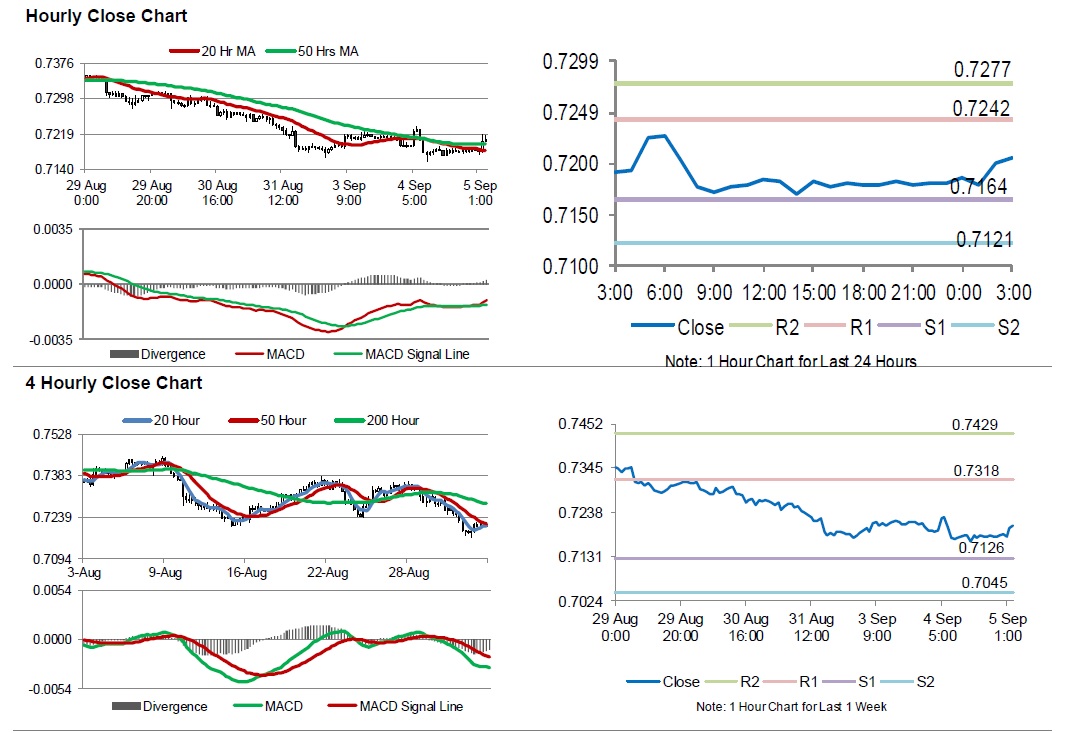
For the 24 hours to 23:00 GMT, the AUD declined 0.42% against the USD and closed at 0.7181.
LME Copper prices declined 2.2% or $128.0/MT to $5823.0/MT. Aluminium prices fell 2.1% or $43.5/MT to $2040.0/MT.
In the Asian session, at GMT0300, the pair is trading at 0.7206, with the AUD trading 0.35% higher against the USD from yesterday's close, after Australia posted its best economic growth in six years.
Overnight data indicated that Australia's seasonally adjusted gross domestic product (GDP) rose 0.9% on a quarterly basis in the second quarter of 2018, more than market expectations for an advance of 0.7%. In the prior quarter, the GDP had advanced by a revised 1.1%.
On the other hand, the nation's AIG performance of services index fell to a level of 52.2 in August, compared to a reading of 53.6 in the prior month.
Elsewhere in China, the Caixin/Markit services PMI index dropped to 51.5 in August, compared to a reading of 52.8 in the prior month. Market expectation was for the index to ease to a level of 52.6.
The pair is expected to find support at 0.7164, and a fall through could take it to the next support level of 0.7121. The pair is expected to find its first resistance at 0.7242, and a rise through could take it to the next resistance level of 0.7277.
Moving ahead investors would focus on Australia's trade balance data for July, scheduled to release overnight.
The currency pair is trading above its 20 Hr moving average and showing convergence with its 50 Hr moving average.