Sample Category Title
EURUSD Intraday Analysis
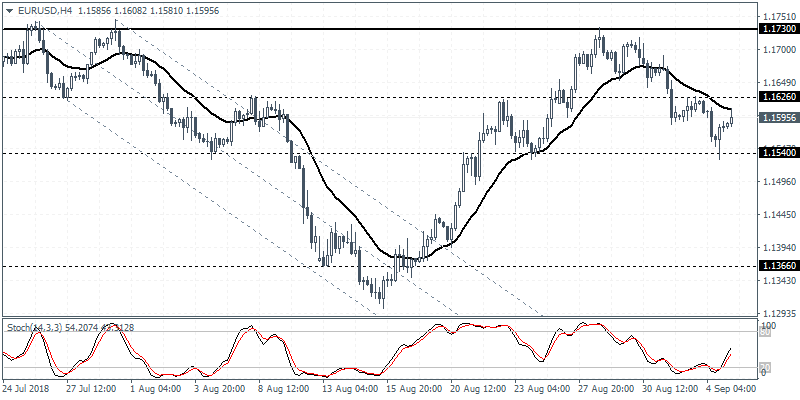
EURUSD (1.1595): The euro currency extended declines briefly touching down to 1.1540 on a stronger greenback. The currency pair promptly reversed the losses but closed bearish on the day. The sharp retest of the support level led to a rebound in price action which is currently capped by the 20-day moving average. A decline back to 1.1540 is expected in the near term. An expected reversal off the 20-period moving average could see price action retesting 1.1540 more firmly. Following this, we expect to see a rebound back to 1.1626 levels or even higher. To the downside, a break down below 1.1540 could trigger further declines down to 1.1366
BoC To Keep Interest Rates Unchanged
The U.S. dollar posted strong gains on Tuesday since the start of the European trading session. The USD jumped on the strong manufacturing PMI report. Data from the Eurozone was quiet.
The British pound continued to weaken as construction activity as measured by the PMI fell to 52.9. This was below forecasts and was the first decline after three consecutive months of gains.
The NY trading session showed that the ISM's manufacturing PMI gauge rose strongly to 61.3 in August. This beat estimates of a 57.6 forecast and a strong rebound from July's 58.1.
Construction spending data was however slightly weaker as activity increased just 0.1% on the month which was below forecasts.
Earlier today, the quarterly GDP report from Australia showed that the economy advanced 0.9% on the second quarter. This was higher than the forecasts of a 0.7% increase. The first quarter GDP data was also revised higher to show a 1.1% increase.
The European trading session will be dominated by the services PMI reports from the Eurozone including Spain, Italy, Germany, and France. The composite services PMI for the Eurozone is expected to remain steady at 54.4, unchanged from the month before.
In the UK, services PMI is forecast to rise modestly to 53.9. This comes following July's headline print of 53.5.
The NY trading session will see the Canadian trade balance figures coming out. Later in the day, the Bank of Canada will be holding its monetary policy meeting. No changes are expected to the overnight cash rate which is expected to stay put at 1.50%.
USD/CAD Daily Outlook
Daily Pivots: (S1) 1.3116; (P) 1.3163; (R1) 1.3235; More...
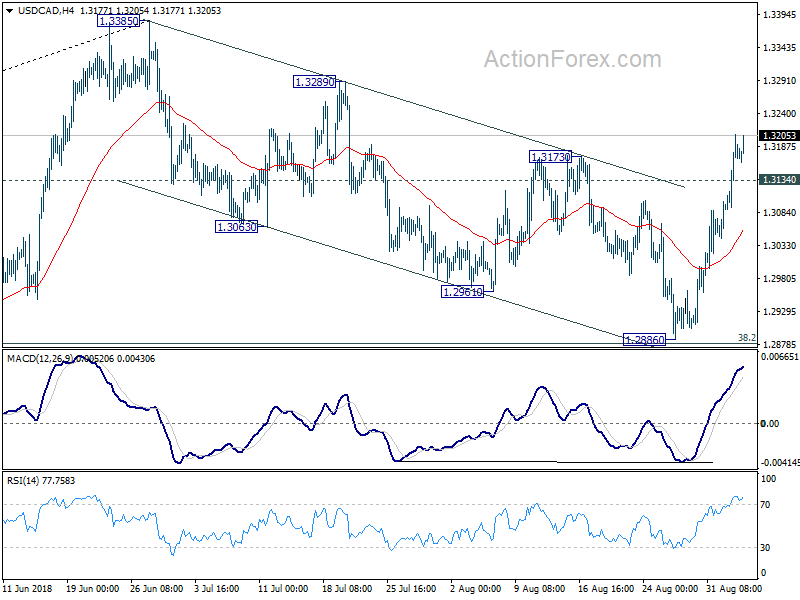
Intraday bias in USD/CAD remains on the upside at this point. Corrective pull back from 1.3385 should have completed at 1.2886 already, just ahead of 1.2879 key fibonacci level. Further rise should be seen to retest 1.3385 first. Break will resume the whole up trend form 1.2061 and target next key resistance level at 1.3685. On the downside, below 1.3134 minor support will turn intraday bias neutral and bring consolidation first, before staging another rally.
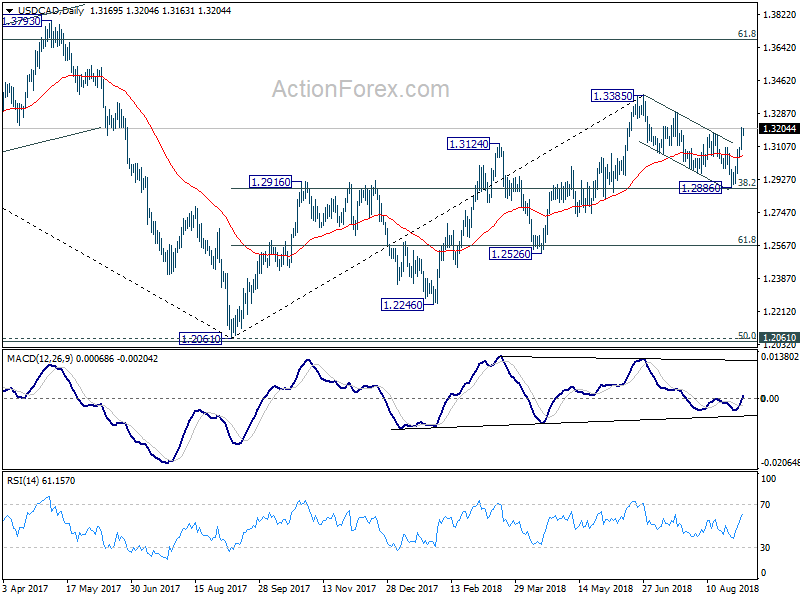
In the bigger picture, strong rebound ahead of 38.2% retracement of 1.2061 to 1.3385 at 1.2879 key fibonacci level retains medium term bullishness. That is, rise from 2017 low at 1.2061 is still in progress. Break of 1.3384 should target 61.8% retracement of 1.4689 (2015 high) to 1.2061 (2017 low) at 1.3685. On the downside, as long as 1.2886 support holds, outlook will now remain bullish.
Currencies: Dollar Profits Only Modestly As Global Uncertainty Persists
Rates: US Treasuries start week on weak footing
Higher oil prices and strong US eco data took the edge over weakness on EM FX & stock markets yesterday, sending core bonds lower as US investors returned from the long weekend. The magnitude of the (US) moves suggests that more could be at play. Will negative bond sentiment survive today if risk sentiment sours further?
Currencies: dollar profits only modestly as global uncertainty persists
Yesterday, the dollar succeeded modest intraday gains as EM markets' stress persisted. However, the performance of the US currency was far from impressive. Today, EM tensions and US trade policy will remain the dominant factors global (FX) trading. Will the dollar keep the benefit of the doubt?
The Sunrise Headlines
- US stock markets opened with losses on Tuesday but could partly recover through the day. Asian markets opened similarly this morning with all major indices in red and China underperforming the bunch.
- After the money laundering scandal with Danske Bank yesterday, EU regulators have warned in a confidential paper that the bloc's controls on money laundering has serious weaknesses and shortcomings.
- Japan's PM Abe has set out a plan to reform social security to face growing challenges of an ageing population. He proposes to raise Japan's retirement age beyond 65 and allow people to defer their pension beyond 70.
- The Nikkei Japan PMI Services rose to 51.5 in August, the highest level in 4 months, from 51.3 in July. The PMI for Manufacturing rose from 51.8 to 52.0, but analysts warn for risks of trade war to Japan's export-oriented economy.
- Australia's economy grew at its fastest pace in six years, with 0.9% GDP growth in the second quarter, bringing the GDP year-on-year to 3.4%. A fast growth of population fuelled demand for homes and infrastructure.
- China's August Caixin services PMI declined from 52.8 in July to 51.5 in August, as new businesses picked up only moderately. The PMI Composite declined as well, from 52.3 to 52.0 this month, indicating economic growth is cooling down.
- Today's eco calendar contains August services PMI's in EMU (final) and UK. EMU retail sales (MoM/YoY) are released as well. ECB chief economist Peter Praet speaks in Vienna. Fed Bullard and Kashkari are scheduled to speak as well
Currencies: Dollar Profits Only Modestly As Global Uncertainty Persists
Only modest USD gains despite global uncertainty
On Tuesday, the dollar initially rebounded. European equities reversed a constructive open and turned in risk-off mode. Investors were cautious as uncertainty on the US trade policy persisted and as several emerging markets stayed under pressure. The dollar played its safe haven role. EUR/USD dropped to the 1.1530 area. However, the US dollar couldn't keep its intraday gain despite a strong manufacturing ISM and rising US yields. US stocks reversing most intraday losses maybe capped further USD gains. EUR/USD closed the session at 1.1582 (from 1.161). USD/JPY finished at 111.41 (from 111.07). This morning, most Asian markets remain in risk-off modus, with the likes of Indonesia hit the hardest. Still, the USD performance is far from impressive. EUR/USD is trading in the high 1.15 area. Australia Q2 GDP printed strong at 0.9% Q/Q and 3.4% Y/Y. The Aussie dollar (AUD/USD 71.90) regained slightly ground after testing the lowest level since May 2016. Today, the eco calendar is thin with only the final EMU services PMI and the US trade balance on the agenda. The debate on global/US trade policy and EM tensions probably remain the dominant factors for USD trading. In theory, this context looks USD supportive. Yesterday, the US currency recorded some intraday gains, but the performance was far from impressive. We maintain the working hypothesis that EUR/USD 1.1791/1.1850 resistance will be tough for EUR/USD short-term and keep a cautious USD positive bias. However, recent price action suggests fortunes for the dollar might change if global uncertainty (trade & EM) were to ease.
Yesterday, sterling avoided further losses after Monday's decline. Eco data were again soft (BRC sales and the construction PMI). However, the data had little impact on sterling. EUR/GBP lost a few ticks in line with the intraday EUR/USD decline. BoE's Carney in a hearing before parliament indicated he is prepared to stay longer at the BoE to support a smooth brexit. Today, the UK services/ composite PMI's will be released. The manufacturing and construction measure earlier this week suggest downside risks. We stay cautious on sterling as long as the brexit chaos persists. The 0.91 area is the next point of reference if sentiment on sterling deteriorates further. EUR/GBP 0.9306 is key. A break would suggested real brexit panic
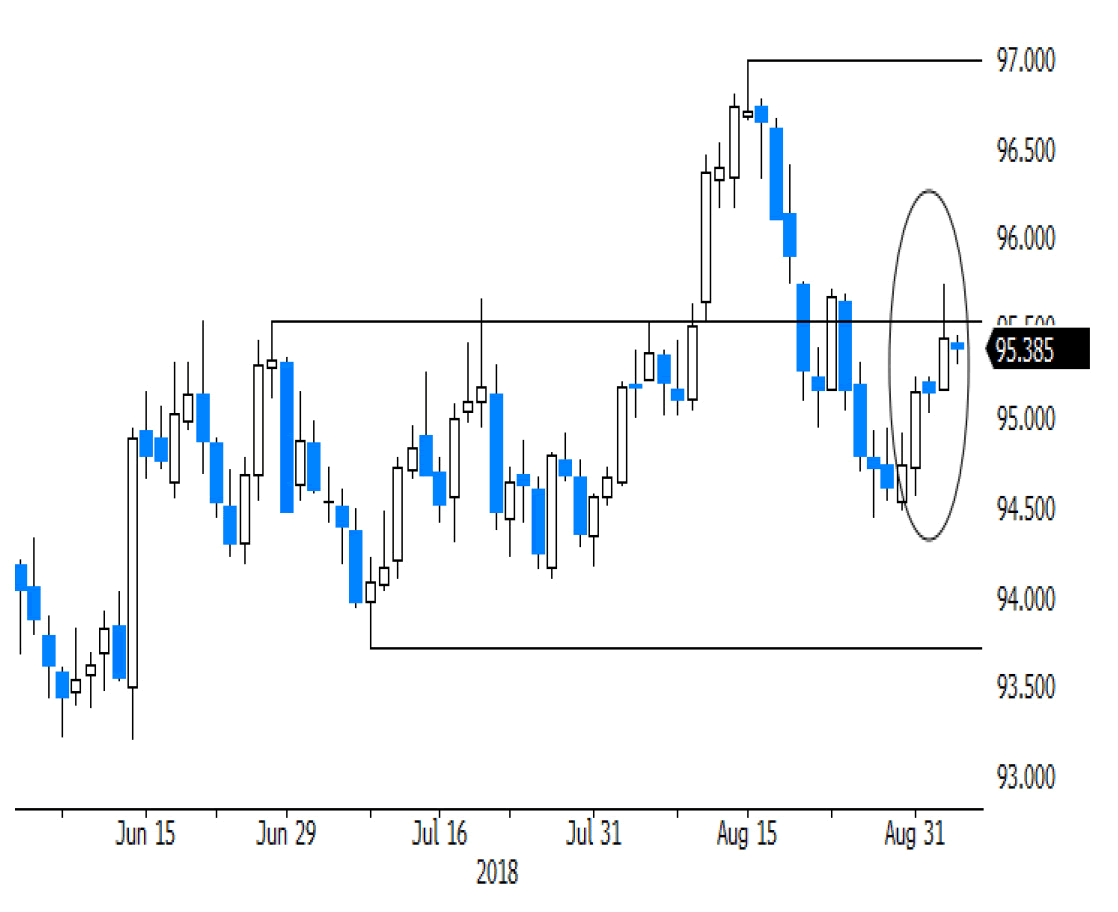
USD (Trade-weighted DXY) gains remain modest despite global uncertainty
EURUSD Short Term Trend Still Bearish Below 1.1650
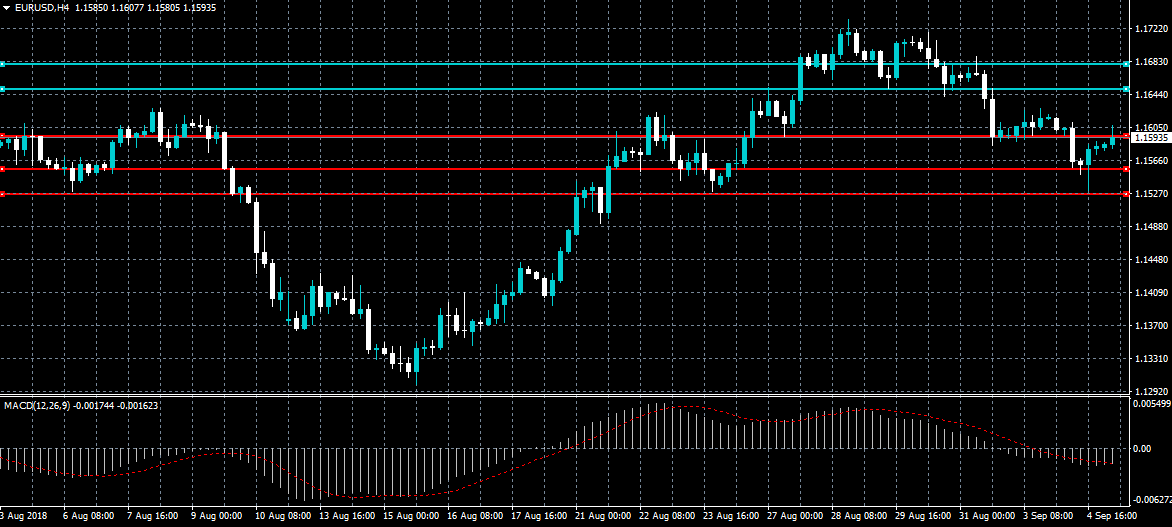
The euro currency has corrected towards the 1.1600 level against the US dollar, with price creating an even larger head and shoulders pattern. The MACD indicator across the four-hour time frame is attempting to move higher after Tuesday’s bounce from the 1.1529 level. EURUSD traders now look to key Retail Sales and PMI data from the eurozone economy this morning.
The EURUSD pair remains bearish while trading below the 1.1650 level, key technical support is now found at the 1.1553 and 1.1529 levels.
If the EURUSD buyers move price above the 1.1600 level, key resistance is found at the 1.1650 and 1.1680 levels.
GBPUSD Awaits Key UK Services Data
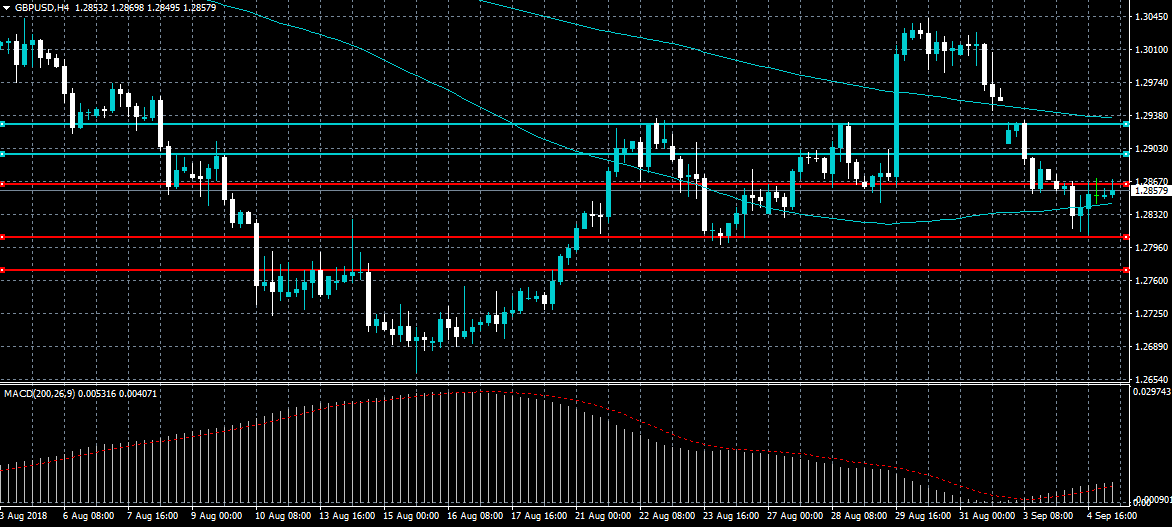
The British pound has moved away from the 1.2800 support region against the US dollar, as the greenback edges away from the best levels of the week. The GBPUSD pair now looks to the release of key PMI Services data from the UK economy, with market expectations tilted to the upside. Sellers will look to break the 1.2810 support level, while buyers will attempt to reclaim the 1.2900 level.
The GBPUSD pair remains intraday bearish while trading below the 1.2863 level, key support is now found at the 1.2810 and 1.2775 levels.
If the GBPUSD pair moves above the 1.2900 level, buyers are likely to target the 1.2930 and 1.2955 resistance levels.
Ethereum Remains Near Ytd Lows As Argument For Its Demise Is Made
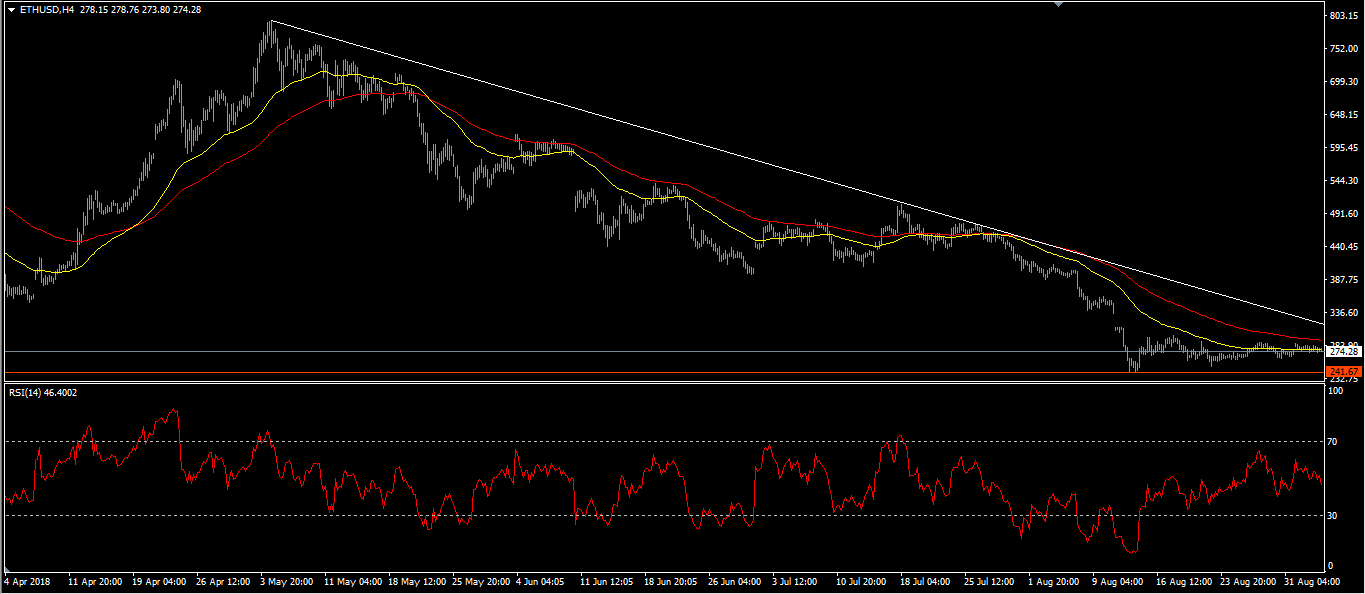
Ethereum reached an all-time high of $1370 in January this year. Since then, the second largest cryptocurrency has lost all those gains and is currently trading at $275. In August alone, the currency traded within a narrow range of $241 and $312. This is despite the positive crypto news that was released during the month.
On Monday, TechCrunch published a report that predicted that ETH will collapse soon. The article sent shivers among Ethereum enthusiasts because of the popularity of the website. It is the largest technology website in the world with millions of visitors every month. The author, Jeremy Rubin, based his arguments on the fact that ETH is different from Bitcoin. While Bitcoin was created to be a digital currency, Ethereum was created as a platform to enable developers to create and run applications. These developers are then required to pay fees which are known as ETH Gas. The author writes: “If all the applications and their transactions can run without ETH, there’s no reason for ETH to be valuable unless the miners enforce some sort of racket to require users to pay in ETH.”
Yesterday, Ethereum Co-Founder, Vitalik Buterin, said that Ethereum will be valueless if it failed to evolve. In response to Rubin’s critique, he confirmed that if Ethereum failed to change “all parts of the author’s argument” would be correct.
The ETH/USD pair is now trading at 274.71. This is still within the narrow range it has traded in the past one month. Traders should now wait and see. If it starts an upward trend, it will be an ideal period to buy and move with it. If it breaks below the 241 level, it will likely continue the downward movement to below 200.
Domestic Spending Lifts Australia Q2 GDP To 3.40%
The Aussie jumped slightly against the US dollar in the Asian market session after data showed that the economy grew at a faster rate than traders were expecting. The accelerated growth was attributed to an increase in government spending in Q2. GDP expanded by 0.9% quarter on quarter. This was higher than the expected 0.7%. It was however below the 1.1% growth from the first quarter. On an annualized basis, the growth rose by 3.4%, which was better than expected. This data came a day after the Reserve Bank of Australia (RBA) made no interest rates changes and indicated that the expansionary policies will remain for an extended period. Traders expect a rate hike to come in the first quarter of 2020.
The Japanese service sector picked up in August according to data from Nikkei-Markit. The services PMI was at 51.5, which was higher than the expected 51.3. This was the twenty-straight month that this PMI has remained above 50. PMI numbers above 50 are said to show growth while those below 50 show contraction. The output of manufacturing too was better than expected. As a result, the Nikkei Composite Output Index rose to 52 in August from 51.8 a month before. In addition to this, the employment growth was at a 14-month high. These numbers are positive for an economy that has struggled to attract inflation.
The euro is slightly higher than the dollar as traders wait for PMI numbers from the European Union. The services PMI in the EU is expected to remain unchanged at 54.4. The composite PMI is also expected to remain at 54.4. The same is true with the German services PMI which is expected to remain at 55.7. Retail sales in the region are expected to grow by an annualized rate of 1.3%, which will be better than the previous 1.2%.
EUR/USD
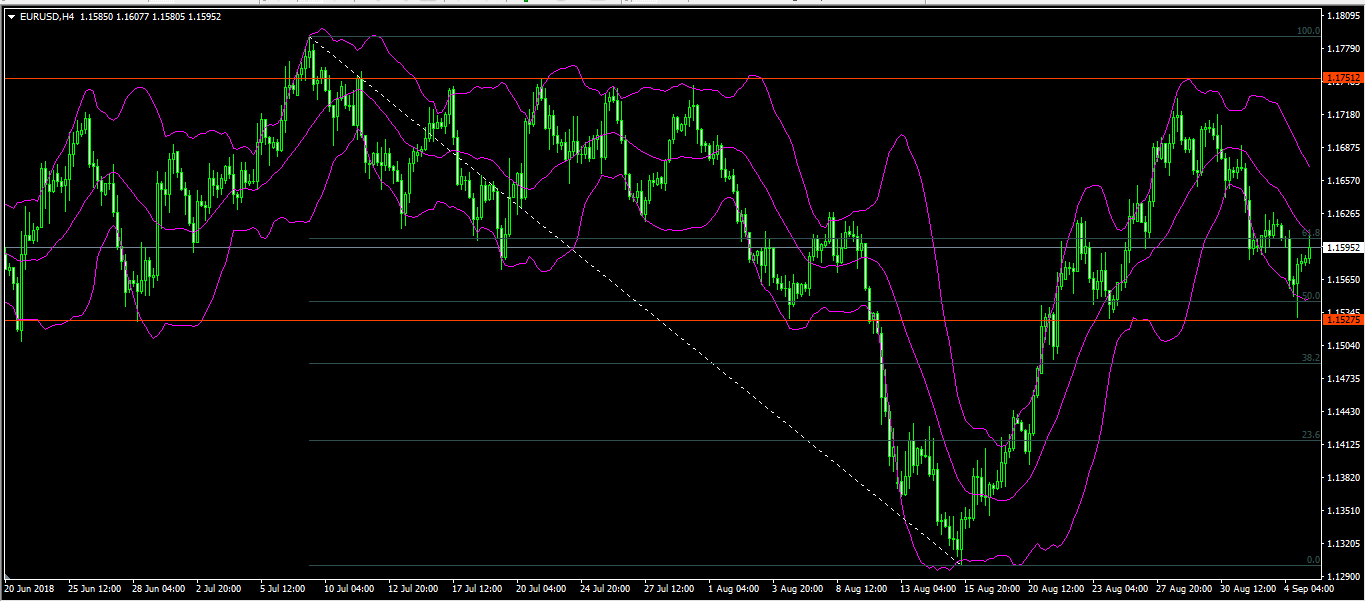
Yesterday, the EUR/USD pair ended the day at 1.1527, slightly below the 50% Fibonacci Retracement level. Today, the pair has jumped slightly as traders wait for the services PMI data. It is trading at 1.1596. If the pair crosses the 50% Fibonacci level, it will likely test the next support of 1.1486.
USD/JPY
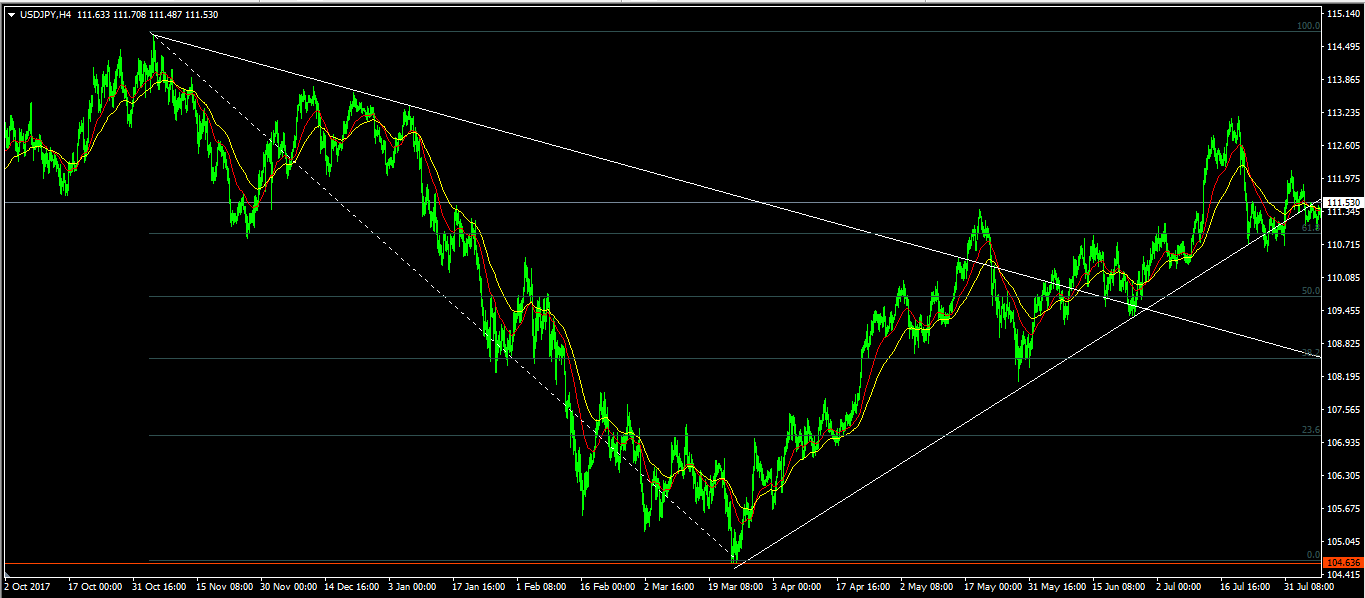
On Tuesday last week, the USD/JPY pair crossed the important support and resistance level of 109.4. Since then, the pair has gained, reaching a high of 113.15. This was the highest level since January this year. Today, the pair is trading at 111.53, which is close to the 61.8% Fibonacci Retracement level. It is also on the same level as the 25 and 50-day Exponential Moving Average. If it continues to move upwards, the pair will likely want to test the resistance level of 113.15 and if it moves lower, it will test the 109.77 support.
AUD/USD
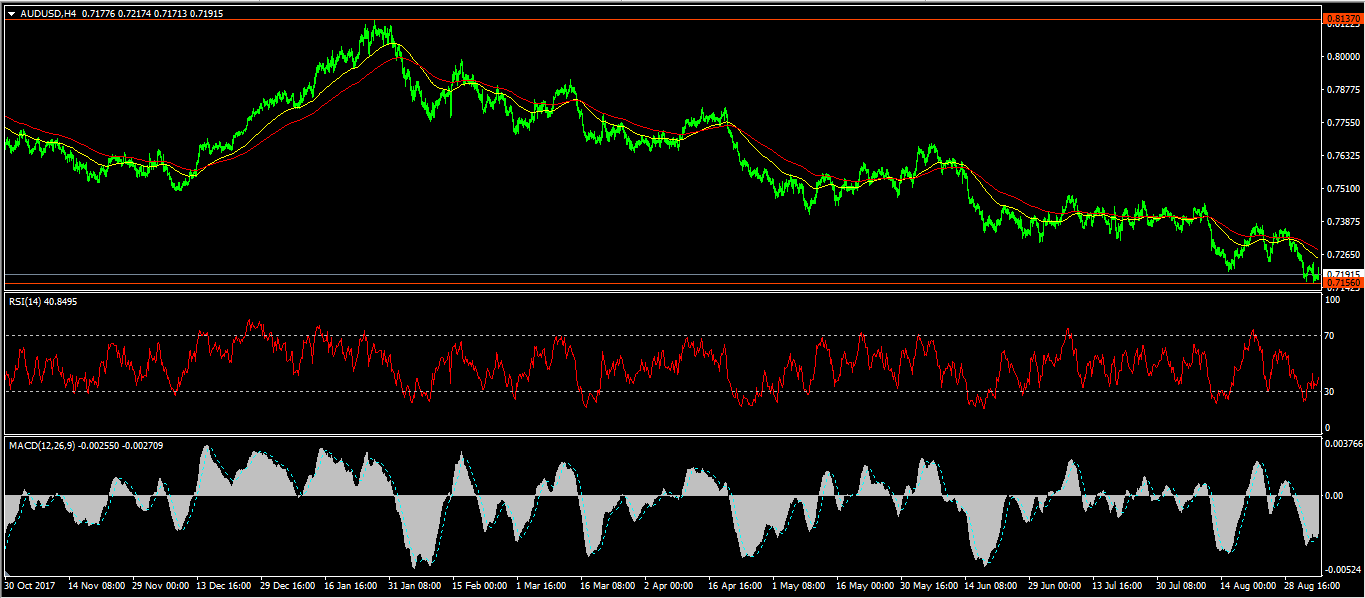
The AUD/USD pair reached a YTD high of 0.8137 in February. Since then, the pair has been making lower lows and lower highs. Yesterday, it reached the YTD low of 0.7156 after the RBA meeting. The RSI has moved from below the oversold level of 30 and is currently at 40, while the MACD remains at lower levels. The price is below the 50-day EMA and 100-day EMA. The pair is likely to continue the downward momentum, though traders need to be careful about a long-term reversal.
AUDUSD Dips To 25-Month Low, Looks Oversold
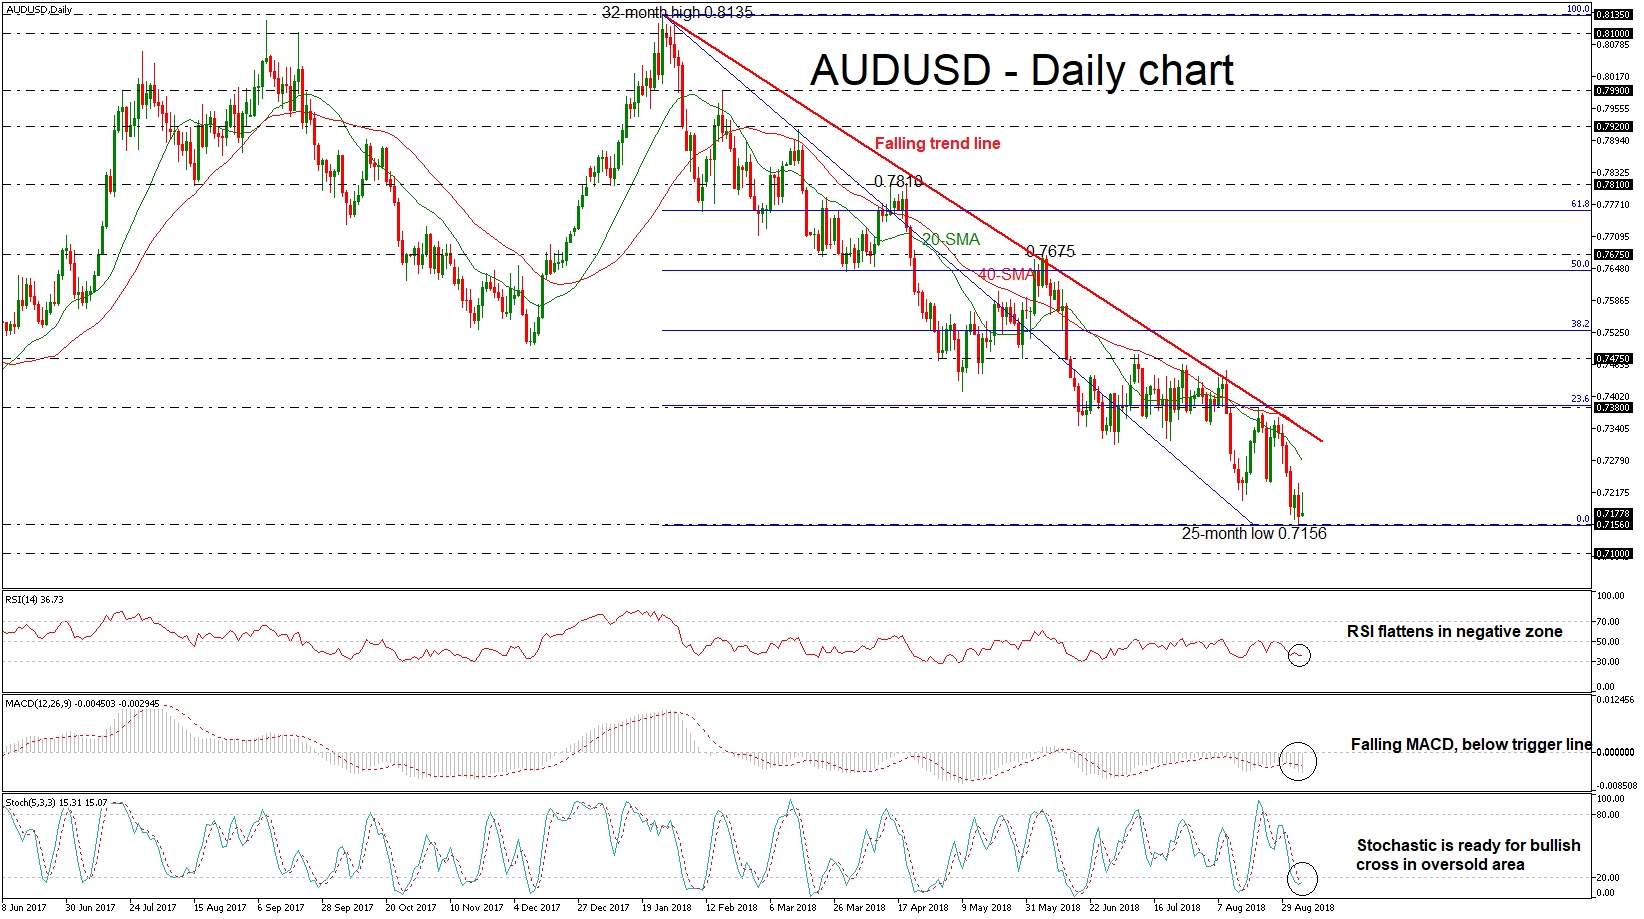
AUDUSD is losing its positive momentum that started the day, while it posted a fresh 25-month low of 0.7156 on Tuesday. The bearish trend could stay in place given that prices continue to fluctuate below the 20- and 40-simple moving averages (SMAs) in the daily timeframe. However, some of the technical indicators are indicating that the pair is oversold and a possible upside retracement may be due.
The RSI indicator is flattening in the negative territory with no clear momentum, while the %K line of the stochastic oscillator is ready for a bullish crossover with the %D line in the oversold zone, giving a strong upside signal. Though, the MACD oscillator continues to strengthen its bearish bias below the trigger and zero lines.
Should the pair stretch south, Tuesday’s low of 0.7156 could provide immediate support before the pair touches the next significant psychological level of 0.7100. If the sell-off extends, attention could turn to the 0.7000 key handle, taken from the troughs on February 2016.
On the flip side, the 20-day SMA currently at 0.7280 may halt upside movement as it did several times over the last month. If traders continue to have a buying interest the next immediate support could come from the medium-term descending trend line, before being able to re-challenge the 23.6% Fibonacci retracement level of the downleg from 0.8135 to 0.7156, near 0.7380.
In the medium-term picture, AUDUSD has been developing within a downtrend over the past seven months, after the pullback on the 32-month high of 0.8135.
GBP/USD Testing Fibonacci Resistance Levels Of Wave-4
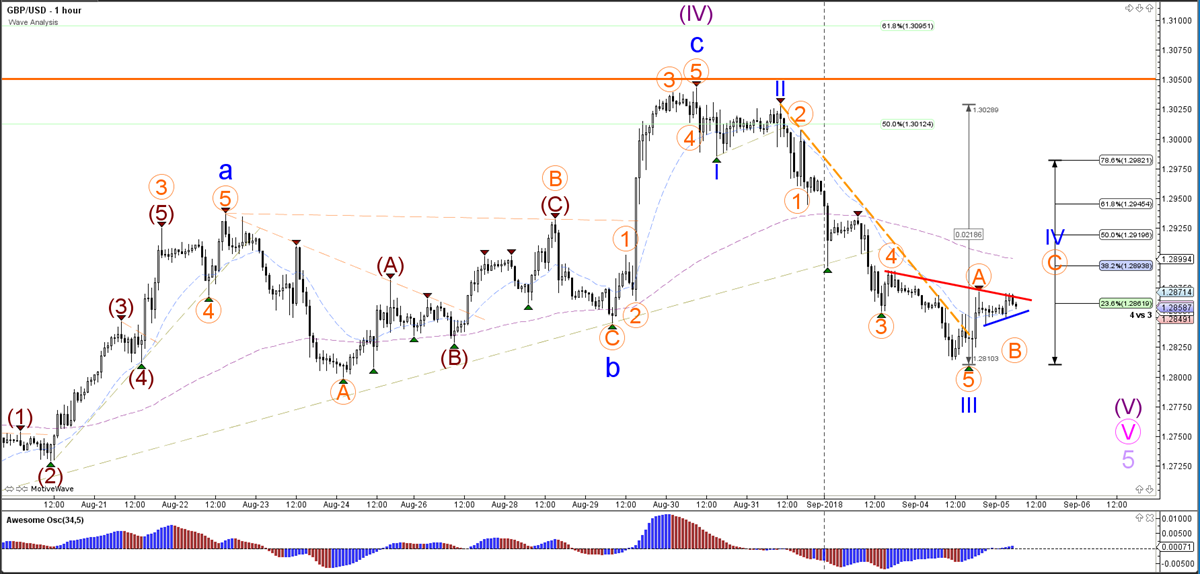
The GBP/USD is showing strong bearish momentum after completing an ABC zigzag within a wave 4 (purple) correction. The bearish breakout could indicate a restart of the downtrend within waves 5. Whether the price has completed a wave 3 (blue) or a wave 1 will depend on how the price reacts to the Fibonacci retracement levels of wave 4 vs 3 (see the 1 hour chart for more information).
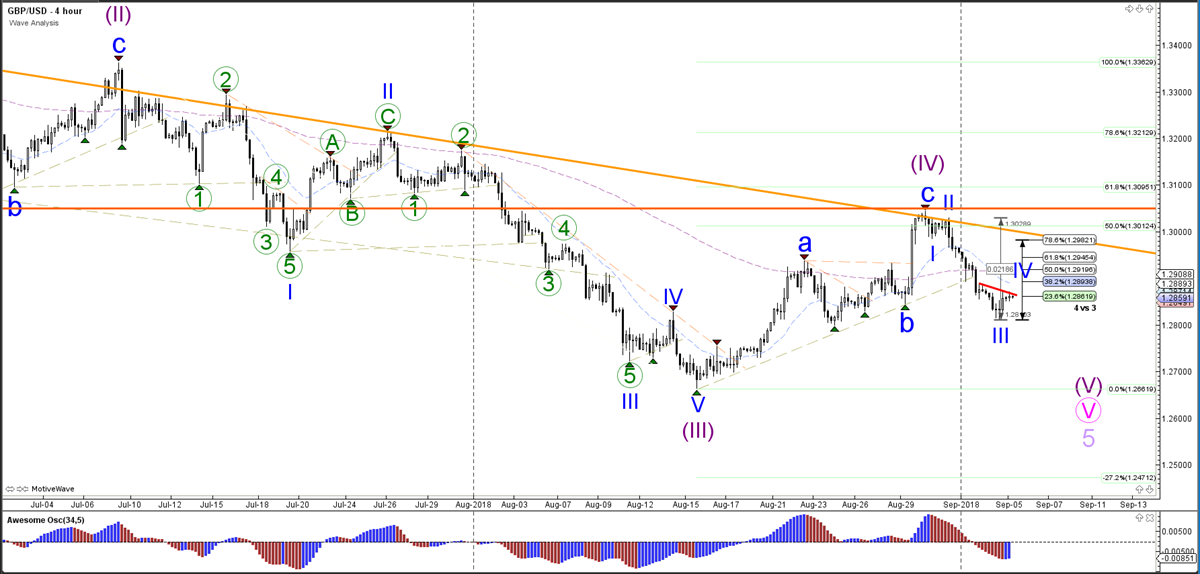
The GBP/USD could be building a wave 4 (blue) if the price stays below the 50% Fibonacci retracement level. A break above the 50% Fib could indicate a wave 1-2 pattern rather than a wave 3-4.