Sample Category Title
Pound Slide Continues as Construction PMI Slumps
GBP/USD has lost ground in the Tuesday session, continuing the losses seen on Monday. In the North American session, the pair is trading at 1.2829, down 0.30% on the day. On the release front, Construction PMI in August dropped to 52.9, shy of the estimate of 54.9. The reading was down sharply from the July release of 55.8 points. In the U.K, BoE Governor Mark Carney testified about inflation before Parliament’s Treasury Committee. In the U.S, ISM Manufacturing PMI jumped to 61.3, well above the estimate of 57.6 points. On Wednesday, the U.K releases Services PMI.
The pound has dropped for a fourth straight session, as investors reacted negatively to a weak construction PMI. The indicator missed expectations and fell to a 3-month low. Not surprisingly, construction firms remained very concerned about the lack of clarity of Brexit, which has had a negative impact on business confidence. The weak release follows a soft Manufacturing PMI, and the disappointing numbers have pushed the British pound 1% lower this week.
With investors again focused on global trade tensions, the U.S dollar is broadly higher on Tuesday. Foremost in investors’ mind is the simmering trade dispute between the U.S and China. So far, the two economic giants have imposed $50 billion in tariffs on each other, and President Trump has threatened further tariffs worth some $200 billion, which could be imposed as early as this week. The U.S could elect to impose the tariffs in smaller bites, such as a $50 billion tariff. Trade trouble brews elsewhere as well. Talks are continuing between the U.S and Canada, after Friday’s deadline passed with no agreement in place. The EU has also engaged in a tit-for-tat tariff exchange with the United States. The dollar has climbed significantly since trade tensions began in April, as the dollar has benefited from being the primary reserve currency.
UK services PMI Coming Up as Sterling Continues to Languish
The British pound continued to feel the heat this week, pressured by fading hopes for a Brexit deal, as well as a disappointing streak of UK economic data. The currency will look towards the August services PMI for some reprieve, due out on Wednesday at 0830 GMT, though it seems doubtful that even a stronger-than-expected print would be enough to lead to a sustained rebound in sterling amid a lack of meaningful progress on the Brexit front.
With the Brexit negotiations seemingly stuck in limbo and the Bank of England (BoE) not expected to deliver another rate hike until the end of 2019 according to market-implied pricing derived from UK overnight index swaps, it’s no surprise seeing sterling underperform most of its peers. Even some conciliatory remarks from EU chief negotiator Michel Barnier that provided some relief to the currency last week were quickly walked back, bringing back to the fore worries that a no-deal Brexit is becoming an increasingly more probable outcome with every new day.
Recent data have not done the currency any favors either, with both the manufacturing and the construction PMIs for August disappointing, and feeding market expectations that the BoE may indeed take no action again for more than a full year. This puts even more emphasis on the services PMI that is due out on Wednesday to either confirm this narrative or pour cold water on it, as the services sector is by far the largest one in the UK economy – accounting for roughly 80% of GDP.
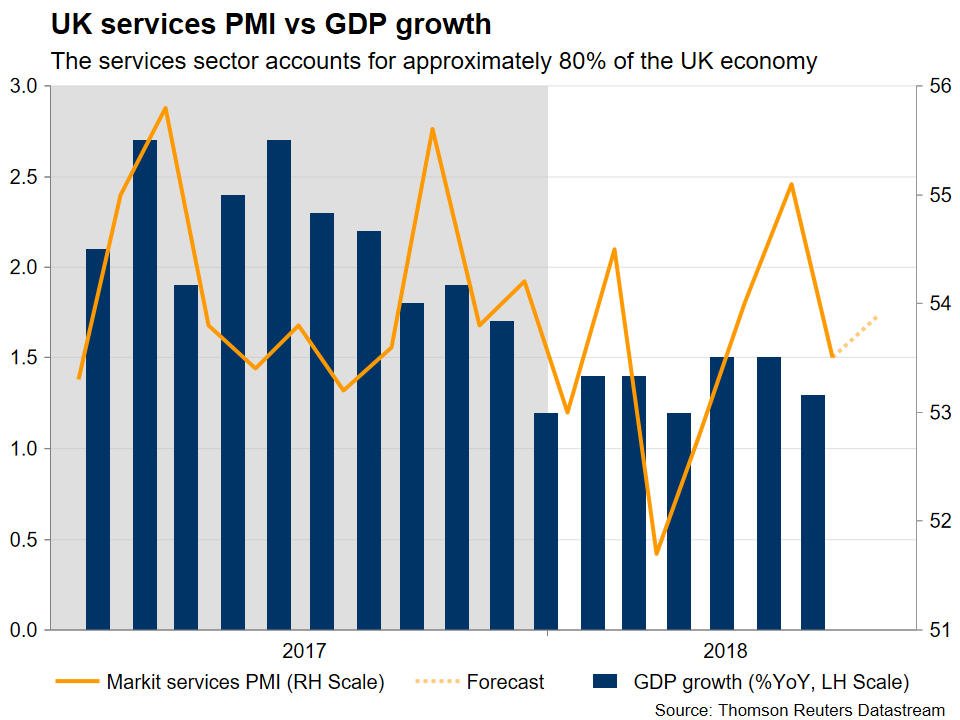
In August, the Markit services PMI is forecast to have risen to 53.9, from 53.5 previously. That said, considering the miss in both the manufacturing and the construction indices, one would be forgiven to take this forecast with a grain of salt. A number above 50 denotes expansion in the sector, while a number below 50 signals contraction.
Even in case of a better-than-projected print, it’s doubtful whether the pound would be able to stage any sustained rally in such an environment. Markets are currently anticipating the next 25bps rate increase by the BoE to come in November 2019 – a pricing so pessimistic relative to the healthy state of the UK economy that it probably incorporates expectations that Brexit issues will keep policymakers away from touching the hike button. Therefore, even encouraging economic data may be unable to bring materially forward BoE rate hike expectations, until there is some clarity on the post-Brexit trading relationship, something that seems unlikely to transpire over the coming weeks at least.
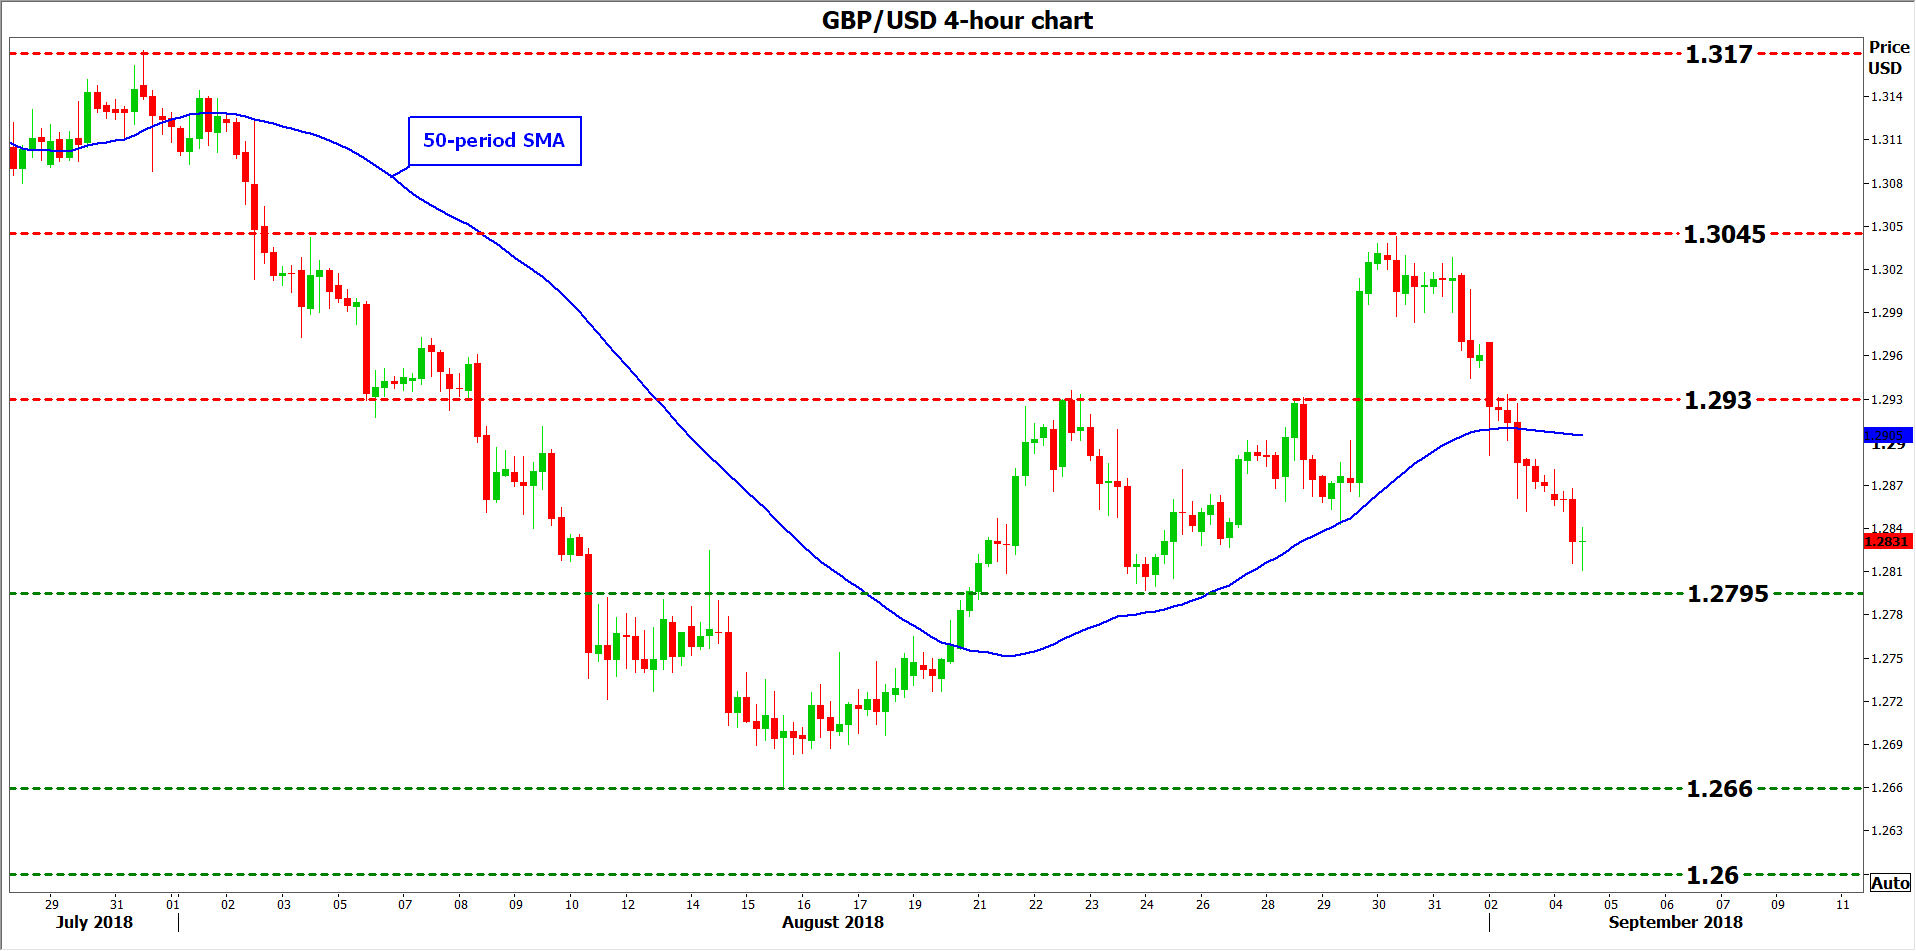
Technically, looking at sterling/dollar, further declines could encounter immediate support near the 1.2795 hurdle that halted the pair’s decline on August 24. Should the bears pierce below it, the attention would increasingly shift to the 14-month low of 1.2660, before the round figure of 1.2600 comes into scope.
On the upside, and in case of a data-beat that provides some relief to the UK currency, advances could stall initially near the 1.2930 area, which capped the pair’s gains on August 22 and 28. Even higher, the August 30 peak of 1.3045 may come into play, with even steeper advances possible to encounter resistance near 1.3170, this being the July 31 top.
US: Manufacturing Activity Accelerates in August
After a brief respite in July, the Institute for Supply Management (ISM) manufacturing index rose 3.2 percentage points 61.3 in August. This was above market expectations for a small decline to 57.7 from 58.1 in July.
All of the main subcomponents of the headline index rose in August. The largest moves were recorded in new orders (+4.9 to 65.1), and production (+4.8 to 63.3). Employment rose 2 p.p. to 58.5 in the month.
Trade-related subcomponents expanded at a slower pace in August. Export orders were down 0.1 p.p. to 55.2 while imports fell -0.8 to 53.9. The pace of growth in both export and import orders has weakened considerably since steel and aluminum tariffs were announced by the U.S. administration this past March.
As an indicator of things to come, the spread between new orders and inventories widened to 9.7 from 6.9 previously, a sign that the current expansion is likely to continue in the weeks ahead.
Of the 18 manufacturing industries reporting, 16 recorded growth in August. Wood products and primary metals industries declined in the month.
Key Implications
The U.S. manufacturing sector picked up steam in August, with few signs of slowing down. However, survey respondents remain concerned about tariffs, and cite shortages of labor, truckers, and electrical components. Price pressures appear to have levelled off somewhat, but further price increases are still anticipated in some industries.
Tariffs continue to play havoc with supply chains. With tariffs on an additional $200 bn in annual Chinese imports expected to be announced by the U.S. administration later this week, price pressures and component shortages are not likely to ease anytime soon. Thus far U.S. manufacturers have been able to shoulder the additional burden the tariffs have imposed on them, but the escalating trade spat with China and waning global demand may yet test the durability of the current expansion.
EURUSD: Retains Its Bearishness, Aims At 1.14001.1393 Region
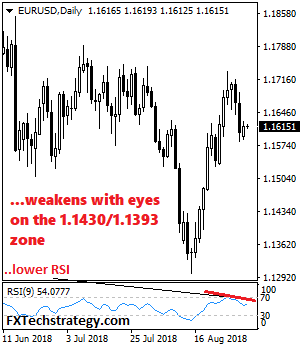
EURUSD: The pair saw further weakness on Tuesday with eyes its support located at 1.1393 level. Further down, support lies at the 1.1350 level where a violation will aim at the 1.1300 level. A break of here will aim at the 1.1250 level. Below here will open the door for more weakness towards the 1.1200. Its daily RSI is bearish and pointing lower suggesting more decline. On the upside, resistance comes in at 1.1550 level with a break through there opening the door for more upside towards the 1.1600 level. Further up, resistance lies at the 1.1650 level where a break will expose the 1.1700 level. All in all, EURUSD faces further downside pressure on sell off.
Japanese Yen Dips as Trade Fears Boost Greenback
The Japanese yen is showing little movement in the Tuesday session. In North American trade, the pair is trading at 111.46, up 0.35% on the day. In economic news, U.S ISM Manufacturing PMI jumped to 61.3, well above the estimate of 57.6 points. There are no major Japanese indicators on the schedule.
The U.S manufacturing sector is in good shape, according to a key indicator. In August, the ISM Manufacturing PMI survey climbed to 61.3, up from 58.1 a month earlier. This marked the indicator’s highest level since February 2011. The survey found that strong business conditions had created a stronger demand for manufactured goods. However, many manufacturers are concerned with tariffs and how long they will last, which has led to uncertainty in the pricing of goods.
With investors again focused on global trade tensions, the U.S dollar is broadly higher on Tuesday. Foremost in investors’ mind is the simmering trade dispute between the U.S and China. So far, the two economic giants have imposed $50 billion in tariffs on each other, and President Trump has threatened further tariffs worth some $200 billion, which could be imposed as early as this week. The U.S could elect to impose the tariffs in smaller bites, such as a $50 billion tariff. Trade trouble brews elsewhere as well. Talks are continuing between the U.S and Canada, after Friday’s deadline passed with no agreement in place. The EU has also engaged in a tit-for-tat tariff exchange with the United States. The dollar has climbed significantly since trade tensions began in April, as the dollar has benefited from being the primary reserve currency.
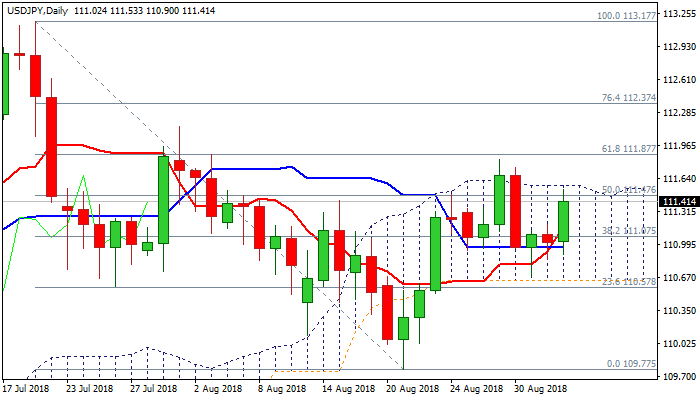
USDJPY – Upbeat US Data Underpin Dollar for Final Break above Daily Cloud Top
The pair rallied and holding near daily high at 111.53, maintaining strong pressure on daily cloud top (111.57) after receiving fresh boost from upbeat US data.
US manufacturing PMI came well above forecast (Aug 61.3 vs 57.6 f/c), hitting the highest since May 2004.
Further evidence of positive outlook for the US economy underpins the greenback, which looks for eventual break above cloud top.
Momentum studies regained traction and support the advance, as rising 100SMA (110.40) tracks after containing Aug dip and maintains bullish structure.
Extended consolidation under cloud top may precede final push higher, with dips to be contained at 111.00 zone (converged 10/30/55 SMA’s).
Res: 111.57; 111.87; 112.15; 112.37
Sup: 111.23; 111.00; 110.92; 110.40
“Bulls” Are Pushing the Oil Upwards
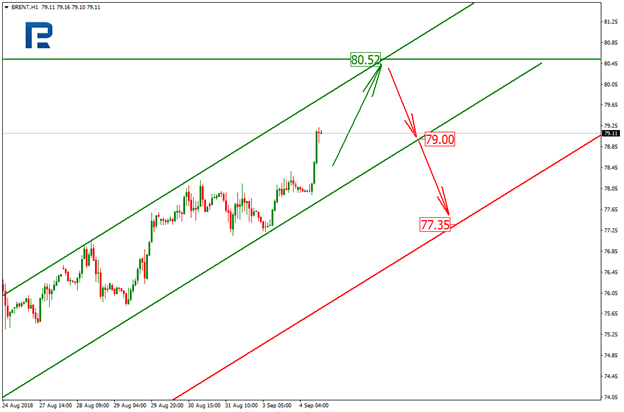
The Oil is getting closer to its short-term highs and it seems like “bulls” really have a chance to make Brent break 80 USD and go higher. Although the most part of catalysts that helps “bulls” are speculative and passing, the price continues moving upwards because of momentum.
The news from the Middle East is in favor of “bulls”. It is not new, but still quite strong and influential. Frist of all, the Iran factor. Remember that the global oil market may lose the oil from Iran in two months due to the US sanctions. There are some options in the form of individual contracts, for example with China and India, which are now trying to circumvent sanction restrictions. However, so far the big picture says that the oil flow from Iran may really run short. In addition to that, there is a Libyan issue: suppliers are constantly facing interruptions in deliveries due to the complicated political situation in the country, which is not expected to get any better.
The second issue is directly connected with the first one: if Iran and Libya don’t provide the oil market with the amount of oil specified before, some kind of “supply void” will appear sooner or later. It will be rather difficult to fill this void even considering that right now countries-members of the OPEC+ are extracting oil almost without any restraints.
The short-term support factor for the oil is the hurricane season in the Gulf of Mexico. Last year, it had significant influence on the oil extraction in the area and the amount of oil stocks in the USA. Right now, forecasts of hurricanes that might take place in Florida are quite conflicting.
However, one thing that may be some kind of “bottleneck” for “bulls” is trade wars between the USA and China. Solution for this conflict of interests, which is directly influencing the oil demand, is very unlikely to appear in the next 9-12 months.
The H1 chart of Brent shows an ascending impulse inside the long-term uptrend. It looks like the current impulse is heading towards the high at 80.52. After reaching this level, the price is expected to resume falling inside a new correction. The first correctional target may be the support line of the current channel at 79.00. If the instrument breaks this level, the correction may continue towards 77.35, which is inside the downside projected channel.
Sunset Market Commentary
Markets
Core bonds lost ground today in a volatile session with US investors returning after Labour Day. Asian stock markets finished on a high note which resulted in a strong European opening as well, causing a first downleg in core bonds. The move didn’t last even if Brent crude rallied from $78/barrel to $79.50/barrel with tropical storm Gordon causing havoc in the Gulf of Mexico (evacuation of rigs). Risk sentiment dwindled with EM FX under new selling pressure after disappointing South-African Q2 GDP data. The country enters a technical recession (2 consecutive negative growth quarters). EMU PPI accelerated more than forecast in July (0.4% M/M, 4% Y/Y), but went unnoticed. Core bonds faced new selling pressure as US investors entered dealings despite the risk-off climate. US Treasuries underperformed German Bunds. The move comes at a straight time with trade event risk (Canada/US talks; possible action on additional $200bn Chinese goods) looming as well. Medium term, we continue to expect higher US yields with supply rising in Q4, the Fed tightening policy further and the economy steaming ahead. The US yield curve bear steepens with yields 0.6 bps (2-yr) to 3.5 bps (30-yr) higher. The German yield curve bear flattens with yields rising by 1.5 bps (2-yr) to 0.6 bps (30-yr). 10-yr yield spreads vs Germany narrow up to 5 bps with Greece underperforming (+6 bps) and Italy (-12 bps) outperforming. Italian BTP’s rallied after Lega Salvini suggested to let the budget deficit widen to 2% of GDP instead of the rumored 3% of GDP. That way, Italy pledges to respect EU rules and might avoid a short term rating downgrade.
Today, European investors nervously await the next steps of the US administration in several high profile battles in their crusade to change global trade (Canada, China tariffs, dispute with the EU autos, amongst others). Several EM markets/currencies (ZAR, ARS, INR….) extending losses added to the negative sentiment. Safe haven flows turned to the dollar. EUR/USD slipped below the 1.16 mark. Of late, global sentiment often improved as US traders joined the fray. Losses of US equity futures were modest compared to the performance of European equities., but US investors showed some caution, too. Core yields also rose with the dollar getting most additional interest rate support. All this helped the dollar to maintain intraday gains. EUR/USD settled in the 1.1550 area. Interestingly, USD/JPY (111.25 area) also held up well despite the risk off. The trade-weighted dollar trades in the 95.50 area.
Sterling avoided further losses after yesterday’s decline. Eco data were again soft with BRC sales and the UK construction PMI printing soft/weaker than expected. However, the data had no big impact on sterling. EUR/GBP lost a few ticks in line with the overall EUR/USD decline. BoE’s Carney and two other MPC members attended a hearing before the Parliament’s Treasury Committee. Questions mostly concerned the impact of brexit on the economy rather than concrete issues on monetary policy in the near future. Sterling shows a mixed picture with EUR/GBP returning to the 0.90 area. At the same time, cable (1.2850) is also losing modest ground on USD strength.
News Headlines
Euro zone’s producer prices rose more than expected in July. The PPI (MoM) rose by 0.4% from 0.3% in June, while a stable figure was expected. The year-on-year figure rose 4% last month from 3.6% in June (3.9% expected). Again, higher energy prices were the biggest contributor to the rise in producer prices.
In the US, the ISM Manufacturing index rose sharply to 61.3 in August, from 58.1 in July, while consensus was a decline to 57.6. Meanwhile, Canada’s manufacturing growth lost further momentum in August, as the index declined for a second straight month to 56.8 (from 56.9 in July and 57.1 in June).
EUR/USD Mid-Day Outlook
Daily Pivots: (S1) 1.1595; (P) 1.1611; (R1) 1.1634; More.....
EUR/USD drops further to as low as 1.1529 and focus is on 1.1529 support. Firm break there will indicate e completion of the corrective rebound and turn bias to the downside for retesting 1.1300 low. Decisive break there will resume larger down trend from 1.2555. On the upside, above 1.1627 minor resistance will turn bias back to the upside for 1.1733 and possibly above. But in that case, we'd continue to expect strong resistance from 38.2% retracement of 1.2555 to 1.1300 at 1.1779 to limit upside, at least on first attempt, to bring near term reversal.
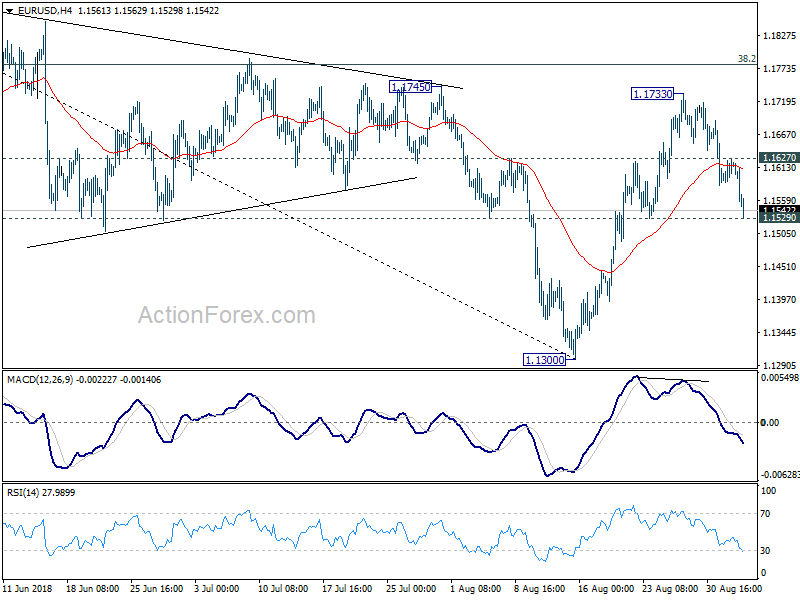
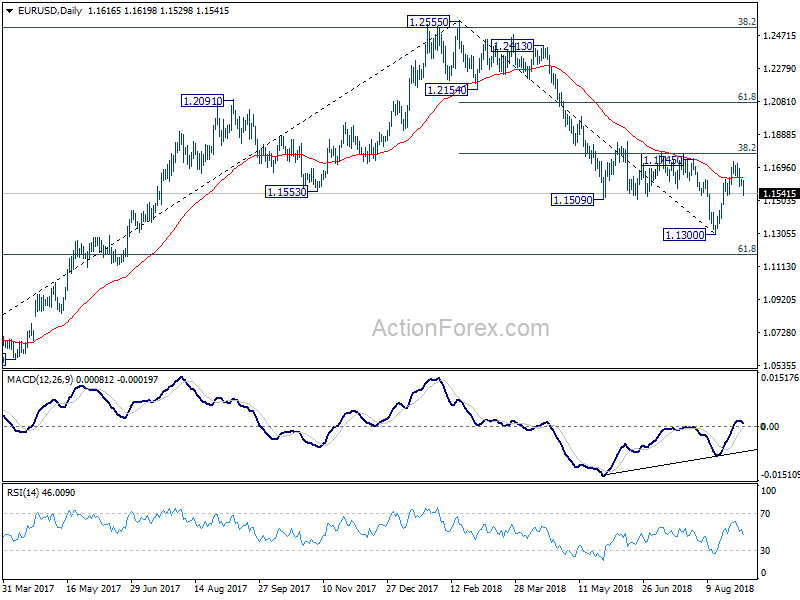
In the bigger picture, a medium term bottom should be in place at 1.1300, on bullish convergence condition in daily MACD and some consolidations would be seen. But still, note that EUR/USD was rejected by 38.2% retracement of 1.6039 (2008 high) to 1.0339 (2017 low) at 1.2516. That carries some long term bearish implications. Thus, we'd expect fall from 1.2555 high to resume after consolidation completes. Below 1.1300 should send EUR/USD through 61.8% retracement of 1.0339 to 1.2555 at 1.1186. And, in that case, EUR/USD would head to retest 1.0339 (2017 low).
GBP/USD Mid-Day Outlook
Daily Pivots: (S1) 1.2839; (P) 1.2889; (R1) 1.2922; More...
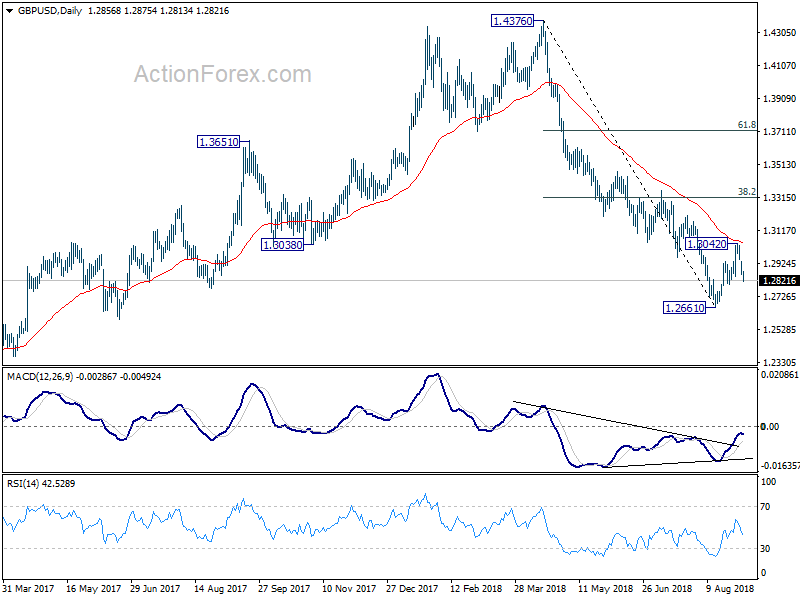
GBP/USD's firm break of 1.2844 support now suggests that corrective rebound from 1.2661 has completed at 1.3042. Intraday bias is turned back to the downside for retesting 1.2661 first. Decisive break there will resume larger down trend from 1.4376. On the upside, above 1.2932 minor resistance will extend the correction from 1.2661 with another rise, possibly through 1.3042 resistance. But in that case, upside should be limited by 1.3316 fibonacci level to finish the rebound and bring near term reversal.
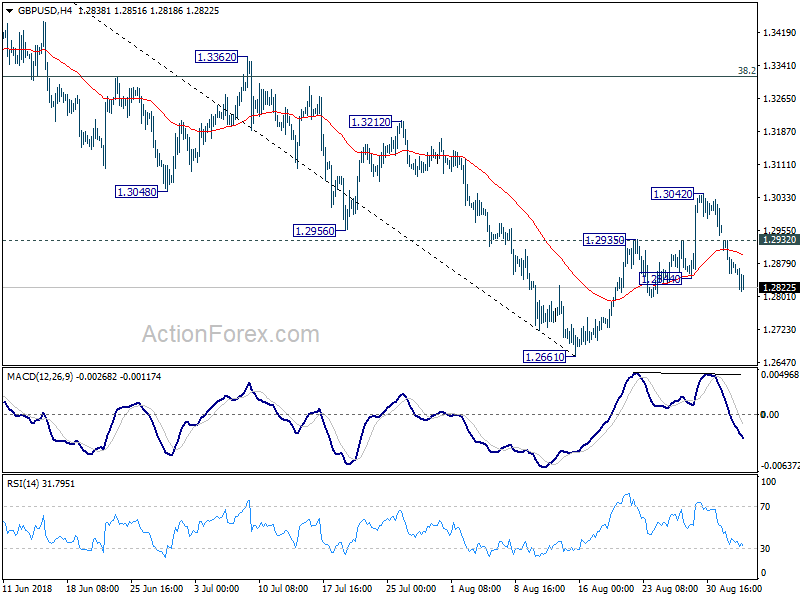
In the bigger picture, whole medium term rebound from 1.1946 (2016 low) should have completed at 1.4376 already, after rejection from 55 month EMA (now at 1.4099). The structure and momentum of the fall from 1.4376 argues that it's resuming long term down trend. And this will be the preferred case as long as 38.2% retracement of 1.4376 to 1.2661 at 1.3316 holds. However, firm break of 1.3316 would bring stronger rebound to 61.8% retracement at 1.3721. And, the eventual depth of the fall from 1.4376, and the chance of hitting 1.1946 low, will depend on the strength of the interim corrective rebound from 1.2661.