

Sample Category Title
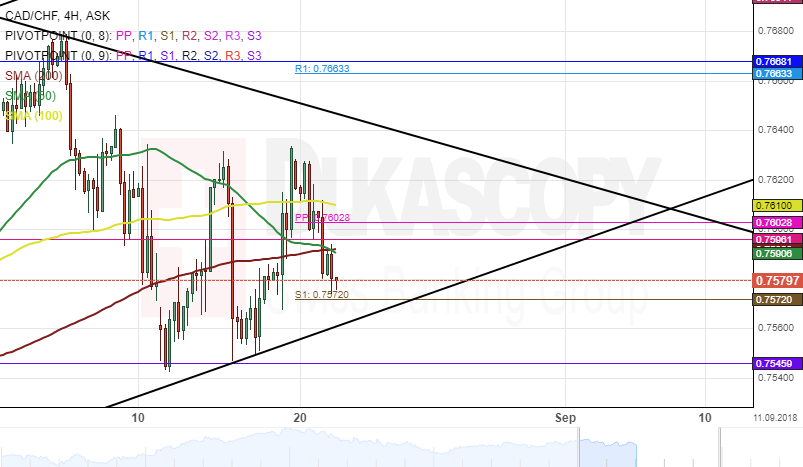
CAD/CHF 4H Chart: Upside Momentum Likely
The Canadian Dollar has been appreciating against the Swiss Franc since late June when it bounced off the lower boundary of a dominant ascending channel pattern near the 0.7395 regions on June 25. The currency pair reached a two-month high level on August 8.
However, after piercing a resistance cluster formed by the combination of the weekly and the monthly pivot points at 0.7668, the exchange rate made a U-turn south.
Everything being equal, it is likely that the CAD/CHF currency exchange rate continue trading in the dominant ascending channel during the following trading sessions.
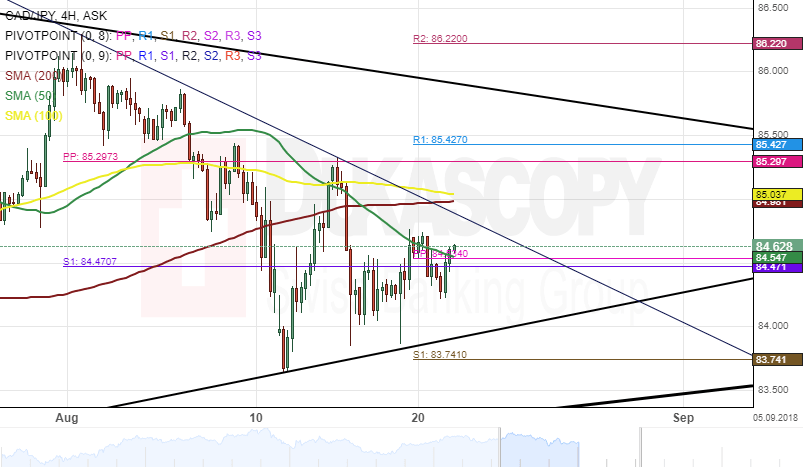
CAD/JPY 4H Chart: Bearish Momentum Today
The Canadian Dollar has been trading in a large-scale triangle pattern against the Japanese Yen. The currency pair has been moving between the upper and the lower borders of the triangle pattern since June 25.
After hitting the upper boundary of the triangle pattern as mentioned above on August 1, the exchange rate reversed south, and as a result, the rate lost 264 base points or 3.06% of its values.
Given that the 55-, 100-, 200-hour simple moving averages have moved above the price, the CAD/JPY currency exchange rate is likely to continue driving down during the following trading sessions.
Forex Technical Analysis: EUR/USD, USD/JPY, GBP/USD
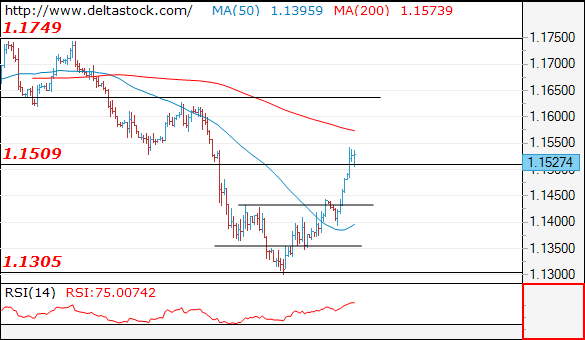
EUR/USD
Current level - 1.1527
The outlook remains positive after the break through 1.1510, for a rise towards 1.1630 area. Initial support is projected at 1.1490, followed by 1.1440.
| Resistance | Support | ||
| intraday | intraweek | intraday | intraweek |
| 1.1550 | 1.1630 | 1.1490 | 1.1300 |
| 1.1630 | 1.1750 | 1.1440 | 1.1100 |
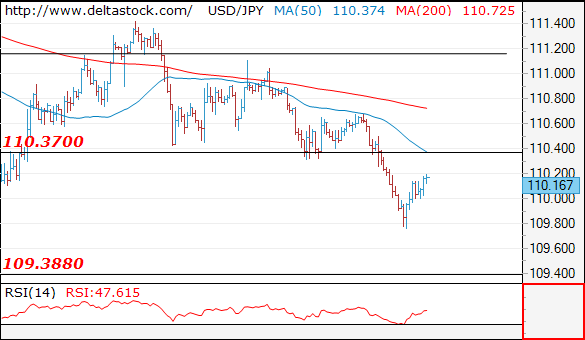
USD/JPY
Current level - 110.16
Allow a brief test of 110.40 resistance before drowning towards 109.30 zone.
| Resistance | Support | ||
| intraday | intraweek | intraday | intraweek |
| 110.40 | 114.50 | 109.40 | 110.10 |
| 112.10 | 114.50 | 109.40 | 109.30 |
GBP/USD
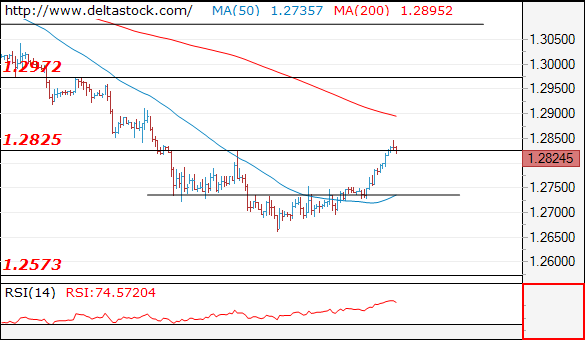
Current level - 1.2824
The bias remains positive, for a continuation towards 1.2970 zone.Key support lies at 1.2750.
| Resistance | Support | ||
| intraday | intraweek | intraday | intraweek |
| 1.2850 | 1.2970 | 1.2750 | 1.2570 |
| 1.2970 | 1.3210 | 1.2660 | 1.2570 |
Trump Once Again Issues Discontent With Strong USD
Investors have received further encouragement to continue taking profit from Dollar positions after President Trump once again repeated his view that both China and the European Union manipulate their currencies. These comments mirror similar remarks made only a few weeks back, and have served as a reminder for traders that the Trump Administration does not want to see exactly what is occurring in the financial markets –i.e. a strong Dollar.
What is likely to linger in the back of the minds of investors and accelerate the near-term softness in the Greenback is that President Trump also stated that he was not thrilled with the Federal Reserve raising US interest rates. This comes just days before the latest Federal Reserve minutes release on Wednesday, and before attention turns to the gathering of central bankers for Jackson Hole at the conclusion of the week.
Central bank independence remains a very sensitive subject for investors, especially after everything that has happened with the Turkish Lira after President Erdogan’s comments on interest rate policy in Turkey.
Investors certainly do not want to see the President of the United States openly commenting on US interest rate policy.
This would risk adding another unpredictable layer of uncertainty to an already volatile financial market that remains highly sensitive to trade war tensions and the general level of political risk that continues to dictate market sentiment. These comments from Trump are likely to ensure that sentiment remains driven by political risk, and investors will eagerly await the resumption of China-US trade talks on Wednesday.
Overall the latest comments from President Trump have allowed emerging market currencies to regain further momentum against a weakening Greenback. The APAC region has continued its positive momentum from the start of the week, with the Thai Baht once again leading the gains on Tuesday. The Thai Baht has gained beyond 0.6% at time of writing. The Chinese Yuan has strengthened narrowly below 0.3% with the Malaysian Ringgit, Indonesian Rupiah, Indian Rupee and Philippine Peso also mirroring the trend of emerging market currencies strengthening against the Greenback. The Korean Won has edged 0.4% higher and the Singapore Dollar has gained just under 0.2%.
Emerging market currencies will remain hopeful that Dollar weakness will overall allow them the opportunity to recover from a painful summer.
At time of writing the South African Rand has edged 1% higher against the Greenback on Tuesday morning. I expect the Rand to remain volatile during trading throughout this week. The inflation release for tomorrow is considered a key economic release for the South African economy and spectators will be keeping an open eye on whether the Rand weakness in recent months has lifted inflationary pressures.
If inflationary pressures for the South African economy are already beginning to build, it wouldn’t be a surprise for the markets to begin speculating that the South African Reserve Bank (SARB) could become more open towards raising interest rates.
Both the British Pound and Euro are benefiting from the unwinding of USD positions. The Japanese Yen has strengthened to a near two-month high following the comments from President Trump accelerating softness in the Greenback.
This Time Trump Can Stop The Dollar Rally
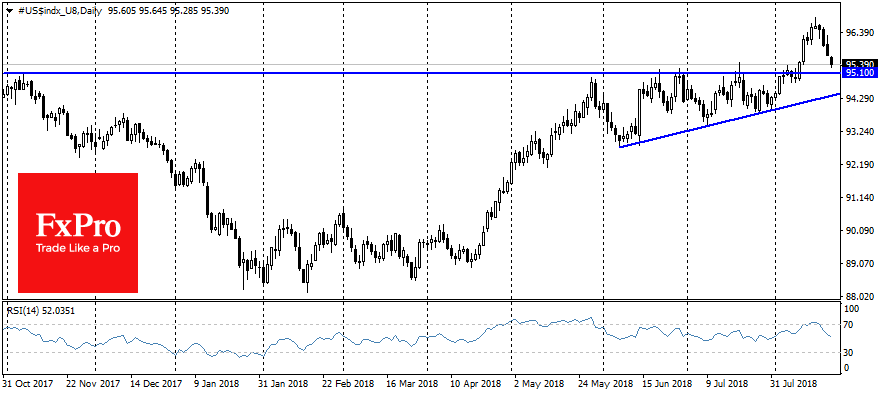
The dollar fell under pressure after Trump's interview with Reuters, where he reiterated that he is “not thrilled” by the actions of the Fed and prefers a policy of low interest rates. The dollar index lost 0.7% over the past 24 hours. EURUSD up to 1.1530, the maximum in the last 2 weeks.
Previously Trump used similar verbal interventions in an attempt to stop the U.S. Dollar rally. Such comments were made on July 19, which restrained the dollar from growth for several weeks. Investors were waiting for Powell's reaction to the president's dissatisfaction. However, the Fed has not changed the rhetoric, hinting at the willingness to raise rates as soon as September. In addition to raising the rate of the Fed, the dollar is also supported by Trump's policy. Trade conflicts with China and diplomatic rifts with Turkey raise the demand for protective assets away from the epicentre of the crisis. Under these conditions, the dollar has played a role of safe-haven asset.
Despite the fact that the central bank is pursuing an independent policy, the president and his administration are nominating candidates for key positions in the Fed, and several appointments are still to be made this year. The markets fear that Trump's words may be a signal to search for more “dovish” candidates for key positions.
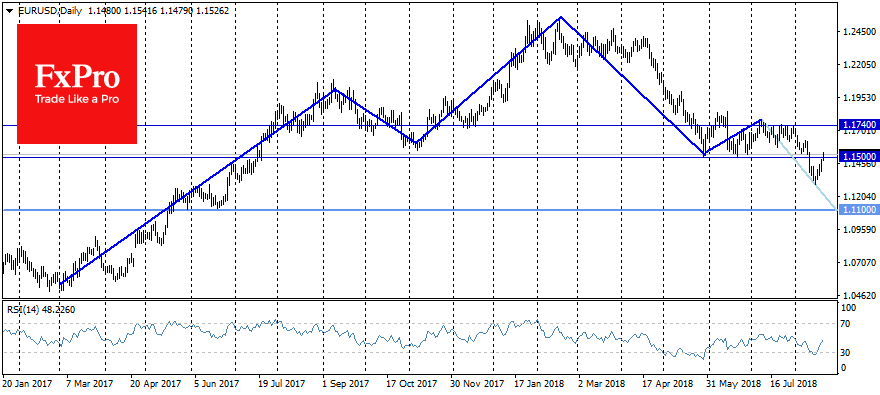
Trump's comments could play an important role in the dollar's dynamics. EURUSD has returned to the area above 1.1500, back to the trading range from May to mid-August. If the pair is able to stay above this mark by the end of the day, technically it will cross out the recent dollar rally. In addition, the relative strength index (RSI) has returned from oversold levels for EURUSD that is another strong bearish signal against dollar.
Thus, Trump's words could seriously affect the technical picture of the dollar for the next few days, preventing it from pausing the rally with potential targets for EURUSD near 1.11 on even lower in 1.04 area. However, for Trump dollar is not a goal, but a means to achieve his political goals. The active imposition of sanctions, as was the case earlier this year against Iran, Turkey and Russia, will preserve the status of a protective asset for the dollar, and the new tariffs continue to force the Fed to raise rates to fight inflation pressure.
The Analytical Overview Of The Main Currency Pairs
The EUR/USD currency pair
Technical indicators of the currency pair:
Prev Open: 1.14375
Open: 1.14808
% chg. over the last day: +0.47
Day's range: 1.15111 – 1.15170
52 wk range: 1.0571 – 1.2557
Yesterday, the bullish sentiment was observed on the EUR/USD currency pair. The growth of quotes was almost 100 points. Today, the US currency has continued to lose ground. At the moment, the key support and resistance levels are 1.14900 and 1.15300, respectively. We recommend opening positions from these marks. The trading instrument has the potential for further growth. Trade negotiations between the US and China are in the focus of attention.
The news feed on the US economy and the Eurozone is calm.
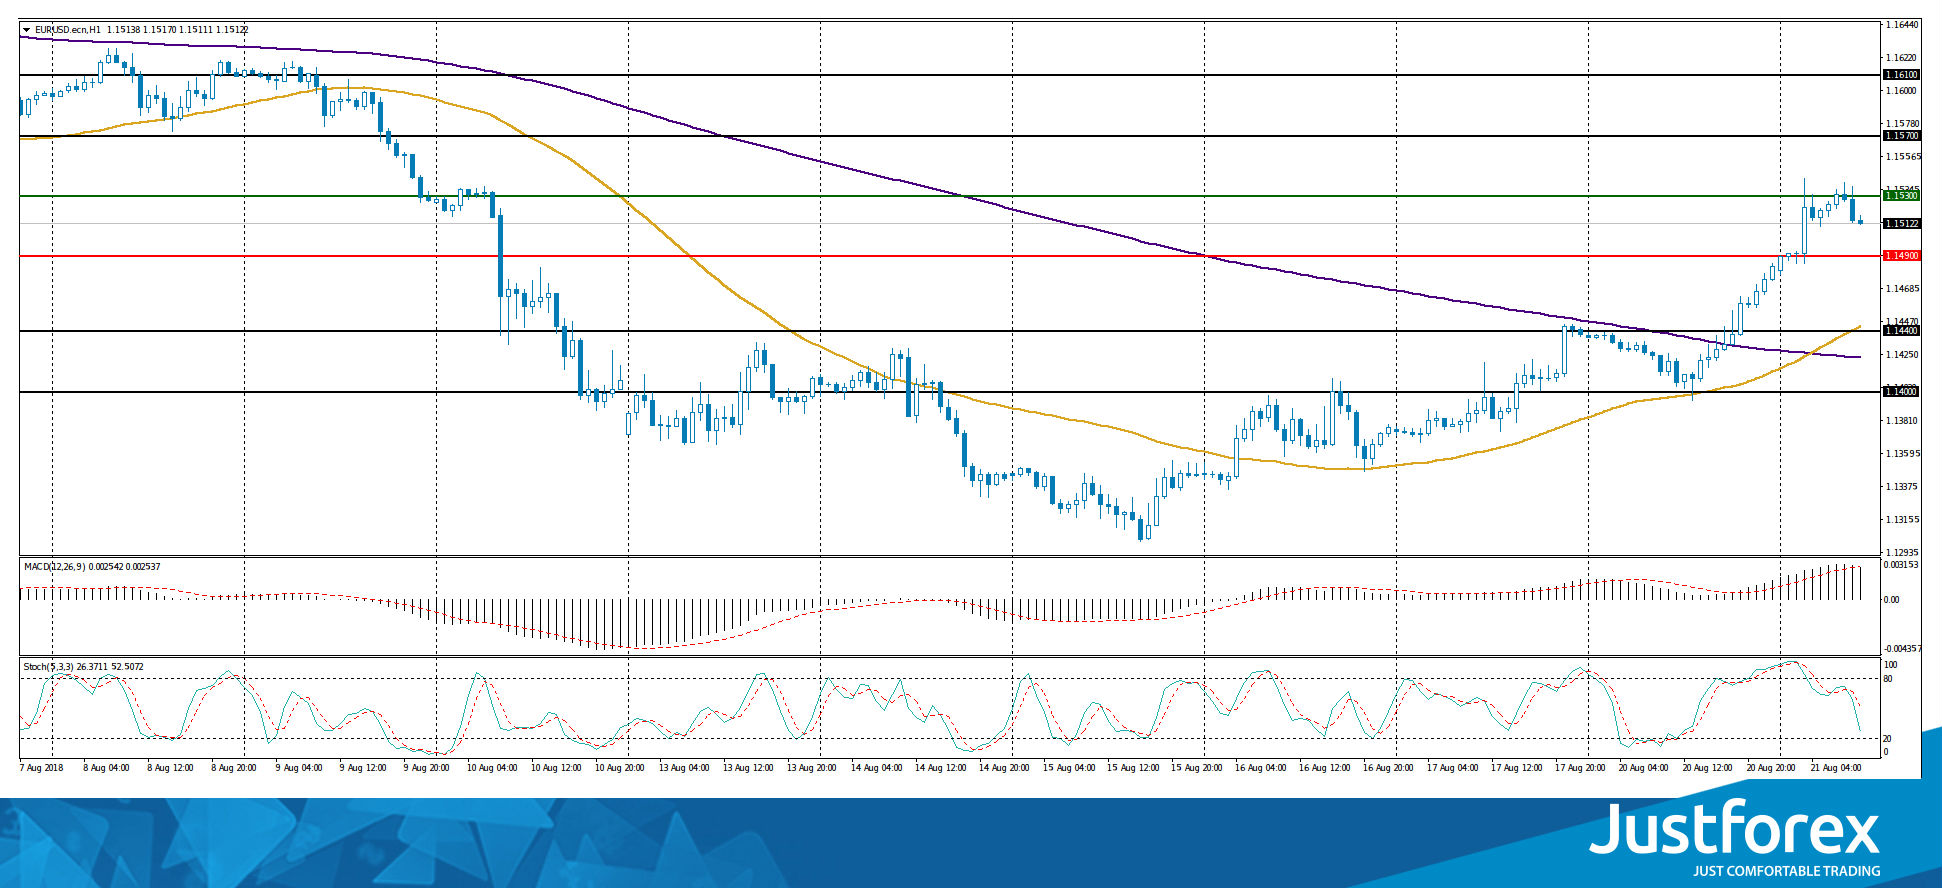
The price has fixed above 50 MA and 200 MA, which indicates the power of buyers.
The MACD histogram is located in the positive zone, above the signal line, which gives a strong signal to buy EUR/USD.
Stochastic Oscillator is in the neutral zone, the %K line is below the %D line, which indicates a decrease in quotes.
Trading recommendations
Support levels: 1.14900, 1.14400, 1.14000
Resistance levels: 1.15300, 1.15700, 1.16100
If the price fixes above the resistance level of 1.15300, further growth of the EUR/USD currency pair is expected. The movement is tending to 1.15700-1.15900.
Alternative option. If the price fixes below 1.14900, we recommend considering sales of EUR/USD. The movement is tending to 1.14500-1.14300.
The GBP/USD currency pair
Technical indicators of the currency pair:
Prev Open: 1.27423
Open: 1.27944
% chg. over the last day: +0.46
Day's range: 1.28238 – 1.28323
52 wk range: 1.2361 – 1.4345
There is an upward trend on the GBP/USD currency pair. During yesterday's and today's trading sessions, the growth of quotes has exceeded 100 points. At the moment, the local support and resistance levels are 1.28100 and 1.28400, respectively. The positions should be opened from these marks. Investors expect current news regarding Brexit.
The news feed on the UK economy is calm.
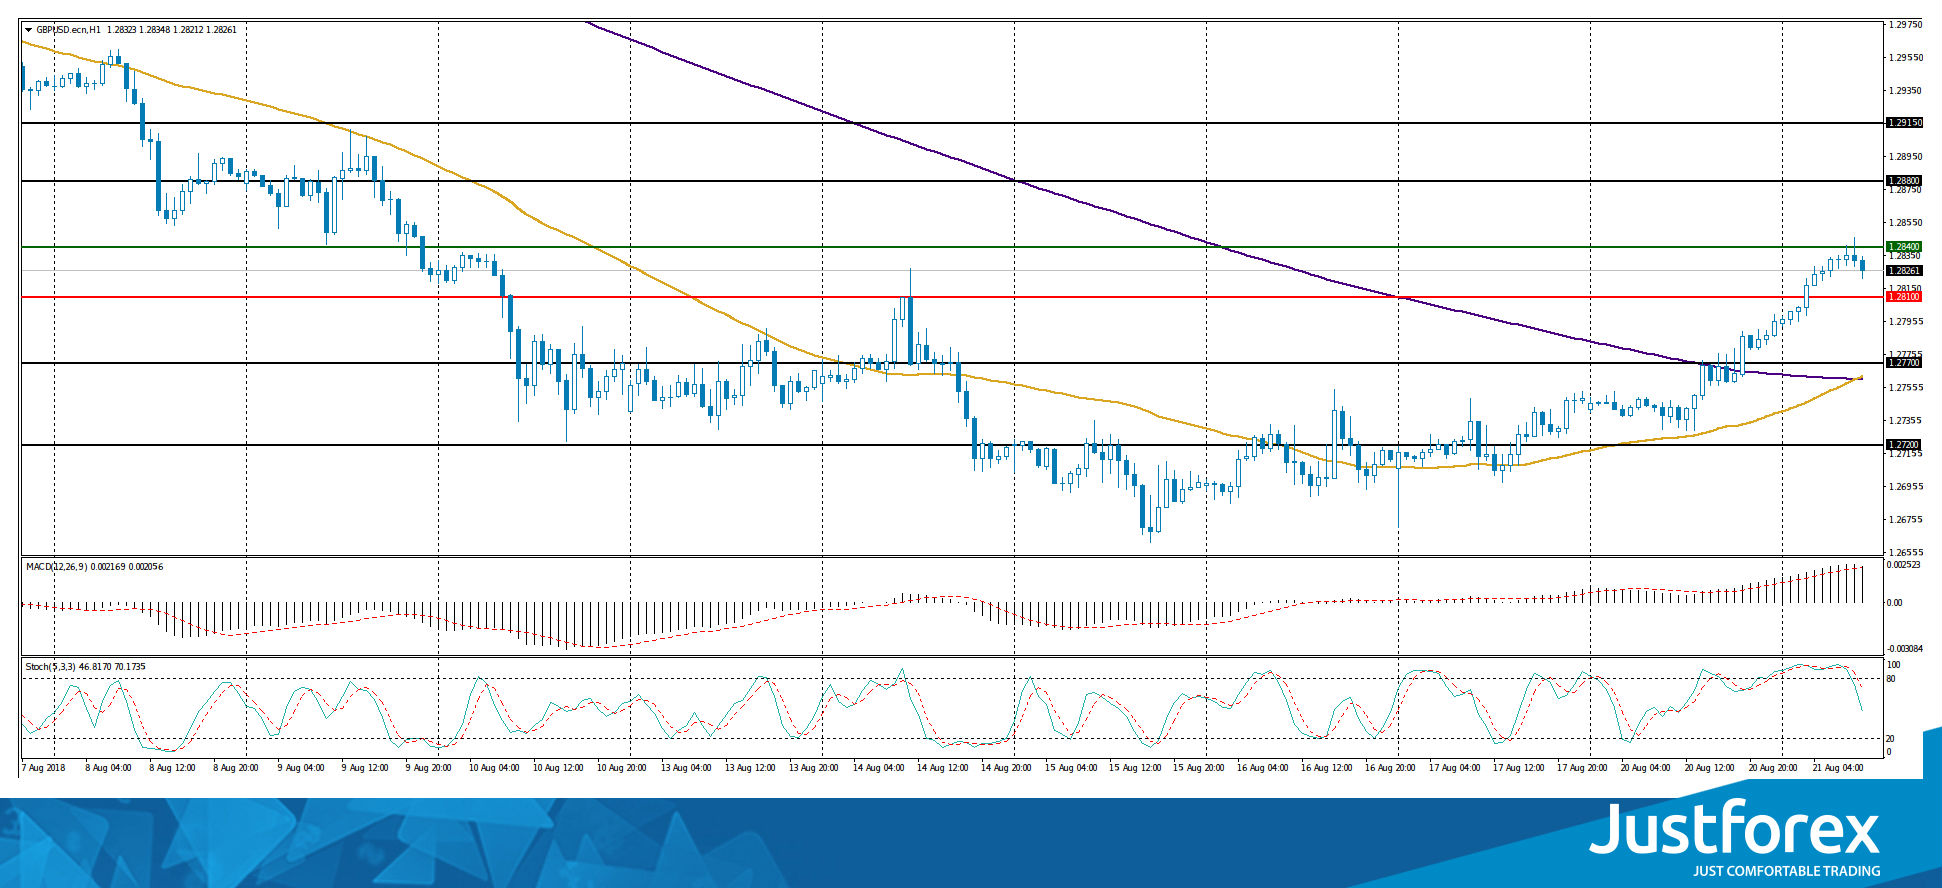
The price has fixed above 50 MA and 200 MA, which indicates the power of buyers.
The MACD histogram is in the positive zone, above the signal line, which gives a strong signal to buy GBP/USD.
Stochastic Oscillator is located in the neutral zone, the %K line is below the %D line, which signals to sell GBP/USD.
Trading recommendations
Support levels: 1.28100, 1.27700, 1.27200
Resistance levels: 1.28400, 1.28800, 1.29150
If the price fixes above 1.28400, further growth of the GBP/USD currency pair is expected. The target movement level is 1.28800-1.29150.
Alternatively, the GBP/USD quotes may decline to the level of 1.27700-1.27500.
The USD/CAD currency pair
Technical indicators of the currency pair:
Prev Open: 1.30598
Open: 1.30437
% chg. over the last day: -0.14
Day's range: 1.30232 – 1.30351
52 wk range: 1.2059 – 1.3795
Yesterday, there were sales on the USD/CAD currency pair. The decrease in quotes exceeded 70 points. At the moment, financial market participants expect additional drivers. Local support and resistance levels are 1.30200 and 1.30450, respectively. We recommend opening positions from these marks. The trading instrument has the potential for further reduce.
Publication of important news is not expected in Canada.
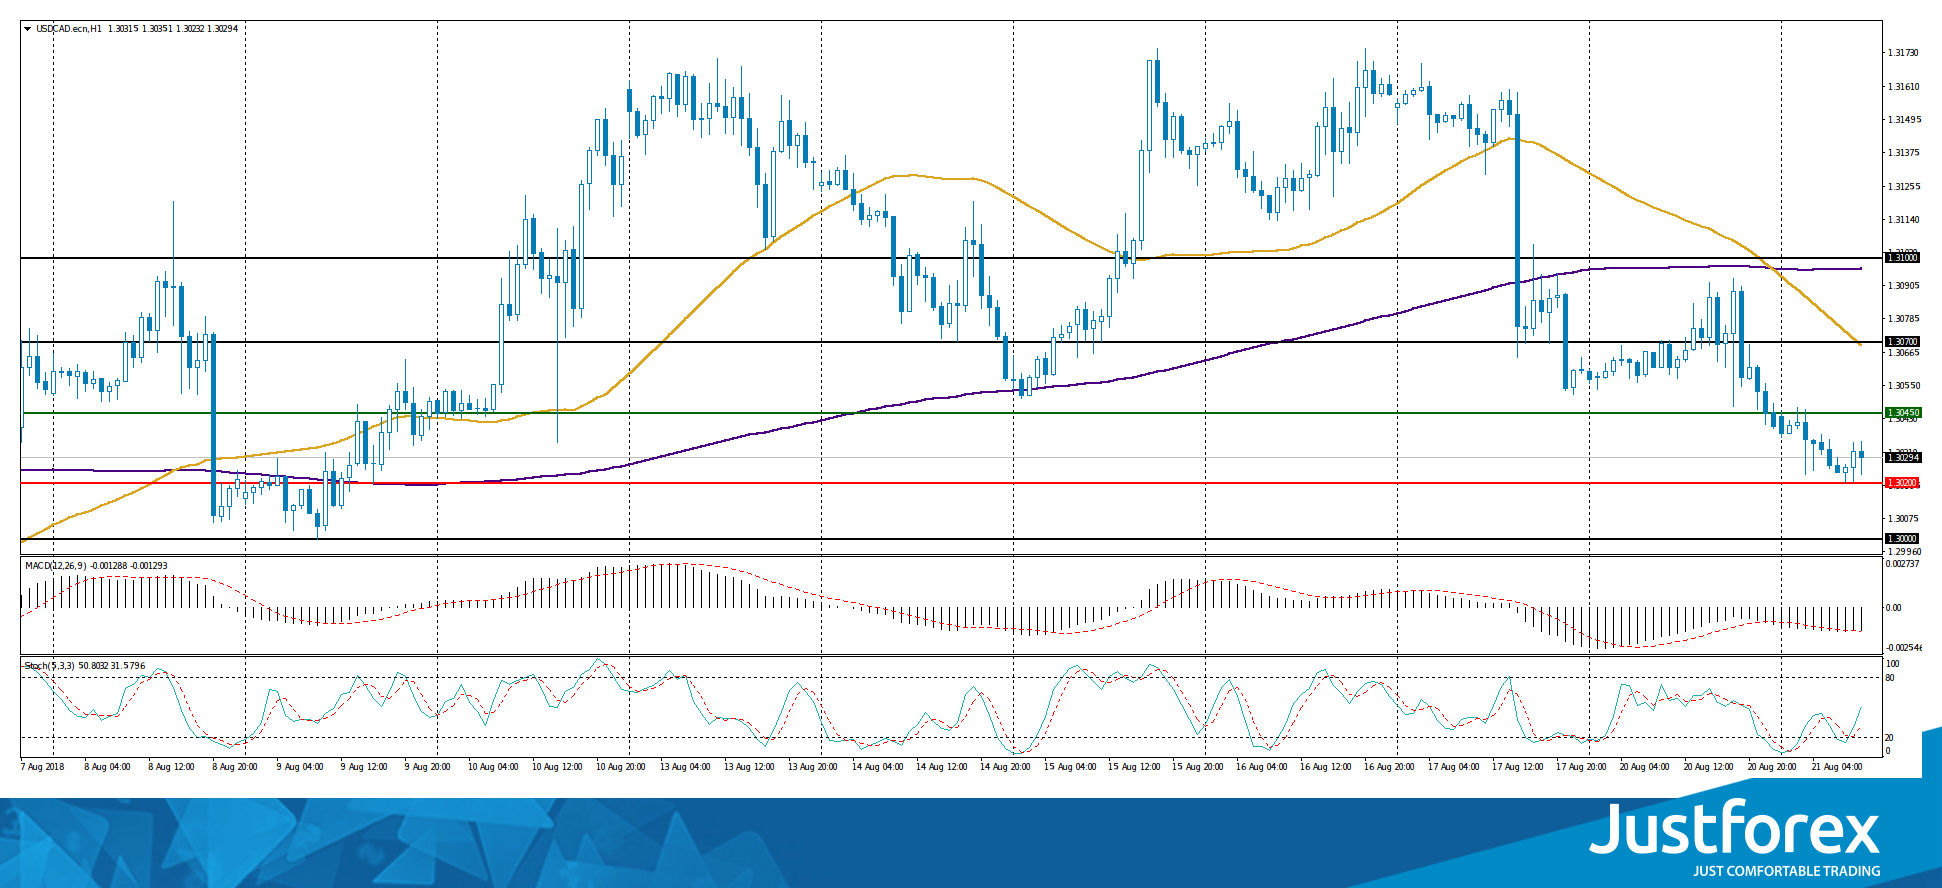
Indicators point to the power of sellers: the price has fixed below 50 MA and 200 MA.
The MACD histogram is in the negative zone, but above the signal line, which gives a weak signal to sell USD/CAD.
Stochastic Oscillator is located in the neutral zone, the %K line is above the %D line, which indicates the USD/CAD quotes growth.
Trading recommendations
Support levels: 1.30200, 1.30000
Resistance levels: 1.30450, 1.30700, 1.31000
If the price fixes below 1.30200, the USD/CAD quotes are expected to decline. The movement is tending to 1.30000-1.29700.
Alternative option. If the price fixes above the resistance of 1.30450, it is necessary to consider purchases of USD/CAD. The movement is tending to 1.30700-1.31000.
The USD/JPY currency pair
Technical indicators of the currency pair:
Prev Open: 110.593
Open: 110.063
% chg. over the last day: -0.48
Day`s range: 110.030 – 110.101
52 wk range: 104.56 – 114.74
Yesterday, the bearish sentiment prevailed on the USD/JPY currency pair. The decrease in quotes exceeded 80 points. At the moment, local support and resistance levels are 110.000 and 110.300, respectively. The positions should be opened from these marks. Financial market participants expect additional drivers. We recommend paying attention to the 10-year US government bonds yield.
The news feed on the economy of Japan is calm.
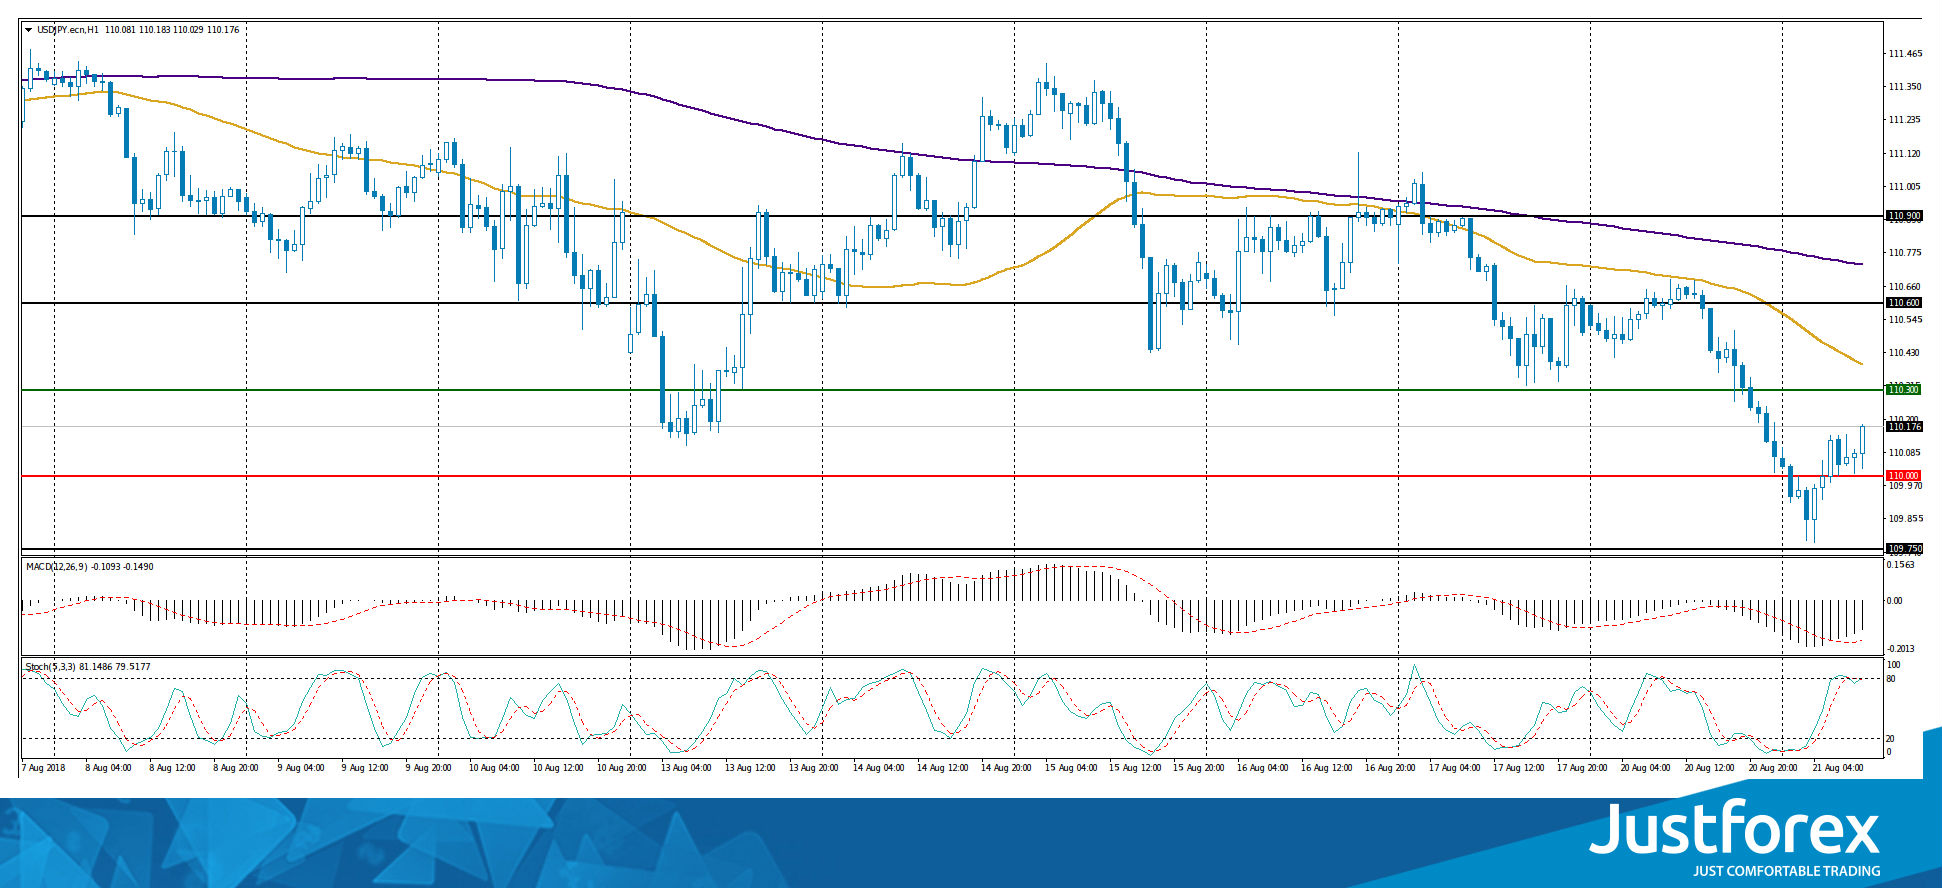
Indicators point to the power of sellers: the price has fixed below 50 MA and 200 MA.
The MACD histogram is in the negative zone, but above the signal line, which gives a weak signal to sell USD/JPY.
Stochastic Oscillator is located near the overbought zone, the %K line is crossing the %D line. There are no accurate signals.
Trading recommendations
Support levels: 110.000, 109.750
Resistance levels: 110.300, 110.600, 110.900
If the price fixes above the resistance level of 110.300, the growth of the USD/JPY currency pair is expected. The movement is tending to 110.600-110.800.
Alternative option. If the price fixes below the round level of 110.000, it is necessary to consider sales of USD/JPY. The movement is tending to 109.750-109.500.
The Dollar Index Is Declining
Yesterday, the US dollar weakened against the basket of major currencies. The dollar index (#DX) closed in the negative zone (-0.31%). The US dollar was under pressure after the US President Donald Trump criticized the Fed's policy once again. Trump is dissatisfied with the fact that the Fed Chairman, Jerome Powell, is aimed at a gradual increase in the interest rate. The president believes that the Fed should make greater contribution to the development and growth of the US economy. Today, the US currency has continued to lose ground.
At the moment, financial market participants expect negotiations between the US and China, which are likely to weaken the trade conflict. Also, negotiations between the EU and the UK regarding the future of Brexit should take place. We recommend following up-to-date news.
The "black gold" prices are moderately growing. At the moment, futures for the WTI crude oil are testing a mark of $65.50 per barrel. At 23:30 (GMT+3:00), a report on the API weekly crude oil stock will be published.
Market Indicators
Yesterday, there was a variety of trends in the US stock market: #SPY (+0.21%), #DIA (+0.36%), #QQQ (-0.09%).
At the moment, the 10-year US government bonds yield is at the level of 2.82%-2.83%.
The news feed on 2018.08.21:
Today, important economic data are not expected to be published.
WTI Crude Oil Futures Hover Near Upper Bollinger Band, Medium Term Bearish
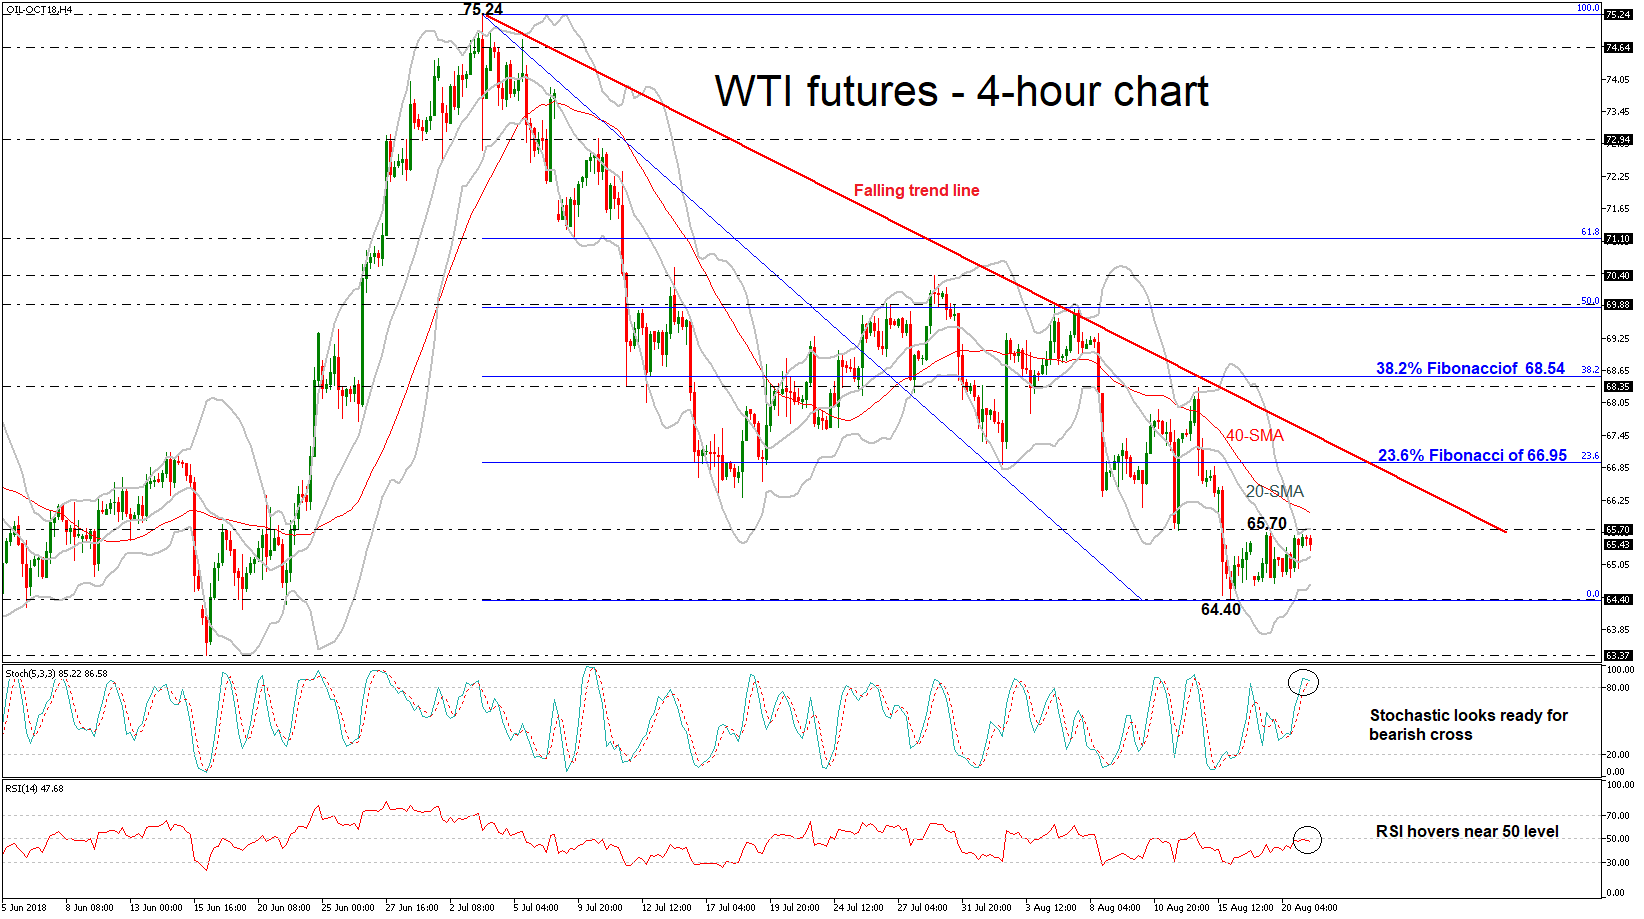
West Texas Intermediate (WTI) futures are developing below the 65.70 strong resistance area over the last four trading days but successfully surpassed the mid-level of the Bollinger band, this being a 20-period-simple moving average (SMA) in the 4-hour chart.
The RSI is hovering around the 50 neutral-perceived area, pointing to the absence of momentum in either direction in the short term, for the most part. Turning to the stochastics, it is of note that the green %K line is looking set to post a bearish crossover with the %D line, something which if indeed takes place would constitute a bearish signal in the very short term.
If the price shifts above the 65.70 resistance level, which overlaps with the upper Bollinger Band, it would challenge the 23.6% Fibonacci of the downleg from 75.24 to 64.40, near 66.95. A move above this level and traders could look for resistance at the 68.35 barrier, which stands slightly below the 38.2% Fibonacci mark.
Conversely, a decline could find support at the 20-SMA, around 65.22. If the bearish moves appear stronger, the price could hit the 64.40 support, identified by the August 16 trough. A failure to hold above this level could open the door for the 64.37 hurdle, taken from the low on June 18.
It is worth mentioning that oil prices have been moving within a descending movement since July 3 after they hit 75.24, their highest since late 2014
Canadian Retail Sales To Spur Speculation For Two More Rate Hikes In 2018?
Canada’s retail sales figures for June will be made public on Wednesday at 1230 GMT. The release is perhaps attracting additional attention in the aftermath of last week’s headline CPI beat out of Canada, which led to growing speculation for the delivery of two more rate hikes by the nation’s central bank in 2018.
After growing by 2.0% m/m in May, its strongest since October 2017, retail sales growth is anticipated at 0.1% in June, reflecting a considerable easing compared to the previously reported month. Core retail sales that exclude automobiles are projected to contract by 0.1%, after expanding by 1.4% m/m in May.
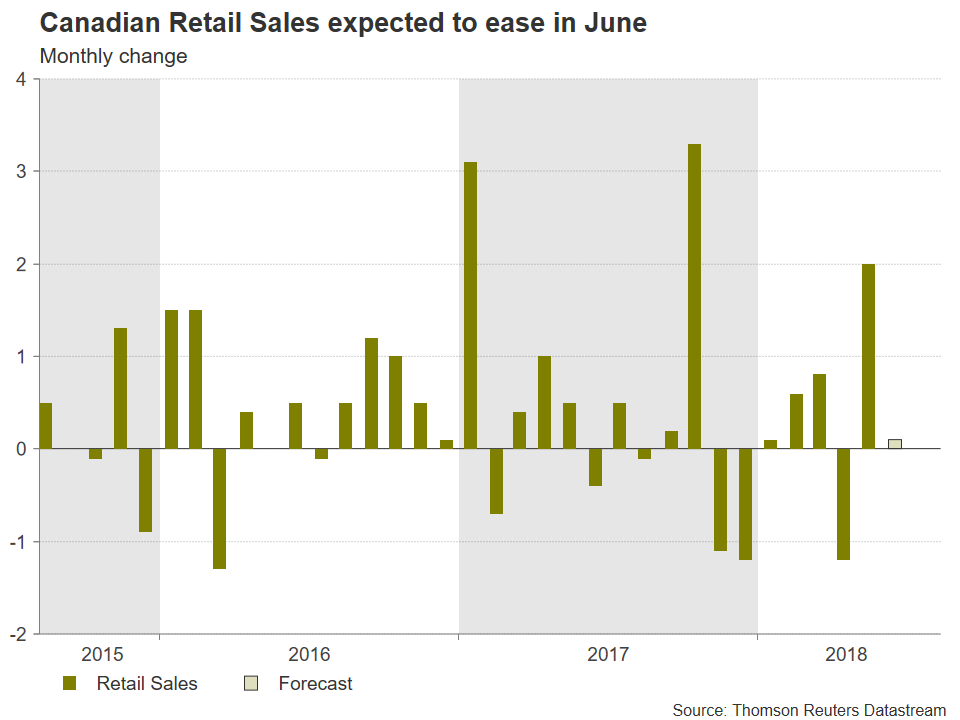
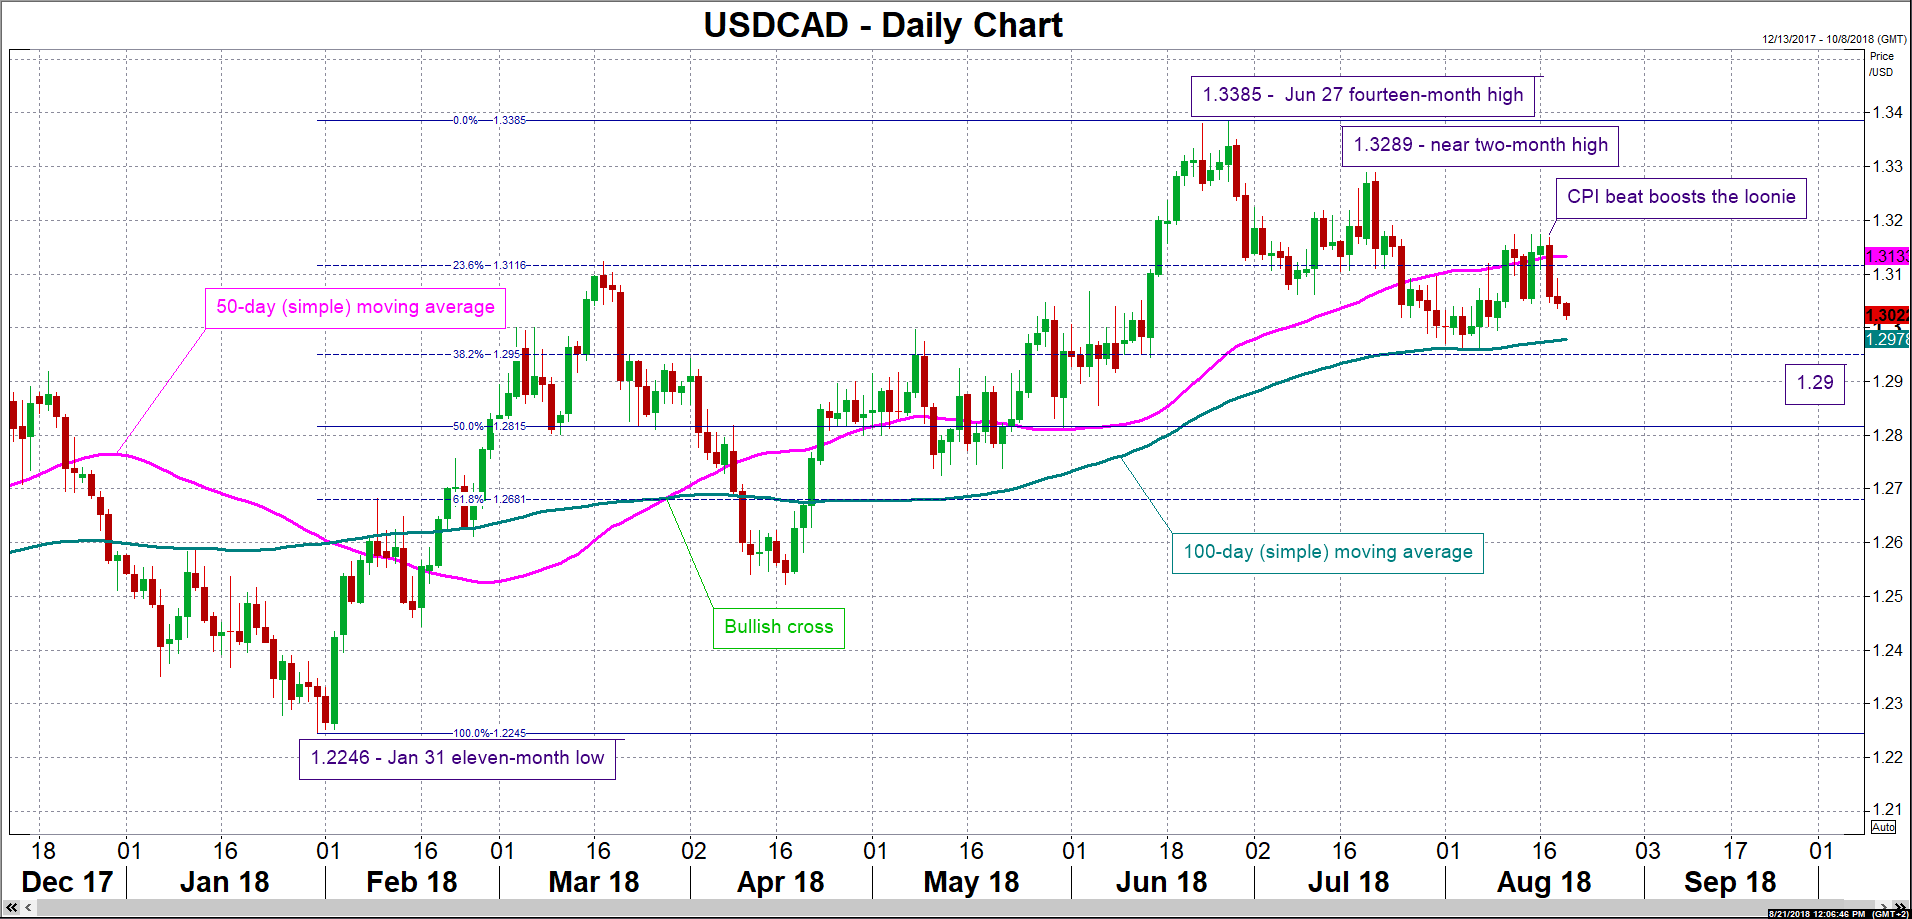
Upbeat retail sales, in combination with Friday’s headline inflation growing at its fastest since September 2011 on an annual basis, are likely to stoke expectations for two more 25bps rate increases by the Bank of Canada as the year unfolds, consequently boosting the loonie. Focusing on USDCAD, a weaker pair on the back of stronger-than-anticipated prints on Wednesday may meet support around the current level of the 100-day moving average line at 1.2978. The area around this point managed to hold during late July and early August, while it also encapsulates the 1.30 round figure, as well as the 38.2% Fibonacci retracement level of the January 31 to June 27 upleg at 1.2950. Further below, the 1.29 handle would come in focus.
Conversely, weaker-than-expected readings out of Canada will probably lead to a stronger dollar/loonie. Immediate resistance to an advancing pair may occur around the 23.6% Fibonacci mark at 1.3116; the region around this includes 1.31 and the 50-day MA at 1.3133. Steeper gains would bring into scope the 1.32 level.
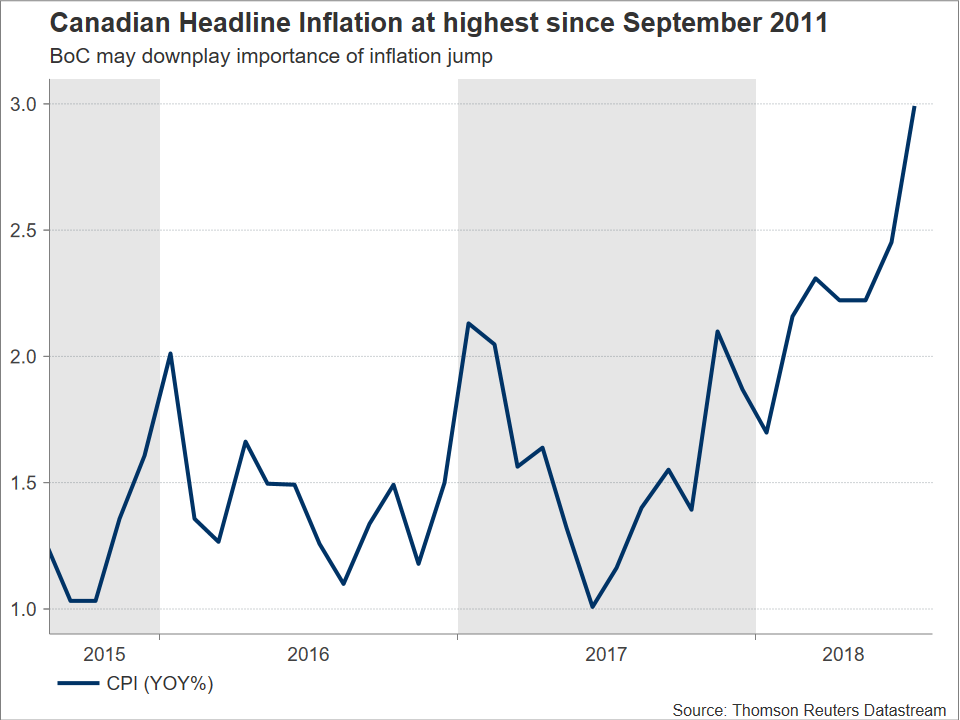
Friday’s release showed headline CPI growing by 3.0% annually, outstripping forecasts of 2.5% and touching the upper bound of the BoC’s target inflation range of 1-3%. As a result, market participants have now fully priced in an additional quarter percentage point interest rate increase by the Canadian central bank in 2018 – before last week’s data this wasn’t fully discounted –, while they assign a 30% chance for one more such move during the year, according to Canadian overnight index swaps. For the record, the BoC will next be deciding on rates on September 5, with market participants seeing a 48% probability for a hike during that meeting at the time of writing.
However, it should also be stressed that investors may be running ahead of themselves, given that energy prices contributed the most to the higher inflation rate in July. Relating to this, two of the three core measures of inflation monitored by the BoC remained unchanged, while the third (CPI trim) ticked up to 2.1% y/y from 2.0%. Overall, the BoC may thus downplay the significance of the headline CPI beat when it next meets to set monetary policy, with such an outcome expected to hurt the local dollar.
Lastly, other loonie-drivers remaining in the background are the direction of oil prices, as well as how NAFTA negotiations will play out. Regarding the former, it is notable that WTI has retreated over the past seven weeks. Rising worries of emerging markets coming under pressure may further weigh on oil prices, as well as other commodities Canada exports to such markets, subsequently acting as a drag on the loonie. On the NAFTA front, Canada has been isolated from talks in recent weeks, with the Trump administration attempting to secure a deal with Mexico; an end-of-month self-imposed deadline is in place. Should a deal be achieved and Canada invited back to talks, then the loonie may enjoy a relief rally. On the other hand, the absence of a deal between the US and Mexico, or nevertheless continuing tensions on this front between the US and Canada, are likely to lead to losses in the loonie.
Trump Comments Weigh On Dollar, Brexit Updates Eyed
Here are the latest developments in global markets:
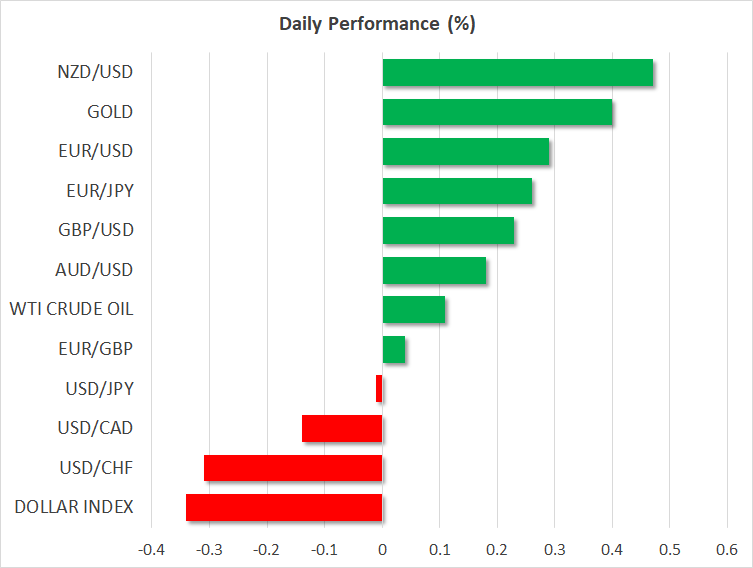
FOREX: The dollar was losing ground against six major currencies on Tuesday, building on yesterday’s losses after some overnight comments by US President Trump; he expressed displeasure with the Fed raising interest rates
STOCKS: The Dow Jones finished Monday’s trading up by 0.35%, while the S&P 500 and Nasdaq Composite edged higher by a bit more than 0.2% and slightly less than 0.1% correspondingly. In Asian markets, the Japanese Nikkei 225 added 0.1% and the broader Topix index lost 0.4%. Hong Kong’s Hang Seng was up by 0.3%. At 0704 GMT, futures markets were pointing to a lower open for major European benchmarks, while contracts on the Dow, S&P and Nasdaq 100 were all close to flat.
COMMODITIES: WTI was up 0.1%, trading around $66.50 per barrel, while Brent crude was lower by the same proportion at $72.10/barrel. Weekly API data on US crude stocks due at 2030 GMT may provide short-term direction to oil prices. In precious metals, gold was higher by 0.4% at $1,194.40 an ounce, gaining on the back of a softer dollar and further distancing itself from its lowest since January 2017 of $1,159.96/ounce hit last week
Major movers: Dollar broadly weaker as Trump criticizes higher-rates policy; Brexit in focus for sterling
The dollar’s index, which gauges the greenback versus a basket of counterparts, was heading lower for the fifth straight day, having touched 95.44, its lowest since August 9 earlier on Tuesday. Its losses yesterday were exacerbated after President Trump said in a Reuters interview that he was “not thrilled” with Fed chief Powell raising interest rates. Moreover, he said that he “should be given some help by the Fed” in propping the economy, while adding that he’ll criticize the central bank if it continues hiking rates.
The greenback was already heavier against major peers on Monday as seemingly easing tensions between the US and China on trade – given that the two will be getting into low-level talks this week that may pave the way for high-level discussions – did not divert safe-haven flows into the currency. Trump’s comments, though, acted as the catalyst for sharper losses.
China and Europe were on the receiving end of fire by Trump, who again said they were manipulating their currencies. Broad dollar weakness helped the euro, which was on its fifth consecutive up-day, trading 0.3% higher on Tuesday and piercing through the $1.15 handle; at its peak for the day, euro/dollar hit 1.1543, its highest since August 9. The offshore yuan was not much changed against the US currency after pulling away from its weakest since January 2017 in the previous days.
Dollar/yen was close to flat and marginally above the 110 round figure, after previously falling below it to record a near two-month low of 109.76. Pound/dollar traded 0.2% higher and not far below its highest in nearly two-weeks of 1.2833. Sterling has in the past and is likely to again prove sensitive to Brexit negotiations taking place on Tuesday and Wednesday; UK Brexit Secretary Raab will be meeting EU’s Barnier later today.
The commodity-linked loonie, kiwi and aussie were all higher versus the dollar. Relating to the latter, RBA minutes pertaining to its meeting earlier in August were relatively dovish, while the currency was also fairly resilient to political uncertainty in Australia; Prime Minister Malcolm Turnbull survived a leadership vote with a very narrow margin. As regards the kiwi, which is outperforming – kiwi/dollar is up by around 0.5% –, analysts said the market was very short on the NZD and susceptible to being squeezed out of those positions.
Elsewhere, the closely watched – as of late – Turkish lira continued losing ground versus the dollar despite broad greenback weakness.
Lastly, also dollar-negative on Monday were comments by Atlanta Fed President Raphael Bostic – a voting FOMC member in 2018 – who supported one more rate increase by the Fed in 2018, rather than two, while expressing concerns over risks from trade.

Day ahead: US-Chinese trade talks & Brexit in the forefront; Turkish political turmoil continues
A few economic releases are on the calendar on Tuesday. However, once again, any trade or political update could be of most interest as investors are eagerly awaiting the outcome of the US-Sino trade talks this week, while the Turkish-related turmoil remains in the background as well.
Chinese officials are expected to meet their US counterparts in Washington on Wednesday and Thursday, marking the first official meeting since June’s gathering which secured no agreement. This time, discussions will take place just before US tariffs on $16 billion Chinese imports take effect, with China expected to retaliate in similar fashion; market participants are hoping for the talks to de-escalate tensions. However, since the negotiators are said to be low-level officials, the meetings may not provide much.
Developments relating to Turkey are anticipated to attract attention as well, as the US refuses to back down its standoff with the country over the detention of a US pastor, with President Trump saying yesterday that “there will be no concessions” on this matter. The Turkish President also showed no sign of giving in the previous days and it would be interesting to see how long the dispute could last, as well as whether it would intensify further. Besides the Turkish lira, the euro will be in focus as well given worries that any economic deterioration in Turkey could negatively affect the Eurozone’s banking sector and thus act as a drag on the common currency.
In the meantime and also of importance, the Brexit Secretary, Dominic Raab, will be traveling to Brussels today, where he will hold the latest Brexit talks with his EU counterpart, Michel Barnier, later today. While the scenario of a no-deal Brexit is looking more and more probable, Raab expressed that an agreement is still the most likely outcome.
In terms of releases, the Confederation of British Industry’s data on factory growth are due at 1000 GMT, while Canadian wholesale trade numbers will be hitting the markets at 1230 GMT. Meanwhile, the outcome of today’s bi-weekly milk auction could dictate short-term positioning on the kiwi; dairy products are New Zealand’s largest goods export earner, with higher prices generally seen as kiwi-positive. The auction figures lack a specific time of release.
Technical Analysis: USDJPY rebounds from 2-month lows but negative risks remain
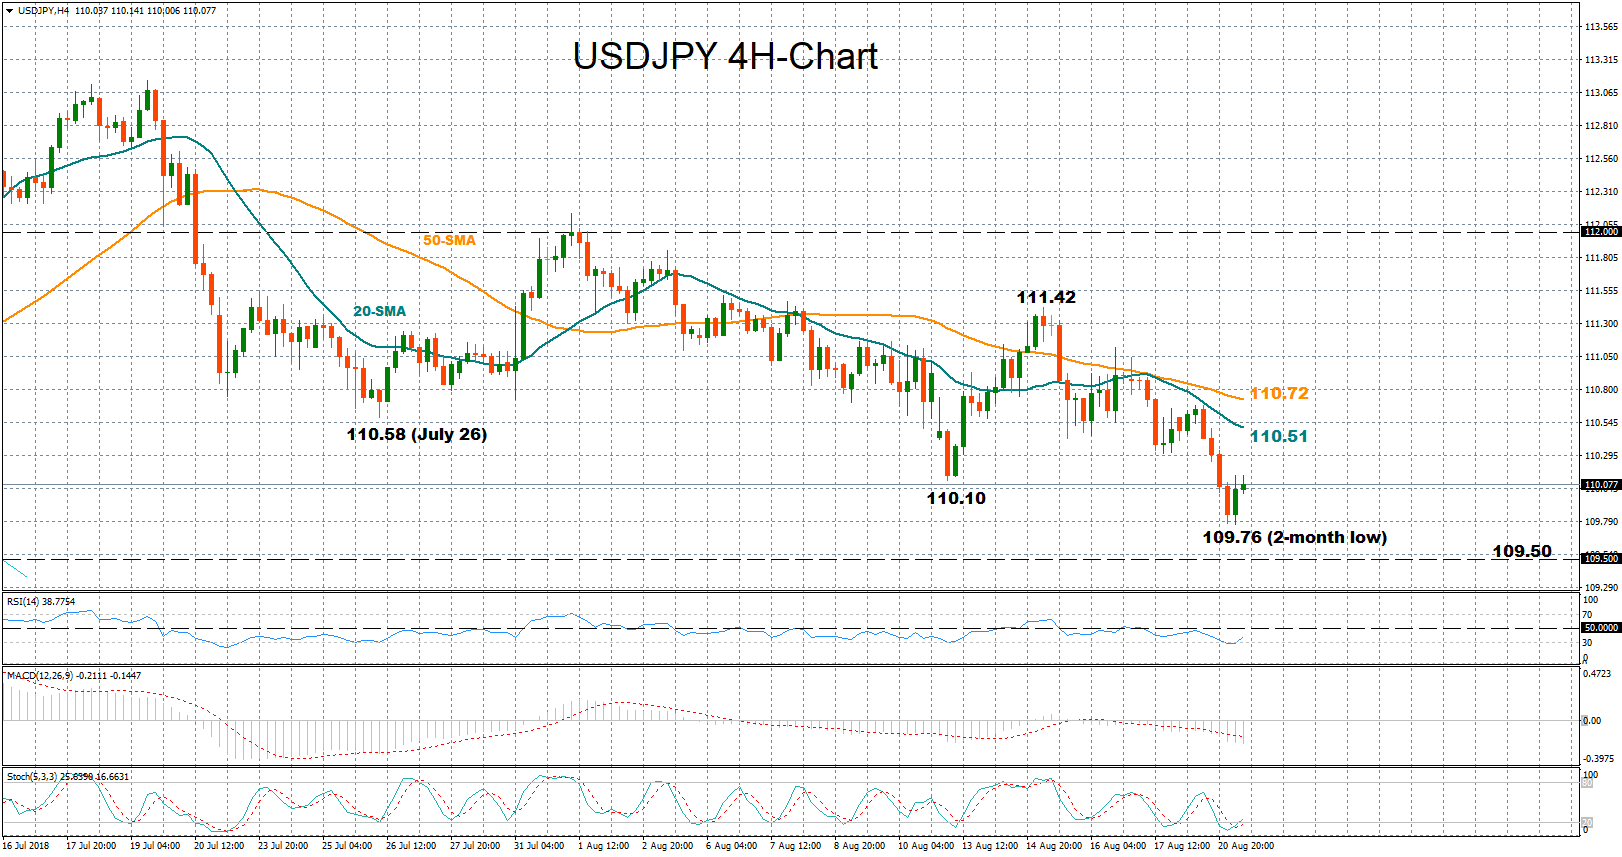
USDJPY extended losses towards an almost two-month low of 109.76 today after breaking the previous low of 110.10 printed on August 13. Both the RSI and the stochastics are attempting a rebound on the four-hour chart which may constitute a sign that the bearish momentum is fading. Also notable and relating to the latter, the %K line moved above the slow %D one, this being a bullish sign in the very short-term. However, it should also be kept in mind that the MACD continues to move in negative territory and below its red signal line.
Should political and trade risks intensify, shifting funds to the safe-haven yen, the pair could revisit the bottom created at 109.76, while a sharper decline could also send the market down to 109.50, a frequently tested area between April and June. Even lower, the door could open for the 109.00 round figure. Still, it is worth mentioning that the dollar has been acting as a safe-haven as well in previous days.
Conversely, easing tensions could push USDJPY back above 110.10, with scope to retest the area between 110.30 and 110.60, formed by the lows on July 26 and August 17. A leg higher could overcome the 20-period SMA and target the 50-period SMA at 110.72.