

Sample Category Title
Crude Oil: Oil Trading Higher Ahead Of API’s Weekly Crude Oil Inventories Data
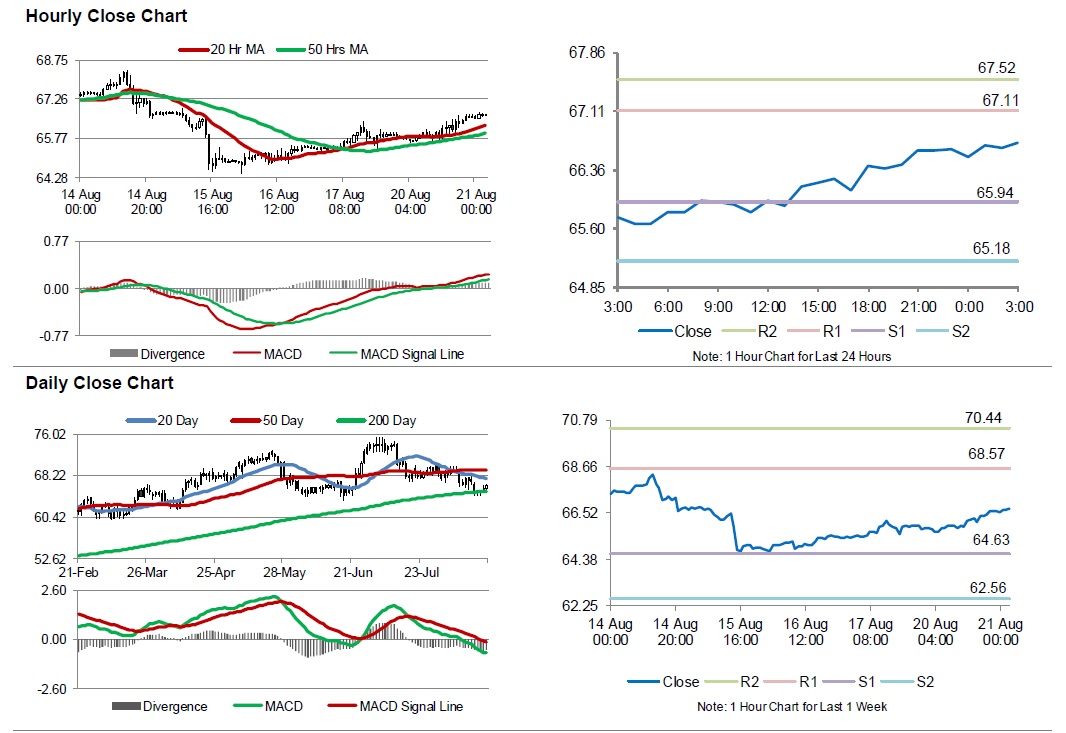
For the 24 hours to 23:00 GMT, Crude Oil rose 1.23% against the USD and closed at USD66.62 per barrel, as the US sanctions on Iran led to concerns of tighter global oil supplies and amid easing trade war tensions between the US and China.
In the Asian session, at GMT0300, the pair is trading at 66.70, with oil trading 0.12% higher against the USD from yesterday's close, amid a weaker US dollar.
The pair is expected to find support at 65.94, and a fall through could take it to the next support level of 65.18. The pair is expected to find its first resistance at 67.11, and a rise through could take it to the next resistance level of 67.52.
Moving ahead, investors will closely watch the weekly crude oil inventories data from the American Petroleum Institute (API) due later today.
Crude oil is trading above its 20 Hr and 50 Hr moving averages.
AUD/USD Targets Lower Pivot Zone
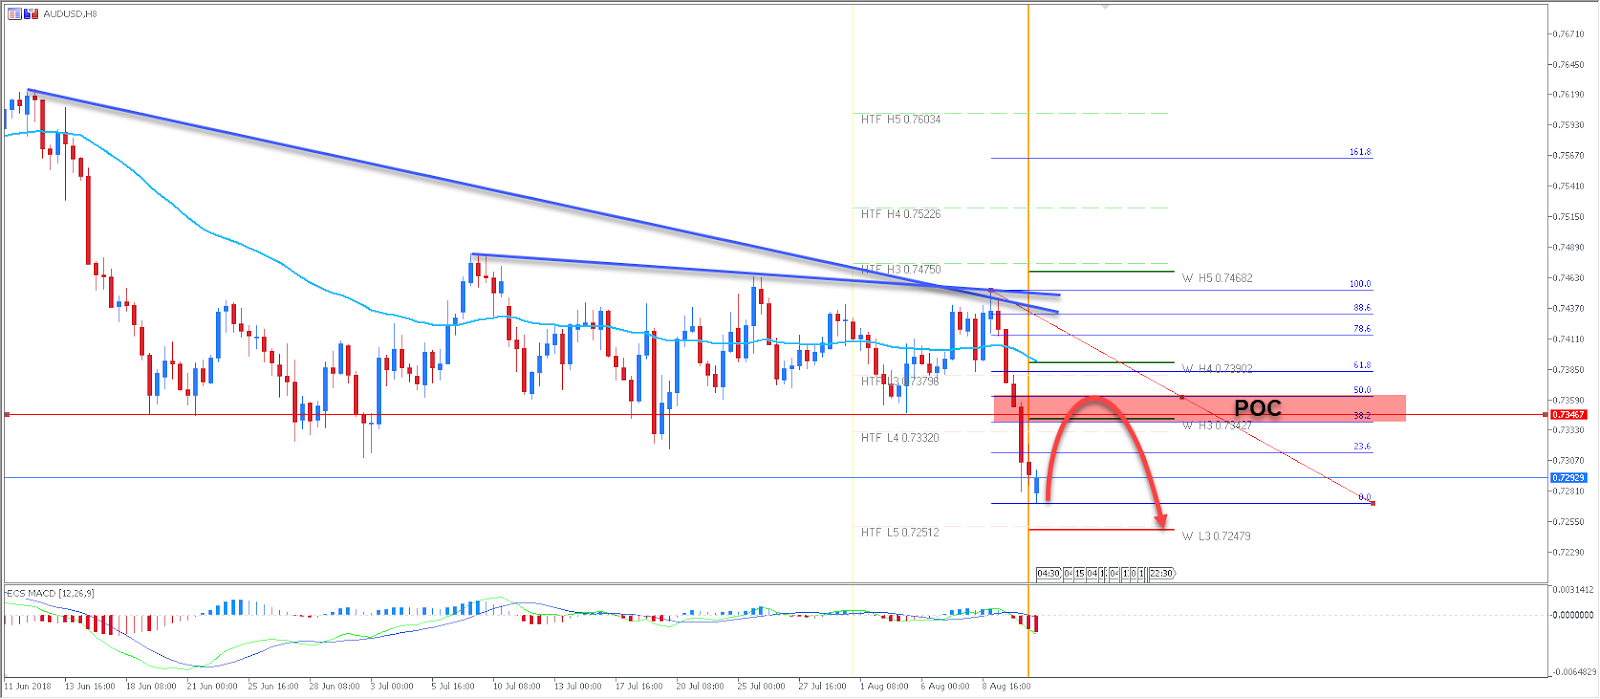
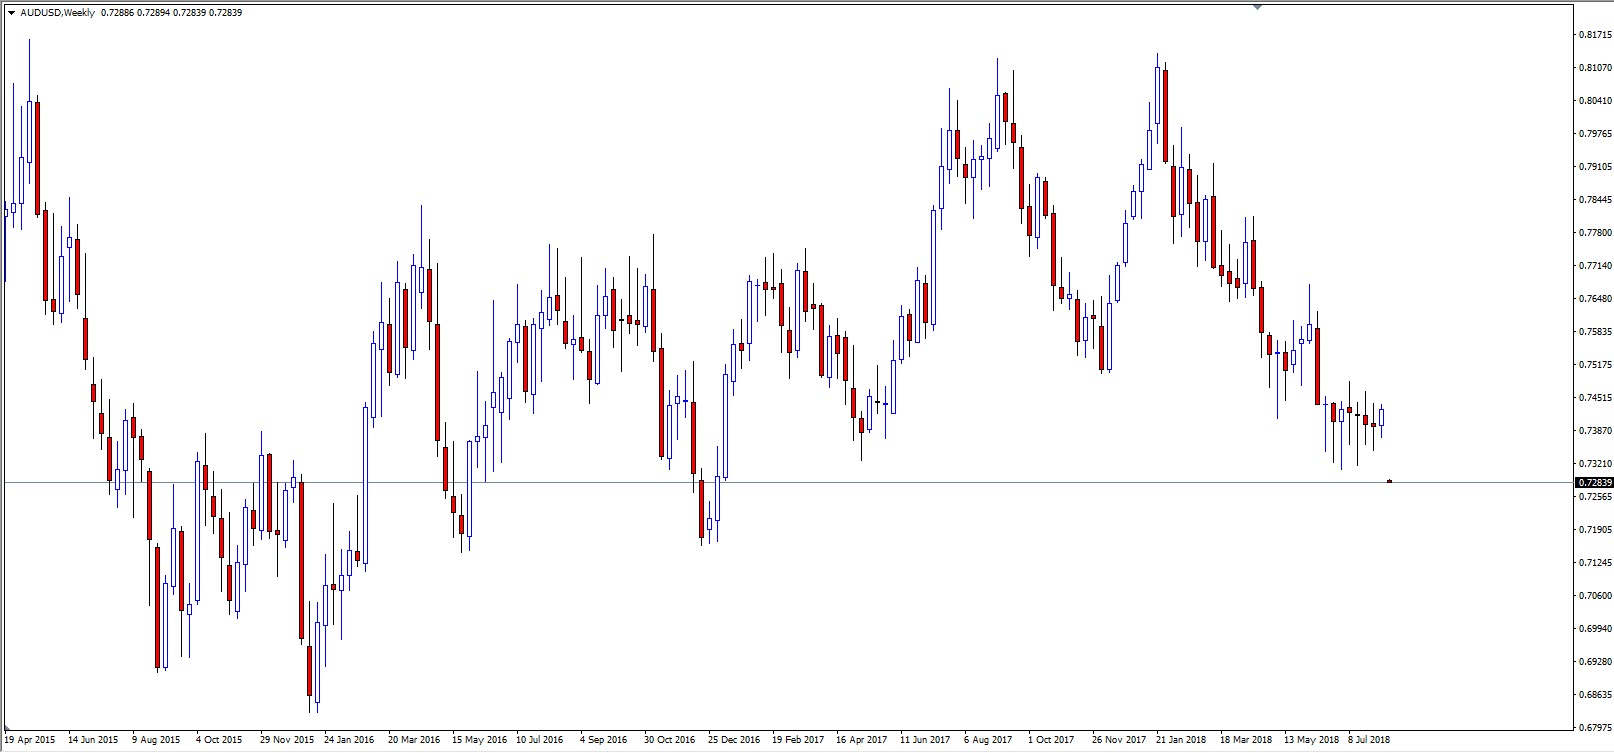
The AUD/USD is strongly bearish and the trend should continue. The break of important order block has marked the continuation of a downtrend. A retest of 0.7345-60 could be a new chance for bears to initiate fresh selling. We can see a lot of confluence there, including order block and 38.2 fib retracement exactly at the camarilla pivot. The next target for AUD/USD is 0.7250.
W L3 - Weekly Camarilla Pivot (Weekly Interim Support)
W H3 - Weekly Camarilla Pivot (Weekly Interim Resistance)
W H4 - Weekly Camarilla Pivot (Strong Weekly Resistance)
D H4 - Daily Camarilla Pivot (Very Strong Daily Resistance)
D L3 – Daily Camarilla Pivot (Daily Support)
D L4 – Daily H4 Camarilla (Very Strong Daily Support)
POC - Point Of Confluence (The zone where we expect price to react aka entry zone)
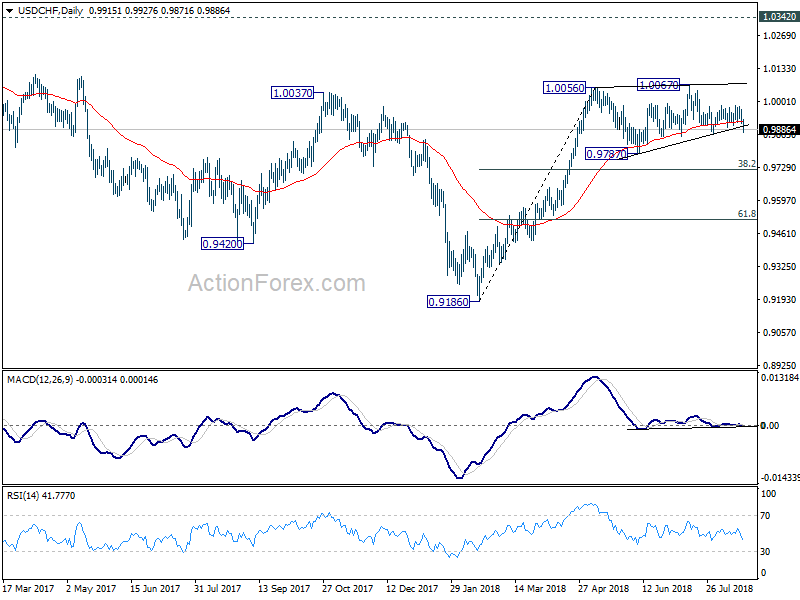
USD/CHF Daily Outlook
Daily Pivots: (S1) 0.9892; (P) 0.9930; (R1) 0.9952; More....
USD/CHF's sharp decline and strong break of 0.9894 support suggests that fall from 1.0067 is resuming. Intraday bias is back on the downside for 0.9866 first. Break will extend the fall from 1.0067 to 0.9787 support and possibly below. Price actions from 1.0056 are seen as a corrective pattern from fall from 1.0067 as the third leg. Hence, we'd expect strong support from 38.2% retracement of 0.9186 to 1.0056 at 0.9724 to bring rebound.
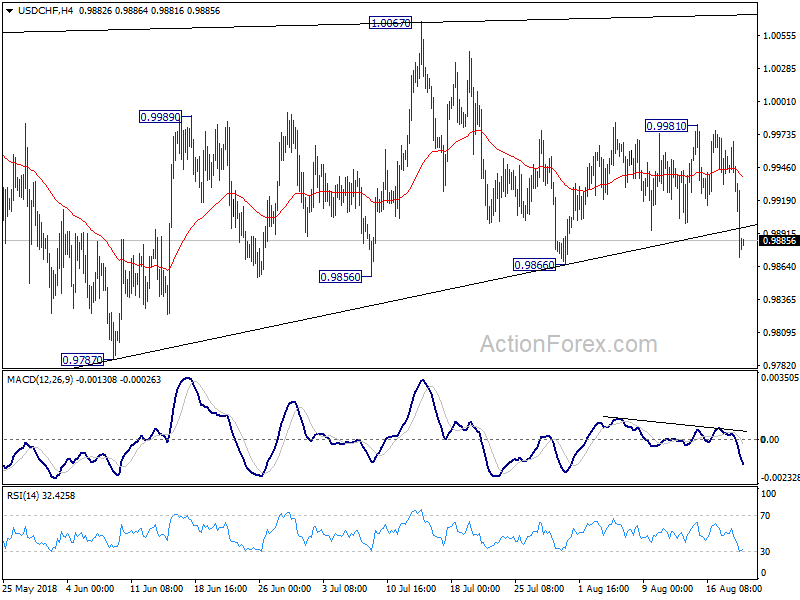
In the bigger picture, current development suggests that the consolidation pattern from 1.0056 is extending. As long as 38.2% retracement of 0.9186 to 1.0056 at 0.9724 holds, we'd expect rise from 0.9186 to resume at a later stage to retest 1.0342 key resistance (2016 high). However, sustained break of 0.9724 fibonacci level will bring deeper fall, as another declining leg in the long term range pattern.
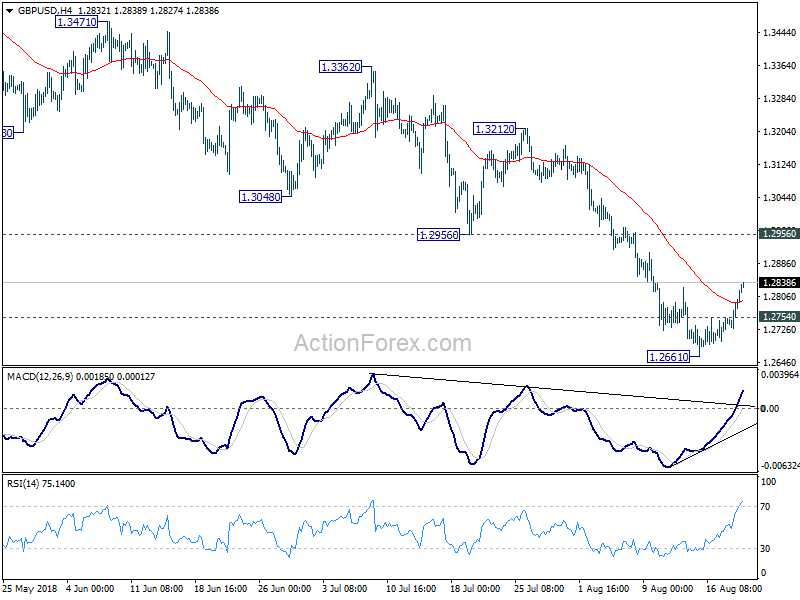
GBP/USD Daily Outlook
Daily Pivots: (S1) 1.2750; (P) 1.2775; (R1) 1.2821; More...
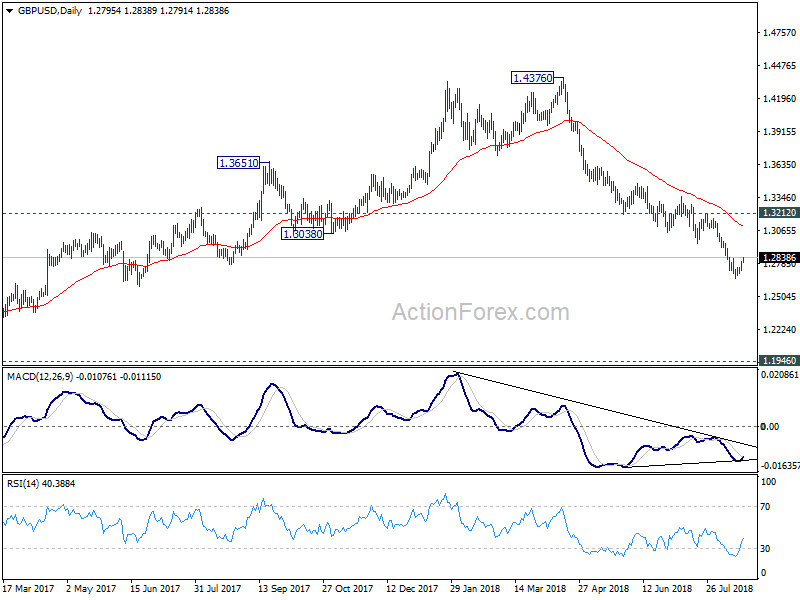
GBP/USD rebounds to as high as 1.2837 so far today. Break of 1.2826 minor resistance confirm short term bottoming at 1.2661. Intraday bias is now on the upside for stronger rebound to 1.2956 support turned resistance. But upside should be limited there to bring fall resumption. On the downside, below 1.2754 minor support will bring retest of 1.2661 low first.
In the bigger picture, whole medium term rebound from 1.1946 (2016 low) should have completed at 1.4376 already, after rejection from 55 month EMA (now at 1.4091). Current downside acceleration argues that it's possibly resuming long term down trend. In any case, outlook will stay bearish as long as 1.3212 resistance holds. Retest of 1.1946 should be seen next.
EUR/USD Daily Outlook
Daily Pivots: (S1) 1.1425; (P) 1.1455 (R1) 1.1516; More.....
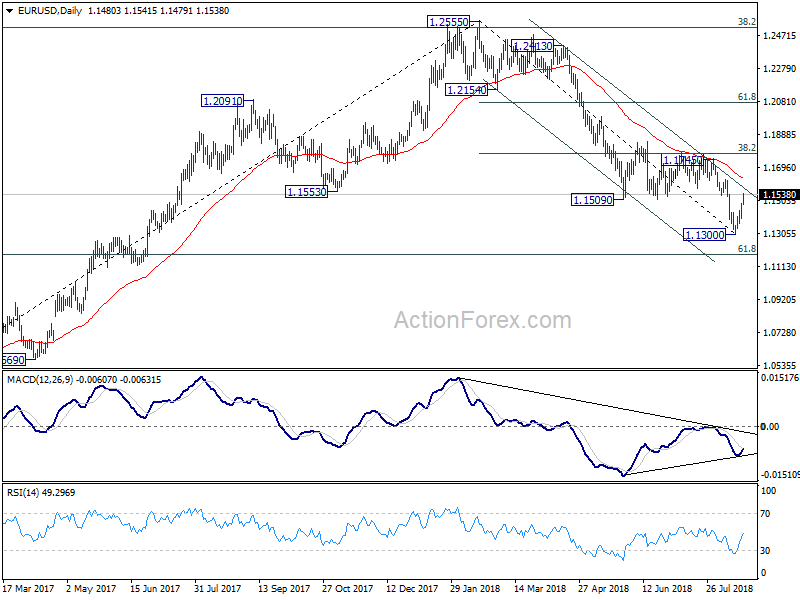
EUR/USD's rebound from 1.1300 short term bottom is still in progress. 1.1509 support turned resistance was met but there is no sign of topping yet. Intraday bias remains on the upside for 1.1745. We'd expect strong resistance from there to limit upside. On the downside, break of 1.1444 minor support will suggests that the rebound is completed. Intraday bias would be turned back to the downside for retesting 1.1300 low.
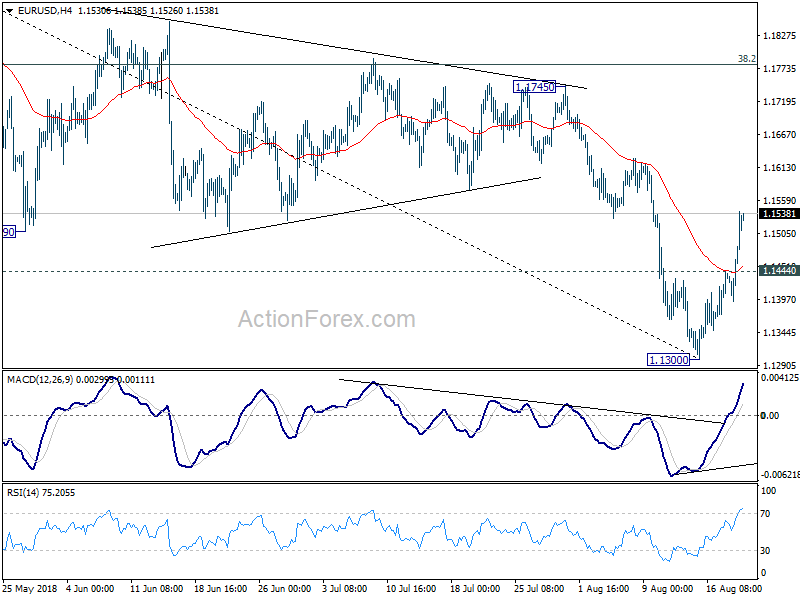
In the bigger picture, the down trend from 1.2555 medium term is in progress for 61.8% retracement of 1.0339 to 1.2555 at 1.1186. Note again that EUR/USD was rejected by 38.2% retracement of 1.6039 (2008 high) to 1.0339 (2017 low) at 1.2516. That carries some long term bearish implications. Sustained break of 1.1186 could pave the way back to retest 1.0339 low. For now, outlook will remain bearish as long as 38.2% retracement of 1.2555 to 1.1300 at 1.1779 holds, even in case of strong rebound.
Jackson Hole Symposium Preview: Two Questions on Fed’s Monetary Policy
While it is not a practice for Fed chairs to offer hints on the monetary policy outlook at the annual Jackson Hole symposium, their speeches at the event have always caught market attentions and sometimes move the market. At the upcoming meeting on August 23-28, Fed Chair Jerome Powell would be speaking on the topic “Changing Market Structure and Implications for Monetary Policy”. We expect his speech would focus on the more technical mechanism of the monetary policy implementation. Yet, we find two areas that might still trigger market volatility.
- Early End of Balance Sheet Reduction?
The Fed, as it announced the plan to trim its US$ 4.5 trillion-worth balance sheet in October 2017, did not indicate the targeted final size of the balance sheet. However, as some members signaled at that time, the preferred size would be about US$ 2.5-3 trillion. Powell, as he testified before the Committee on Banking, Housing, and Urban Affairs for his nomination back in November, also suggested a similar amount. The process should take 3-4 years to complete.
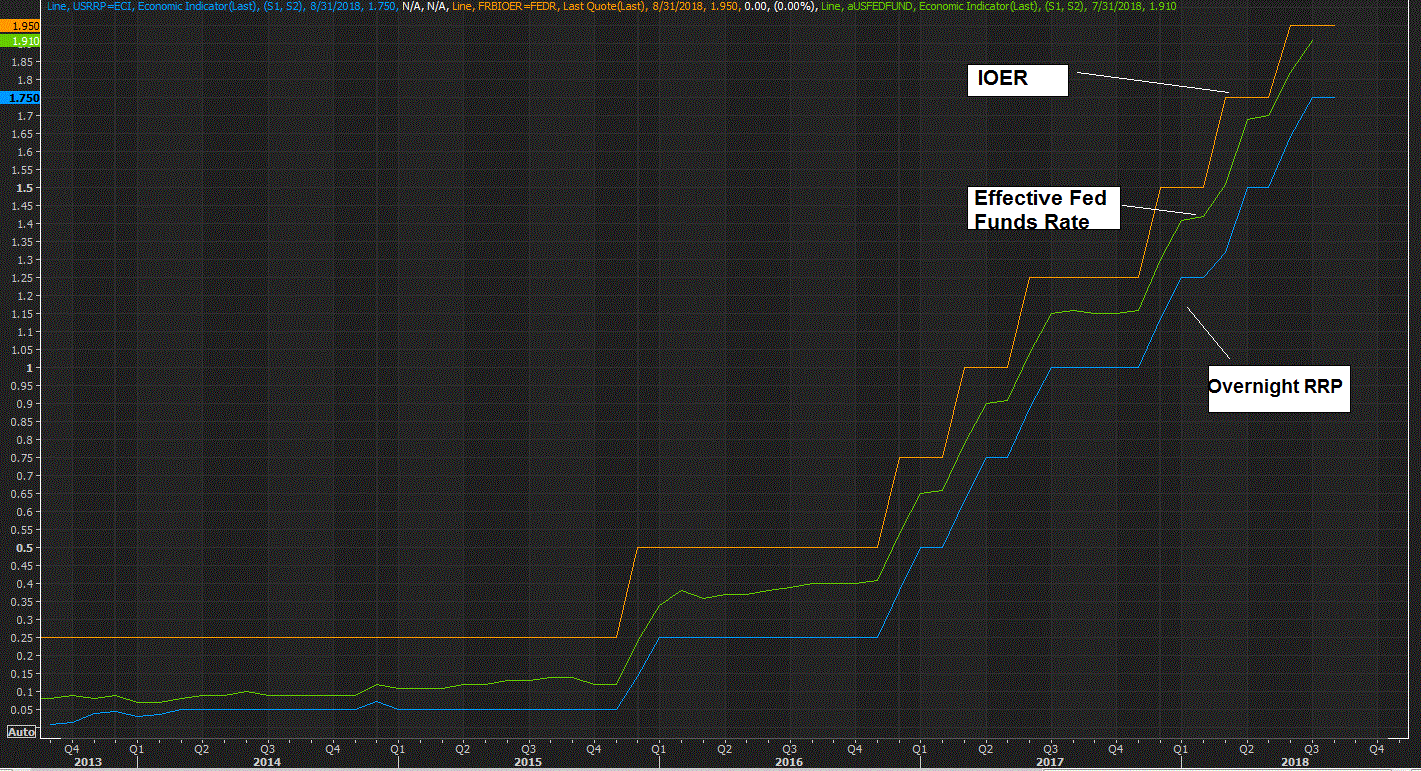
Speculations that the reduction could end in as soon as next year heightened as Powell noted at the semi-annual testimony to Congress last month that the Fed would take up the question about the size of its balance sheet "fairly soon". While higher effective Fed funds rate resulting from balance sheet reduction (lower Fed reserve) is anticipated, any hint of early completion of balance sheet reduction would be very dovish and should cause US dollar to fall. Also, larger System Open Market Account (SOMA) Treasury holding by the Fed means less T-bill issuance in the future. This could result in the decline in short-term yields, giving a relief to the flattening of yield curve.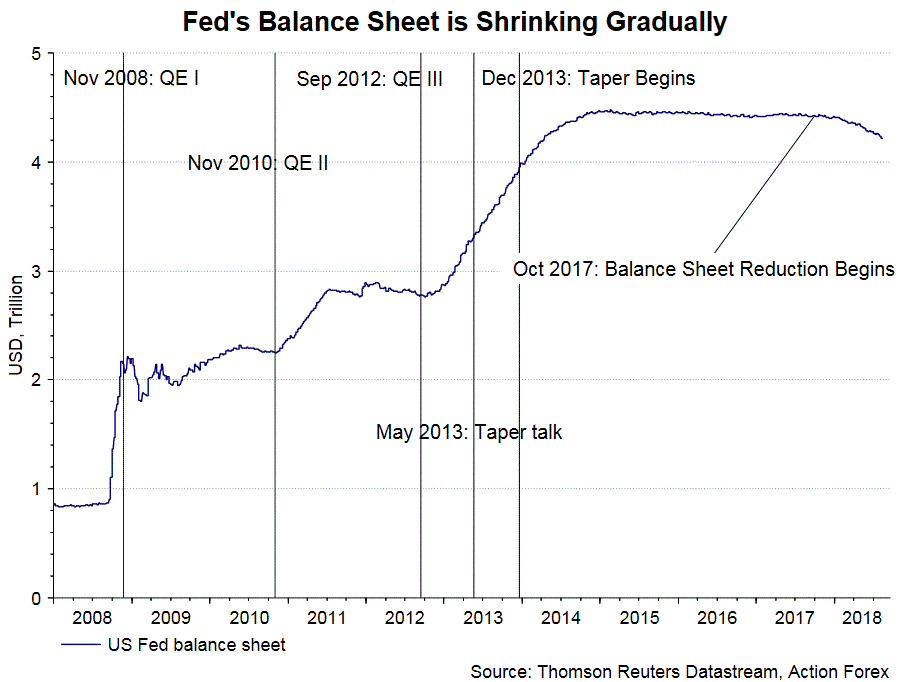
2. Return to Pre-Crisis Channel System Monetary Policy?
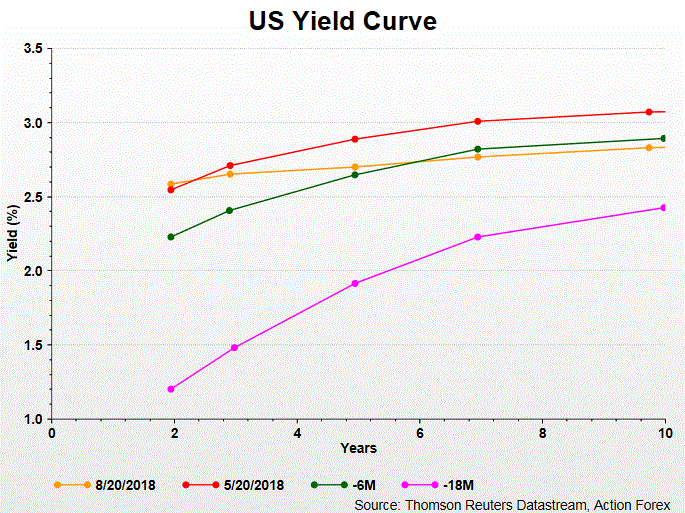
Prior to the 2007-08 global financial crisis prior, the Fed conducted monetary policy using a so-call a channel system. While the discount rate and the interest rate on excess reserve (IOER) as the upper and lower limits, respectively, the Fed funds rate was targeted in between.
Such mechanism has been changed since October 2008, as the Fed began paying interest on excess reserve. The move was adopted to accommodate the abundant reserve. Meanwhile, the Fed introduced the overnight reverse report rate (ON RRP), which is lower than IOER. Indeed, both IOER and ON RRP are rates at which financial institutions lend to the Fed. The difference is that the Fed puts up securities as collateral for the latter. For the10 years since then, the Fed’s policy rate – the Fed funds rate is announced as a target range, with upper and lower bounds given by the IOER and the ON-RRP rate, respectively.
As New York Fed President William Dudley suggested, the major difference between the corridor and the floor system is as follows: “In a corridor system, reserves in the banking system are scarce, and the Fed funds rate is set by adjusting the supply of reserves through open market operations to balance demand and supply at the FOMC's target range. In contrast, in a floor system, reserves are abundant, so that the interest rate the Fed pays on excess reserves, or IOER, is the primary tool used to control the federal funds rate. As Fed is trimming its balance sheet, the reserve is prone to be significantly lower than the level years ago. Some have raised that a return to channel system might be considered. Powell might comment on this area but we expect the Fed should maintain the current system for some time. Currently, how much the Fed would reduce its balance sheet (point 1) would also affect whether and when to adjust the system.
Powell is unlikely offer more indications on the future rate hike path than what had been discussed in the June and August meetings. The Fed is set to raise the policy rate by +25 bps in September, followed by another in December. There would likely be another 4 hikes in 2019.
AUD/USD Daily Outlook
Daily Pivots: (S1) 0.7309; (P) 0.7326; (R1) 0.7358; More...
AUD/USD's rebound from 0.7201 short term bottom extends to as high as 0.7358 so far today. 0.7346 support turned resistance is broken without sign of topping yet. Intraday bias stays on the upside for 0.7452 key resistance next. On the downside, below 0.7295 minor support will argue that the rebound is finished and turn bias back to the downside.
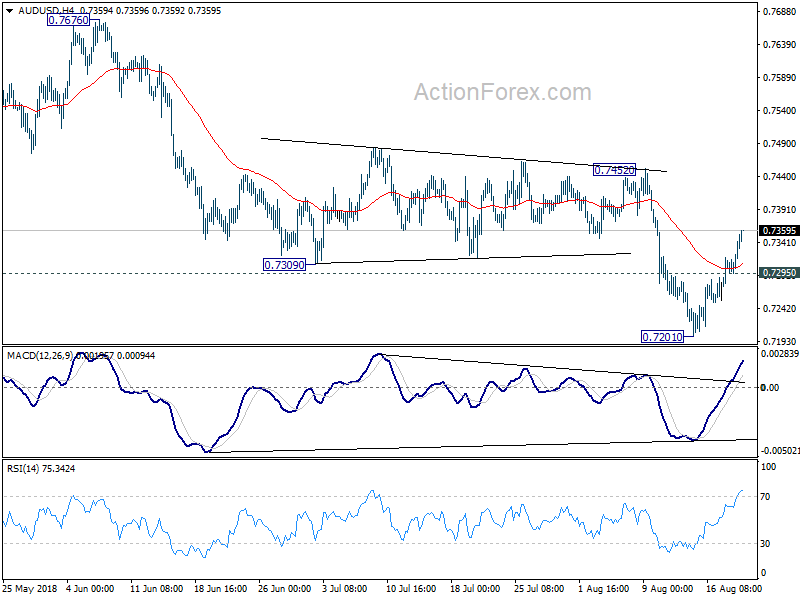
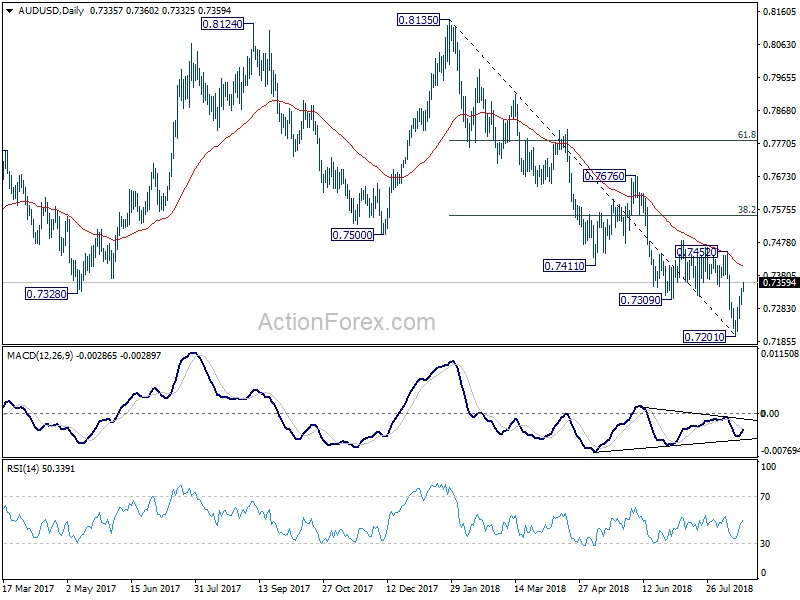
In the bigger picture, rebound from 0.6826 (2016 low) is seen as a corrective move that should be completed at 0.8135. Fall from there would extend to have a test on 0.6826. There is prospect of resuming long term down trend from 1.1079 (2011 high). But we'll look at downside momentum to assess at a later stage. On the upside, break of 0.7452 resistance, however, will indicate medium term bottoming, on bullish convergence condition in daily MACD. In that case, a correction should be seen first, with stronger rebound would be seen to 38.2% retracement of 0.8135 to 0.7201 at 0.7558. The down trend from 0.8135 will resume after the correction completes.
USD/CAD Daily Outlook
Daily Pivots: (S1) 1.3022; (P) 1.3058; (R1) 1.3076; More...
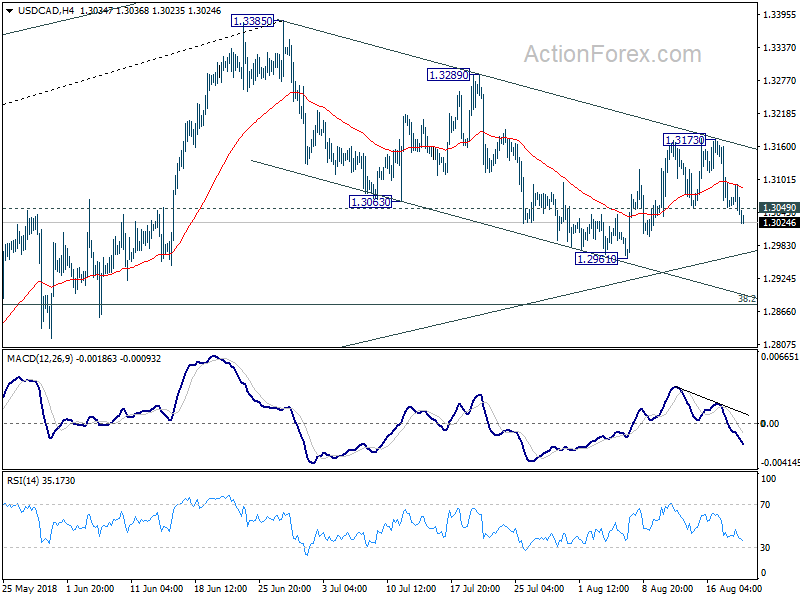
USD/CAD drops further to as low as 1.3023 so far today. The break of 1.3049 support suggests that rebound form 1.2961 has completed at 1.3173 already. The pair is also kept well inside near term falling channel. Intraday bias is back on the downside for 1.2961 first. Break there will resume whole decline from 1.3385. More importantly, that will also break medium term channel support firmly and carries larger bearish implications. On the upside, break of 1.3173 is needed to confirm completion of fall from 1.3385. Otherwise, risk will now stay on the downside even in case of recovery.
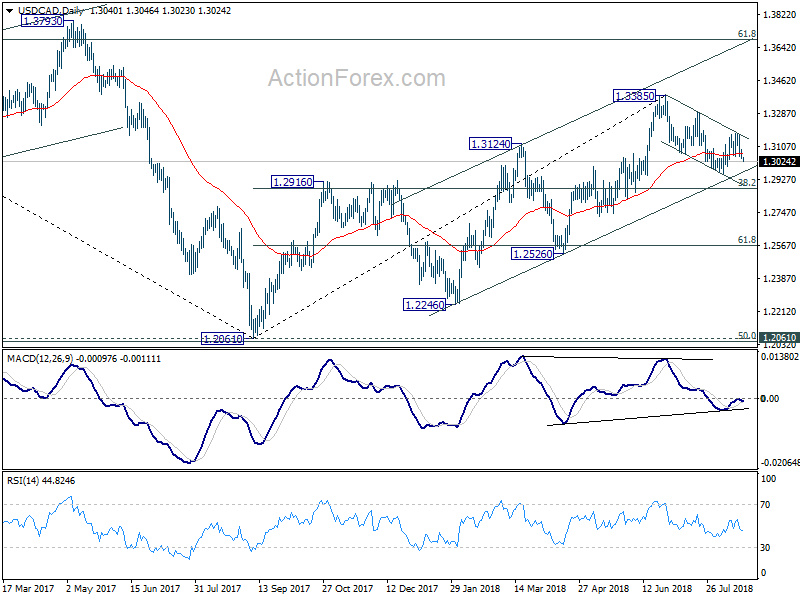
In the bigger picture, as long as channel support (now at 1.2965) holds, we're holding to the bullish view. That is, fall from 1.4689 (2015 high) has completed at 1.2061, ahead of 50% retracement of 0.9406 (2011 low) to 1.4689 (2015 high) at 1.2048. Further rally should be seen for 61.8% retracement of 1.4689 to 1.2061 at 1.3685 and above. However, sustained break of the channel support will argue that rise from 1.2061 has completed. Further decline should be seen to 38.2% retracement of 1.2061 to 1.3385 at 1.2879 first. Sustained break will pave the way to 61.8% retracement at 1.2567 and below.
Market Morning Briefing: Dollar Yen Is Trading At Support Levels Just Now
STOCKS
Dow and Dax looks bullish. Shanghai could see some more dips or remain stable. Nikkei is at important support levels and a bounce or break on either side would decide further direction. Nifty is at crucial levels; need to see if t sustains above 11500 or comes off from there.
Dow (25758.69, +0.35%) and Dax (12331.30, +0.99%) have both moved up and closed just above immediate resistances on the daily candles. If Dow sustains above 25750 and Dax remains above 12300, the indices could move up in the near term towards 12600/650 and 12500 respectively. 3-day candle support on Dax is holding just now.
Nikkei (22182.21, -0.076%) has come down and could test support near 22000 in the near term. If the index manages to hold above 22000, it could move up towards 22400 and higher in the medium term. In case a break below 22000 is seen, it could indicate bearishness towards 21800-21600 levels going forward.
Shanghai (2724.91, +0.98%) tested an intra-day low of 2653 today coming down to our initial important support. While 2650 holds, the 2750-2800 in the coming sessions but a break below 2650, if seen could make it vulnerable to further downside towards 2600 or even lower in the longer run.
Nifty (11551.75%) could trade along the weekly trend resistance and gradually move up towards 11600-11800 in the near term. We would also remain cautious whether the index remains above 11500 for the next few sessions or comes off below 11500 again as that could indicate lack of strong upside momentum just now.
COMMODITIES
Gold and Copper have risen slightly but have resistances above current levels which could limit strong upside. Crude could trade sideways.
Nymex WTI (65.52) and Brent (72.21) have risen from levels seen yesterday. But the resistance near 66.50-67.00 on WTI is important and if that holds, price could come down to re-test 65-64 levels in the near term. Brent on the other hand could see some consolidation in the 73-71 region. A break on either side would give some cues on further direction.
Gold (1200.30) has managed to rise and test 1200. Immediate resistance is seen at 1210. A rise past 1210 is needed to take the price back towards 1225-1230 and even higher in the longer run. There is some hope for bullishness while above 1200.
Copper (2.6735) has moved up slightly. As mentioned yesterday, there is trend resistance near 2.70. If 2.70 holds, we could see another downleg back to 2.65-2.60 else Copper could move up to 2.80+ levels in the medium term.
FOREX
Dollar Index (95.55) has been coming down in the last 3-4 sessions after testing 97 on the upside. The index is in a very near term channel and could come down further to test support near 95.00-94.50 levels in the near term. Also note there is initial support at 95.50 which if holds just now could prevent further fall below 95.50 and instead take the index back to higher levels. See this support at 95.50 on the 3-day charts.
Euro (1.1518) has moved up sharply on weakness in Dollar. It is yet to test the upper resistance of 1.1550 mentioned yesterday and while below 1.1550, there could be chances of a near term dip; else a rise towards 1.1600-1.1625 looks possible.
Dollar Yen (110.00) is trading at support levels just now. A break below 110 could make it vulnerable for a further fall towards 109.30. The weekly chart looks strongly bearish just now. Also keep an eye on immediate support at 22000 on Nikkei which if holds could possibly pull up Dollar Yen also from current levels. 109.50-109.30 is an important support zone for the near term.
Euro Yen (126.73) has support at 124 and earlier support turned resistance at 127 on the weekly chart. If 127 holds, we could see a fall to 124 in the near term.
Pound (1.2824) has risen above 1.28 and while that sustains some more upside towards maximum of 1.290-1.295 is possible. Looking at the 3-day and weekly chart, medium term looks bearish with possible downside towards 1.26 and lower.
Dollar Rupee (69.83) has a possibility of coming down towards 69.50 in the near term. For upside while below 70.10, we could negate any fresh weakness in the Rupee.
INTEREST RATES
Quite a dip in the US 10yr (2.83%) from 2.86% on Friday, bringing it towards the lower end of the projected 2.82-90% range. The 30Yr (2.99%) has dipped below 3.00%, but has an important Support near current level, which can produce a bounce back up towards 3.10%+ while it holds. This suggests that the US 10Yr too might remain in the projected 2.82-90% range, at least till the FOMC Minutes on Wednesday.
Of course, if the Support at 2.99-97% breaks on the 30Yr, we could be looking at a totally different scenario for US bonds. There are already murmurs in the market that the FED could be close to the end of tightening.
German yields are steady at -0.28% (5Yr), 0.30% (10yr) and 0.96% (30yr). However, very importantly, the German-US 2Yr Spread (-3.23%) seems to have bottomed at -3.28% and is rising. The German-US 10Yr Spread (-2.53%) also seems to be breaking its downtrend. They seem to have helped the Euro (1.1518) climb past 1.1500.
The Japanese 30Yr (0.84%) still remains below Resistance for now. We will be watching to see if it breaks higher or not.
The Indian 10Yr GOI (7.8377%) has been moving up from 7.70% since the beginning of the month but has important and possibly strong Resistance coming up at 7.90%. Likely to hold.
Dollar Sold Off on Trump’s Personal Attack on Fed Chair Powell
Dollar weakens broadly overnight on Trump's attack on Fed's policy. It started after Bloomberg reported that Trump lamented Fed chair Jerome Powell for not being the "cheap-money" chair he expected. Then Trump reiterated his comments that he's "not thrilled" with interest rate hikes in Reuters interview. But this time, Trump hid the fact that rate moves at Fed were collective decision. And he embedded a lie in his language by blaming Powell for "his" raising of interest rates. The comments sent Dollar sharply lower, and the greenback extends decline in against all other major currencies.
Gold rides on Dollar's weakness and rebounds to as high as 1194.71 so far. It's having sight on 1200 handle. But technically the key resistance is in 1211.65. Reactions in other markets are muted though. DOW gained 0.35%, S&P 500 rose 0.24% and NASDAQ added 0.48%. Asian markets are also generally higher. At the time of writing, Nikkei is up 0.34%, HK HSI up 0.48%, China Shanghai SSE is up notably by 1.43%, Singapore Strait Times up 0.07%.
Technically, while Dollar is weak, EUR/USD and AUD/USD are far from structural resistance at 1.1745 and 0.7452 respectively. Thus, these two pairs are staying bearish. However, USD/JPY's fall now puts 109.36 key support in focus and break will indicate medium term reversal. Similarly, USD/CAD's decline also put 1.2916 support in focus and break will raise the chance of medium term reversal too. If happens, weakness in USD/JPY and USD/CAD could be early signal of more Dollar selloff ahead.
Dollar extends decline as Trump blames Fed Chair Powell for rate hikes
Dollar stays generally weak in Asian session and extends Monday's selloff, on Trump's attack on Fed. In a Reuters interview, Trump reiterated his comments last month that "I'm not thrilled with his raising of interest rates, no. I'm not thrilled," referring to Fed Chair Jerome Powell.
He complained the the US is not getting any support from the Fed during his negotiation with other countries. Trump noted, "we're negotiating very powerfully and strongly with other nations. We're going to win. But during this period of time I should be given some help by the Fed. The other countries are accommodated."
Trump also fingered pointed at Eurozone and China for currency manipulation to give them an advantage over the US on trade. He said . "I think China's manipulating their currency, absolutely. And I think the euro is being manipulated also."
On trade dispute with China, Trump said he had "no time frame" for ending it. While the Chinese delegation is arriving the US soon, Trump said he did not "anticipate much" from the discussions.
He emphasized that the resolution will "take time" because "China's done too well for too long, and they've become spoiled. They dealt with people that, frankly, didn't know what they were doing, to allow us to get into this position."
Former top treasury official blasts Trump as woefully wide of the mark on Yuan manipulation
Mark Sobel, a former top US Treasury Official criticized Trump's remark regarding Chinese currency manipulation as "woefully wide of the mark". And, Trump's focus on bilateral balances as "silly". And, to suspect a country of currency manipulation, there are criteria of "material 'excessive' current account surplus, an undervalued currency, and ample and rising reserves".
In an article titled "Trump wide of mark on 'manipulation'", Sobel point to facts that "China's current account surplus is falling to under 1% of GDP. The renminbi, hit by capital outflows between early 2015 and the end of 2016, rose sharply against the dollar up to April 2018. The renminbi trade-weighted index rose too. Since then, the renminbi has fallen on both measures, but the depreciation reflects the dollar's strength across the board. There is little evidence of more than scant Chinese foreign exchange market intervention."
He noted "a currency manipulating country should have a significant current account surplus". And, "the US Treasury in its foreign exchange reports uses a 3% of GDP threshold." While a currency manipulating country might also have an "undervalued currency" one should "look at a country's real effective exchange rate, not its bilateral dollar rate." Additionally, the country may intervene heavily in the markets, "buying dollars to hold its currency down, resulting in an increase in its foreign reserve holdings." But there might be "good reasons" to do so such as building up of reserves. There are many useful gauges of reserve adequacy to examine - reserves/GDP; reserves/short-term maturing debt; reserves/imports.
Sobel also completed that "a focus on bilateral balances is silly, even if the US Treasury is required to do so by statute and the president seems obsessed with them. Such an emphasis neglects to consider that certain countries specialize in certain goods and hold comparative advantage in such spheres."
Mark Sobel is US Chairman of OMFIF. He is a former Deputy Assistant Secretary for International Monetary and Financial Policy at the US Treasury and until earlier this year US representative at the International Monetary Fund.
Fed Bostic pledges not to vote for anything that knowingly inverts yield curve
Atlanta Fed President Raphael Bostic said that Fed is doing well on inflation now, and the economy doesn't need as much stimulus as it had before. Also, GDP is strong and unemployment is "very, very low" historically". This part seems to be a bit hawkish. However, Bostic also warned that yield curve is currently "extremely flat" and fed has concerns over the flatness. He went further to emphasize that he won't vote for anything that knowingly inverts yield curve.
RBA minutes: El Niño risks increased, no strong case for a near term rate move
Minutes of August RBA meeting noted that drought conditions affected the timing of crop harvest. And the "probability of an El Niño event, which would typically be associated with low rainfall in eastern Australia, had increased over 2018". That implies " downside risks to the forecasts for farm output and exports."
Otherwise, the minutes came in basically as expected. They noted that global economic expansion continued but "direction of international trade policy in the United States continued to be a source of uncertainty for the global outlook."
Australian Dollar had "depreciated a little" against the US dollar. However, "in trade-weighted terms it had remained within its trading range of the previous two years."
Domestic forecasts were largely unchanged. GDP is projected to be a little above 3% over 2018 and 2019. Inflation would dip "temporarily" in September quarter due to some administered prices. But it's expected to be at around 2.25% in 2020.
On interest rates, the next move "would more likely be an increase than a decrease". But there was "no strong case for a near-term adjustment".
On the data front
New Zealand net migration rose 0.6% mom in July. Swiss will release trade balance in European session. UK will release public sector net borrowing and CBI industrial orders. Later in the day, Canada will release wholesale sales.
USD/CAD Daily Outlook
Daily Pivots: (S1) 1.3022; (P) 1.3058; (R1) 1.3076; More...
USD/CAD drops further to as low as 1.3023 so far today. The break of 1.3049 support suggests that rebound form 1.2961 has completed at 1.3173 already. The pair is also kept well inside near term falling channel. Intraday bias is back on the downside for 1.2961 first. Break there will resume whole decline from 1.3385. More importantly, that will also break medium term channel support firmly and carries larger bearish implications. On the upside, break of 1.3173 is needed to confirm completion of fall from 1.3385. Otherwise, risk will now stay on the downside even in case of recovery.
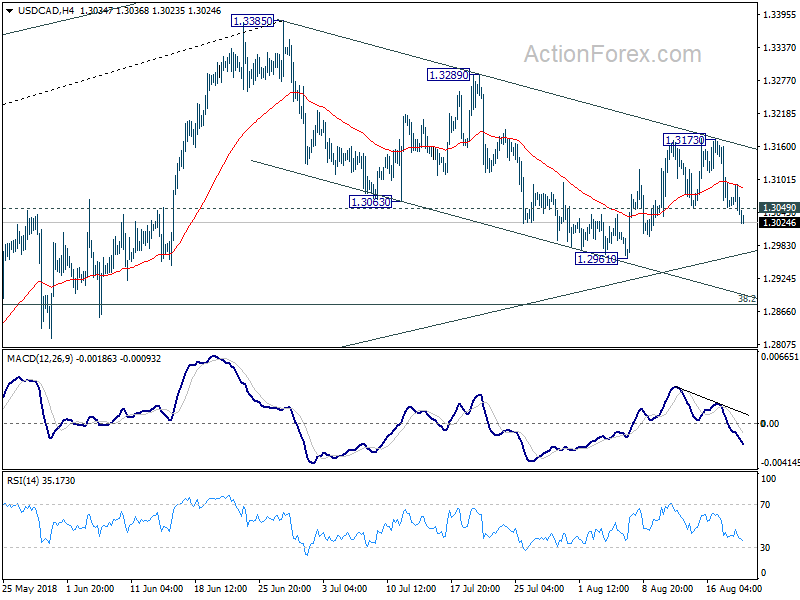
In the bigger picture, as long as channel support (now at 1.2965) holds, we're holding to the bullish view. That is, fall from 1.4689 (2015 high) has completed at 1.2061, ahead of 50% retracement of 0.9406 (2011 low) to 1.4689 (2015 high) at 1.2048. Further rally should be seen for 61.8% retracement of 1.4689 to 1.2061 at 1.3685 and above. However, sustained break of the channel support will argue that rise from 1.2061 has completed. Further decline should be seen to 38.2% retracement of 1.2061 to 1.3385 at 1.2879 first. Sustained break will pave the way to 61.8% retracement at 1.2567 and below.

Economic Indicators Update
| GMT | Ccy | Events | Actual | Forecast | Previous | Revised |
|---|---|---|---|---|---|---|
| 22:45 | NZD | Net Migration M/M Jul | 0.60% | -3.50% | -3.60% | |
| 1:30 | AUD | RBA Meeting Minutes Aug | ||||
| 6:00 | CHF | Trade Balance (CHF) Jul | 2.85B | 2.59B | ||
| 8:30 | GBP | Public Sector Net Borrowing (GBP) Jul | -2.1B | 4.5B | ||
| 10:00 | GBP | CBI Industrial Order Expectations | 10 | 11 | ||
| 12:30 | CAD | Wholesale Trade Sales M/M Jun | 0.80% | 1.20% |