

Sample Category Title
USD/CAD Edges Higher
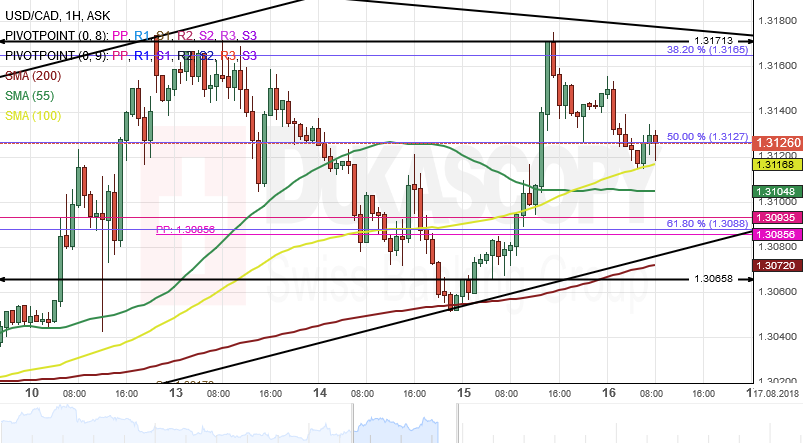
Upside risks dominated the US Dollar against the Canadian Dollar on Wednesday, as the exchange rate ended the trading session with 116 base points gain. The price also tested the 38.20% Fibo.
After reaching near a support level set by the 200-hour simple moving average, mid-session on Wednesday, the currency pair pullback and gradually moving towards a resistance cluster at the 1.3096 regions.
Technical Indicators on the weekly time-frame suggest that the bullish sentiment could continue within this session. Therefore, bulls are likely to target the upper boundary of an ascending channel during the following trading session.
How Exposed Is the U.S. Economy to EM Economies?
The exposure of the U.S. economy to the developing world has increased over the past two decades, but the U.S. expansion likely would not be derailed by financial crises in EM economies, should they occur.
U.S. Economy Has Limited Exposure to the Developing World
In a recent report we argued that emerging market (EM) economies are generally better able to service their external debt than they were 20 years ago.1 Consequently, we do not think that a wave of Turkey-like financial crises will sweep through EM economies as they did in 1997-1998. But what if we are wrong? What if financial crises were to engulf a significant number of EM economies in coming months? How much exposure does the U.S. economy have to the developing world?
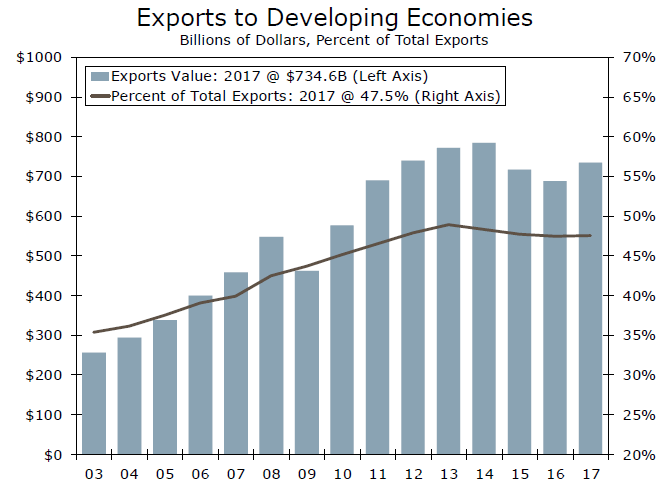
Let's start with trade exposure. American exports to developing economies shot up from about $250 billion in 2003 to more than $700 billion last year (top chart). Today, developing economies account for roughly one-half of U.S. exports. But exports of total goods and services are equivalent to only 14 percent of U.S. GDP. American exports of goods and services to developing economies would need to weaken significantly to have a meaningful effect on U.S. GDP growth. As a point of reference, the value of American exports of goods to developing economies declined only 4 percent between 1998 and 1999 in the wake of the severe economic and financial crises that swept through the developing world 20 years ago.
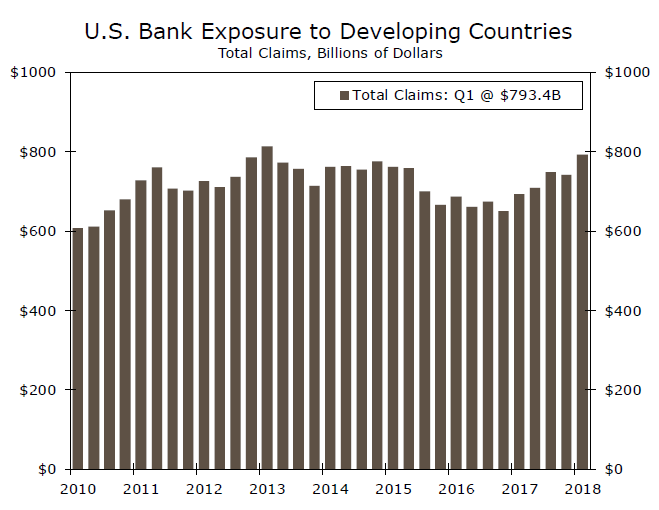
What about American banks? How much exposure do they have to EM economies? Data from the Bank for International Settlements (BIS) show that the exposure of the American banking system to developing economies totaled nearly $800 billion at the end of Q2-2018, which is obviously a sizeable amount (middle chart). However, the financial assets of the U.S. banking system exceed $15 trillion, so exposure of American banks to developing economies represents only 5 percent of their financial assets at present. Unless all EM assets become completely worthless, which is not very likely, the American banking system should be able to weather whatever storm that financial crises in developing economies were to throw its way.
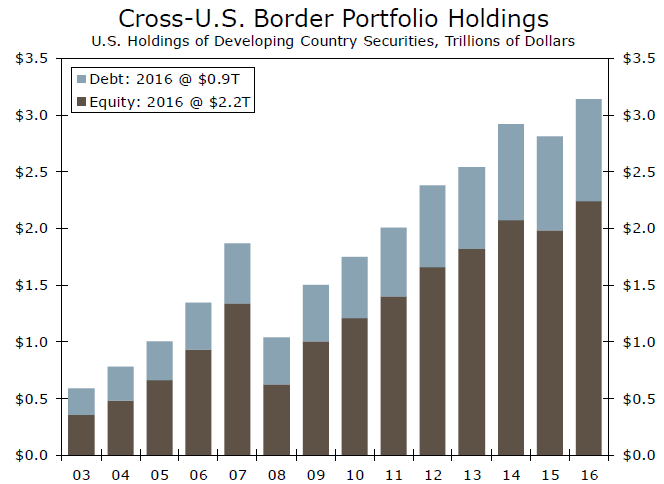
What about American investors? Do they have significant exposure to emerging market economies? At the end of 2016 (latest available data), Americans owned about $3 trillion worth of EM stocks and bonds (bottom chart). Sharp declines in the value of those assets probably would not go unnoticed by American investors. But American households held $75 trillion worth of financial assets at the end of 2016. A complete rout of EM financial markets, should one occur, would not lead to catastrophic losses for most American households.
In sum, the U.S. economy has only limited exposure to EM economies. Twenty years ago, the financial crises that swept through the developing world had only marginal effects on the U.S. economy. Although American exposure to the developing world has increased over the past two decades, financial crises in EM economies today likely would not derail the U.S. economy.
NZD/USD Moving Sideways
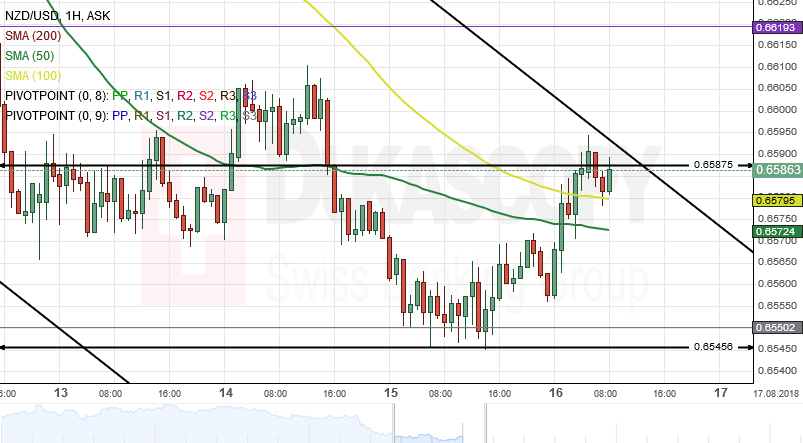
The New Zealand Dollar continued to depreciate against the US Dollar for the fourth consecutive trading session on Wednesday. This downside movement has resulted in the pair to breached the 55-hour simple moving average.
During the European session on Thursday, the currency pair tested the upper boundary of a junior descending channel.
As for the near future, it is likely that the NZD/USD currency exchange rate continue moving along the junior descending channel pattern until its lower boundary is reach. Also, technical indicators suggest that bears are likely to grow strong within this given session.
EUR/JPY Analysis: Remains Unchanged
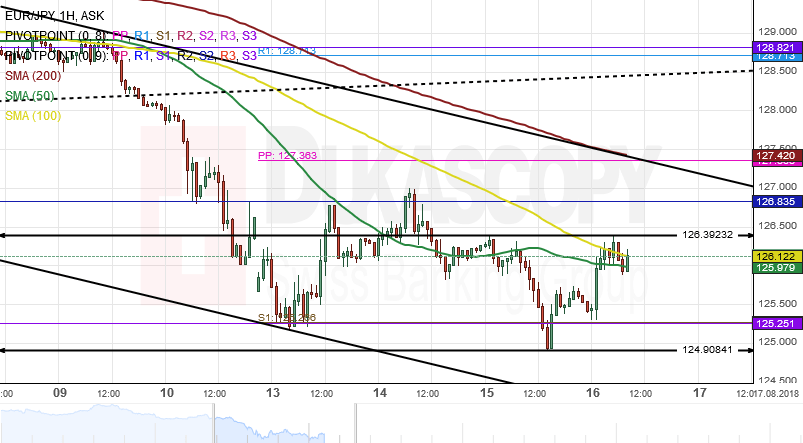
The Eurozone single currency remained stable against the Japanese Yen on Wednesday, as the currency pair was trading with low volatility. Also, the pair breached the 55-hour simple moving average at 126.12.
After hitting the monthly pivot point at 126.83 during the previous session, the exchange rate made a U-turn south. However, the decline was stopped by a double bottom support level at 125.80.
Everything being equal, it is likely that the EUR/JPY currency exchange rate continue moving down along the junior descending channel during the following trading session.
GBP/JPY 4H Chart: Pair Shows Weakness
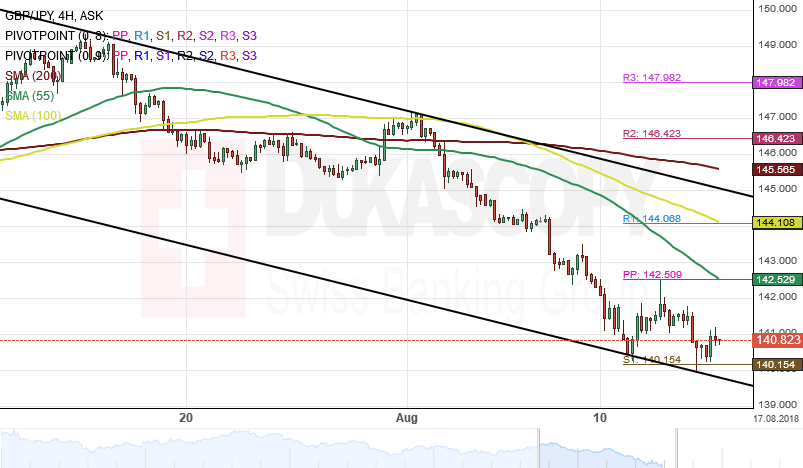
Downside risks dominated the GBP/JPY currency pair since the middle of July, as the Great British Pound depreciated 6.13% against the Japanese Yen.
The exchange rate is trading in a descending channel, which was formed on July 17 and has pushed the pair lower toward the lower boundary of a dominant descending channel pattern. However, the rate has been stranded between the weekly resistance level at 142.50 and the monthly S3 at 140.15 since the beginning of this week.
By and large, it is likely that the currency exchange rate remains moving in the junior descending channel during the following trading sessions.
AUD/JPY 4H Chart: Bounces Off Support Level
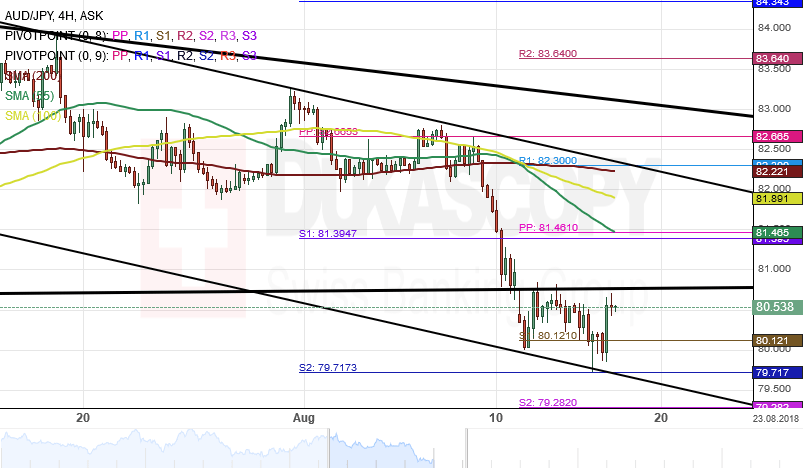
The Australian Dollar has depreciated massively against the Japanese Yen since the beginning of August. The currency pair made a U-turn from its upper boundary of a descending channel on August 8 and had since declined by 287 base points or 3.46%.
However, during the end of yesterday session, the exchange rate bounced off the monthly support level at 79.71 and slightly gaining strength.
By the Asian session on Thursday, the pair tested the upper border of the descending channel. Technical indicators on both the daily and the weekly time frames demonstrate that bulls are likely to grow stronger during the following days.
Has Erdogan Sunk Gold Prices?
Despite mounting geopolitical risks, gold has done the opposite of what would have been expected and slumped, falling 5% from USD 1,228 to USD 1,162 per ounce during the Turkish currency crisis. Could it have been Turkish President Erdogan’s plea to his own people? “If you still have euros, dollars or gold under your pillow, you should change it to lira. This is a national duty." Um….no, unlikely. The idiosyncratic nature of modern risk-aversion phases, versus the ‘sell everything with high beta’ mentality of the past, suggest that rabid gold buying is unlikely. Investors waiting out a storm will head to the USD or even Bitcoin or other cryptocurrencies that are viable alternatives during system breakdowns. We remain negative for gold mid- and long-term.
Meanwhile, risk appetite continues to stabilize as USD/TRY grinds lower. The outlook for contagion has been reduced as the size and make-up of Turkish assets has generally been determined. Limited exposure to toxic assets by foreign financial institutions has given traders confidence the ‘event horizon’ will not be breached. America’s additional tariffs on Turkish products will stay, but Turkey has received a USD 15 billion lifeline from Qatar. Crisis avoided for now, but long-term damage to Turkey remains to be determined.
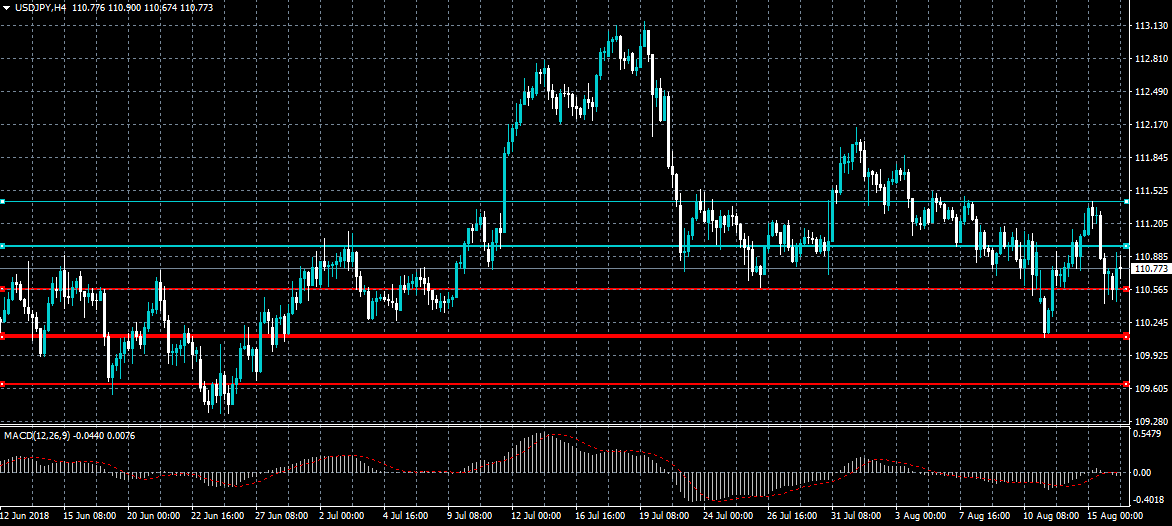
USDJPY Now Starting To Turn Bearish
The US dollar remains under pressure against the Japanese yen, as buyers continue to struggle to move the price back above the 111.00 resistance level. The MACD indicator across the four-hour time frame is starting to trend down, pointing to further intraday softness in the USDJPY pair. Sellers will look to break the 110.10 support level, while buyers need to maintain the price above the 111.37 level.
The USDJPY pair is intraday bearish while trading below the 110.55 level, key support is found at the 110.10 and 109.56 levels.
If the USDJPY pair trades above the 111.37 level, buyers will likely test towards the 111.80 and 112.05 resistance levels.
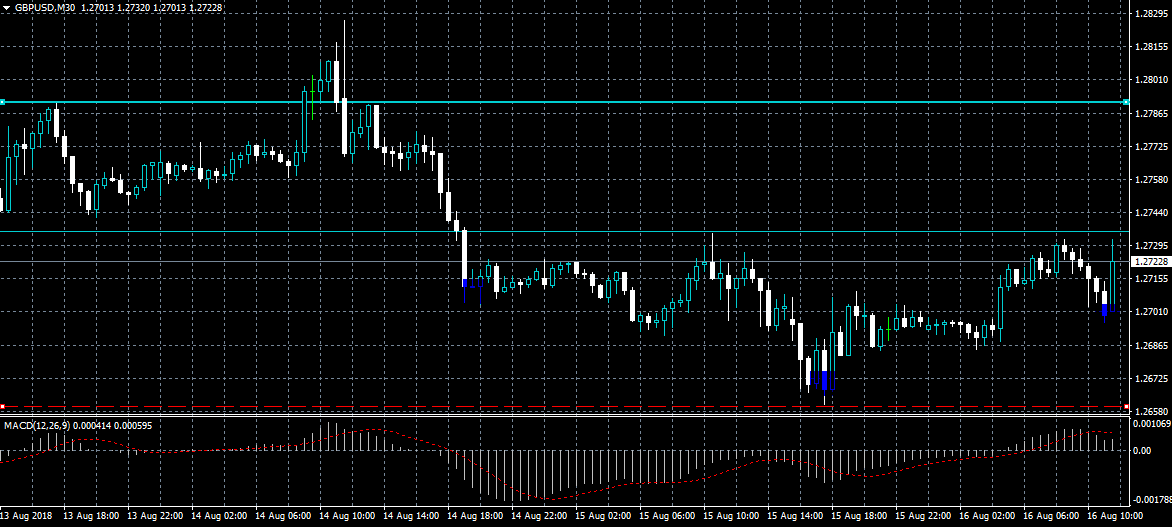
GBPUSD Short Term Bullish Pattern
The British pound has moved higher against the US dollar after Retail Sales data from the United Kingdom came in much better than expected earlier today. The GBPUSD pair retains a bullish intraday bias while trading above the key 1.2730 resistance level. Sterling traders should also note that a bullish inverted head and shoulders pattern is forming across the lower time frame charts.
The GBPUSD pair is bullish while trading above the 1.2730 level, key resistance is found at the 1.2770 and 1.2800 levels.
If the GBPUSD pair moves below the 1.2700 level, key intraday support is found at the 1.2660 and 1.2610 levels.
The Analytical Overview Of The Main Currency Pairs
The EUR/USD currency pair
Technical indicators of the currency pair:
Prev Open: 1.13460
Open: 1.13464
% chg. over the last day: -0.02
Day's range: 1.13423 – 1.13531
52 wk range: 1.0571 – 1.2557
The euro began to recover. Conflict between the US and Turkey is in the focus of attention. At the moment, quotes are consolidating. Local support and resistance levels are 1.13500 and 1.14000, respectively. We recommend opening positions from these marks. In the near future, a technical correction is not ruled out.
The news feed on 16.08.2018:
Statistics on the real estate market in the US at 15:30 (GMT+3:00);
Philadelphia Fed manufacturing index at 15:30 (GMT+3:00).
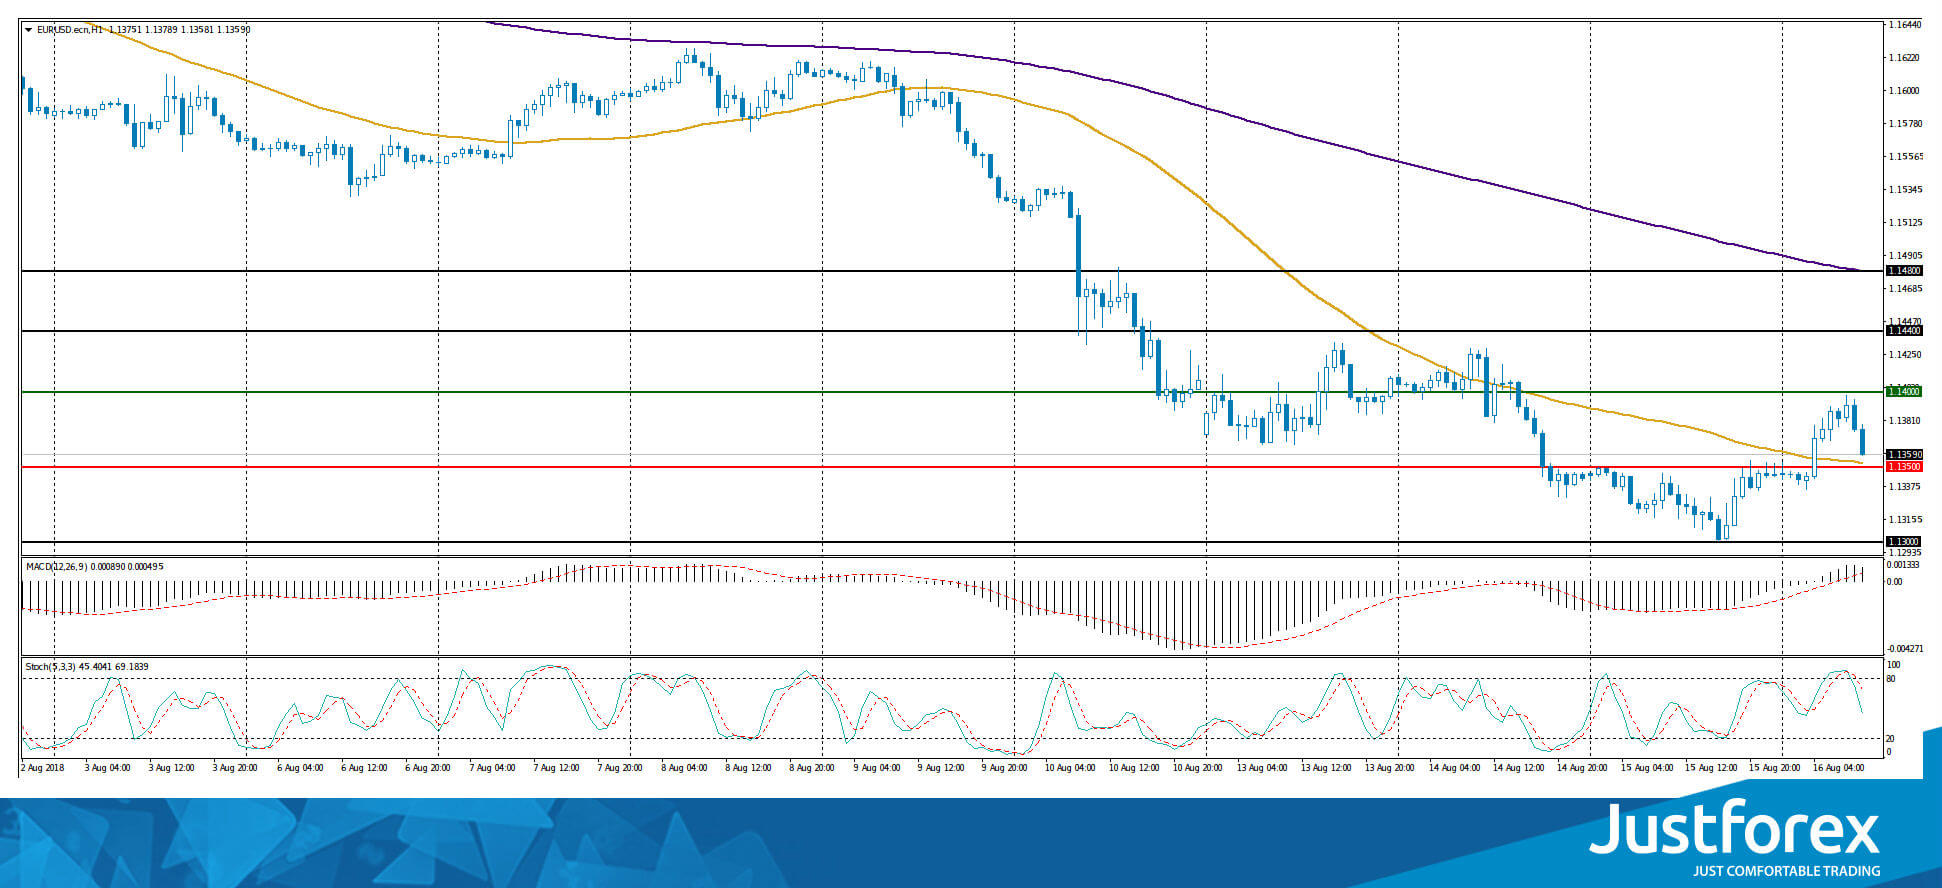
Indicators do not send accurate signals: the price is being traded between 50 MA and 200 MA.
The MACD histogram is located in the positive zone and above the signal line, which gives a strong signal to buy EUR/USD.
Stochastic Oscillator is in the neutral zone, the %K line is below the %D line, which indicates a decrease in quotes.
Trading recommendations
Support levels: 1.13500, 1.13000
Resistance levels: 1.14000, 1.14400, 1.14800
If the price fixes above the round level of 1.14000, the EUR/USD currency pair is expected to grow. The movement is tending to 1.14400-1.14600.
Alternative option. If the price fixes below 1.13500, it is necessary to look for entry points to the market to open short positions. The movement is tending to 1.13000-1.12800.
The GBP/USD currency pair
Technical indicators of the currency pair:
Prev Open: 1.27201
Open: 1.26958
% chg. over the last day: -0.25
Day's range: 1.26929 – 1.27000
52 wk range: 1.2361 – 1.4345
The technical pattern on the GBP/USD currency pair is ambiguous. Yesterday, the consumer price index was published in the UK, which counted to 2.5% in July, as investors expected. At the moment, the key support and resistance levels are 1.26900 and 1.27400, respectively. The positions should be opened from these marks.
At 11:30 (GMT+3:00) a report on retail sales will be published in the UK.
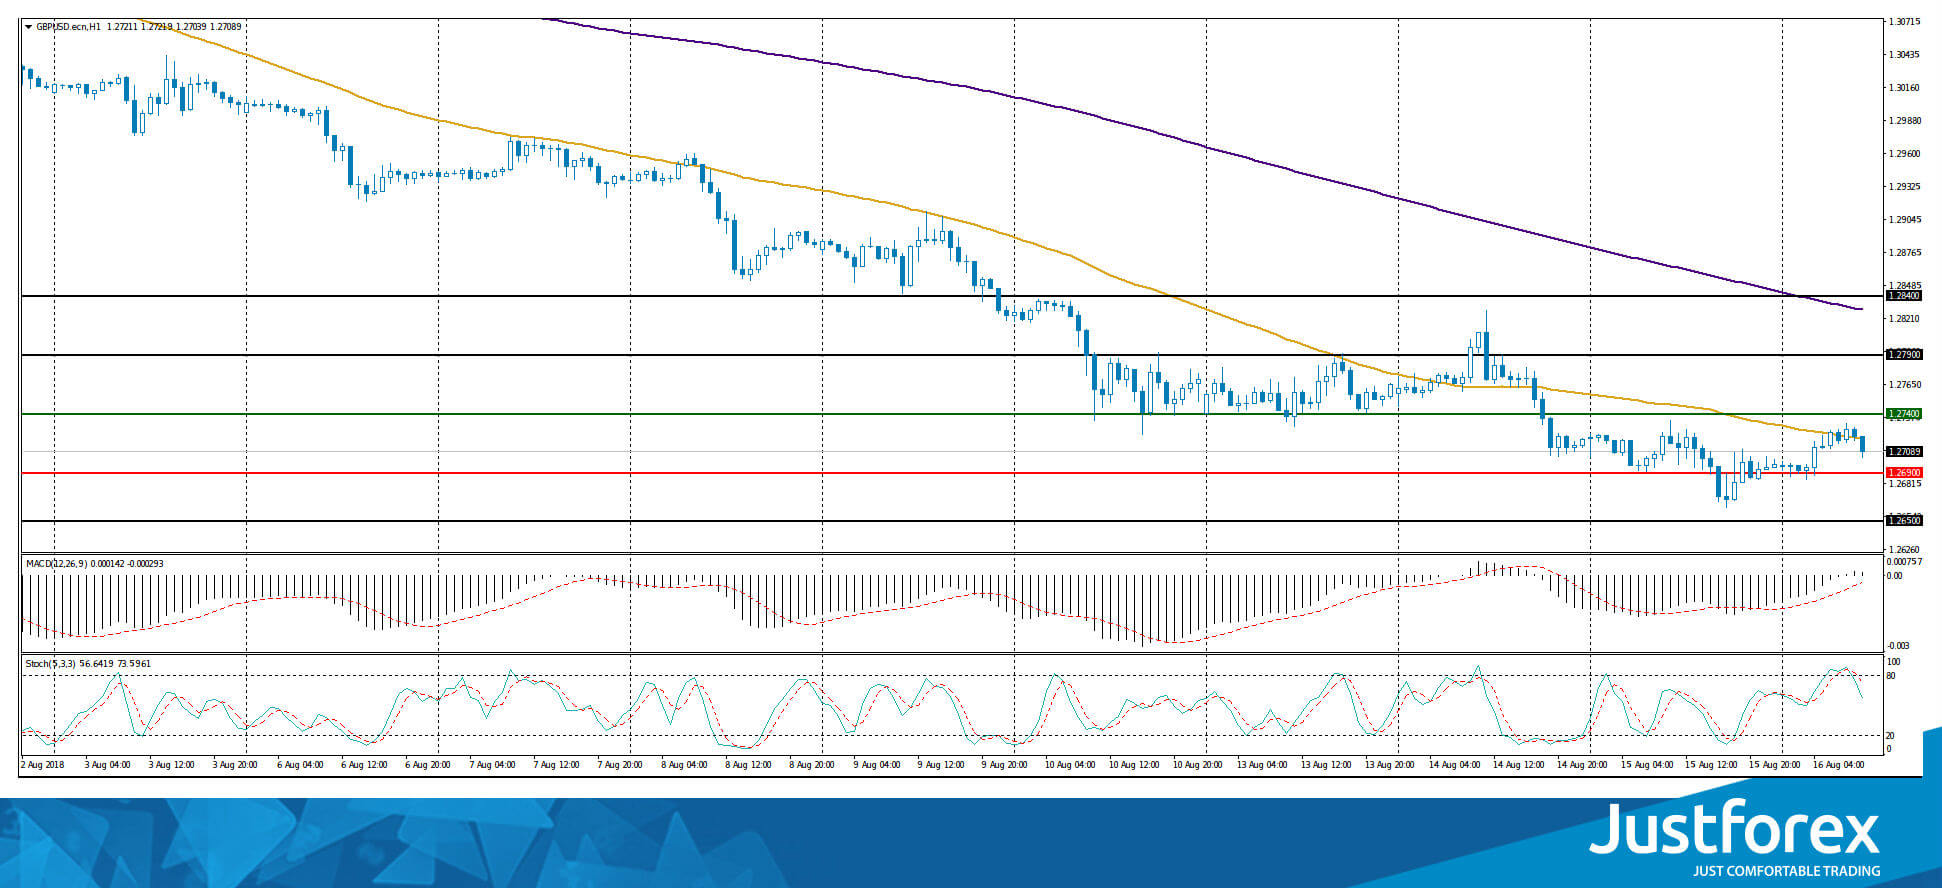
Indicators do not send accurate signals: the price is testing 50 MA.
The MACD histogram is near the 0 mark.
Stochastic Oscillator is located in the neutral zone, the %K line is below the %D line, which indicates a decrease in the GBP/USD quotes.
Trading recommendations
Support levels: 1.26900, 1.26500
Resistance levels: 1.27400, 1.27900, 1.28400
If the price fixes above the 1.27400 mark, corrective movement is expected. The target level for profit-taking is 1.27900-1.28400.
An alternative may be a decrease in the GBP/USD quotes to 1.26500-1.26300.
The USD/CAD currency pair
Technical indicators of the currency pair:
Prev Open: 1.30567
Open: 1.31391
% chg. over the last day: +0.70
Day's range: 1.31379 – 1.31312
52 wk range: 1.2059 – 1.3795
Yesterday, purchases prevailed on the USD/CAD currency pair. The growth of quotes exceeded 100 points. At the moment, the technical pattern is ambiguous. Financial market participants expect additional drivers. Local support and resistance levels are 1.31100 and 1.31400, respectively. We recommend opening positions from these marks.
Today, the news feed on the economy of Canada is calm.
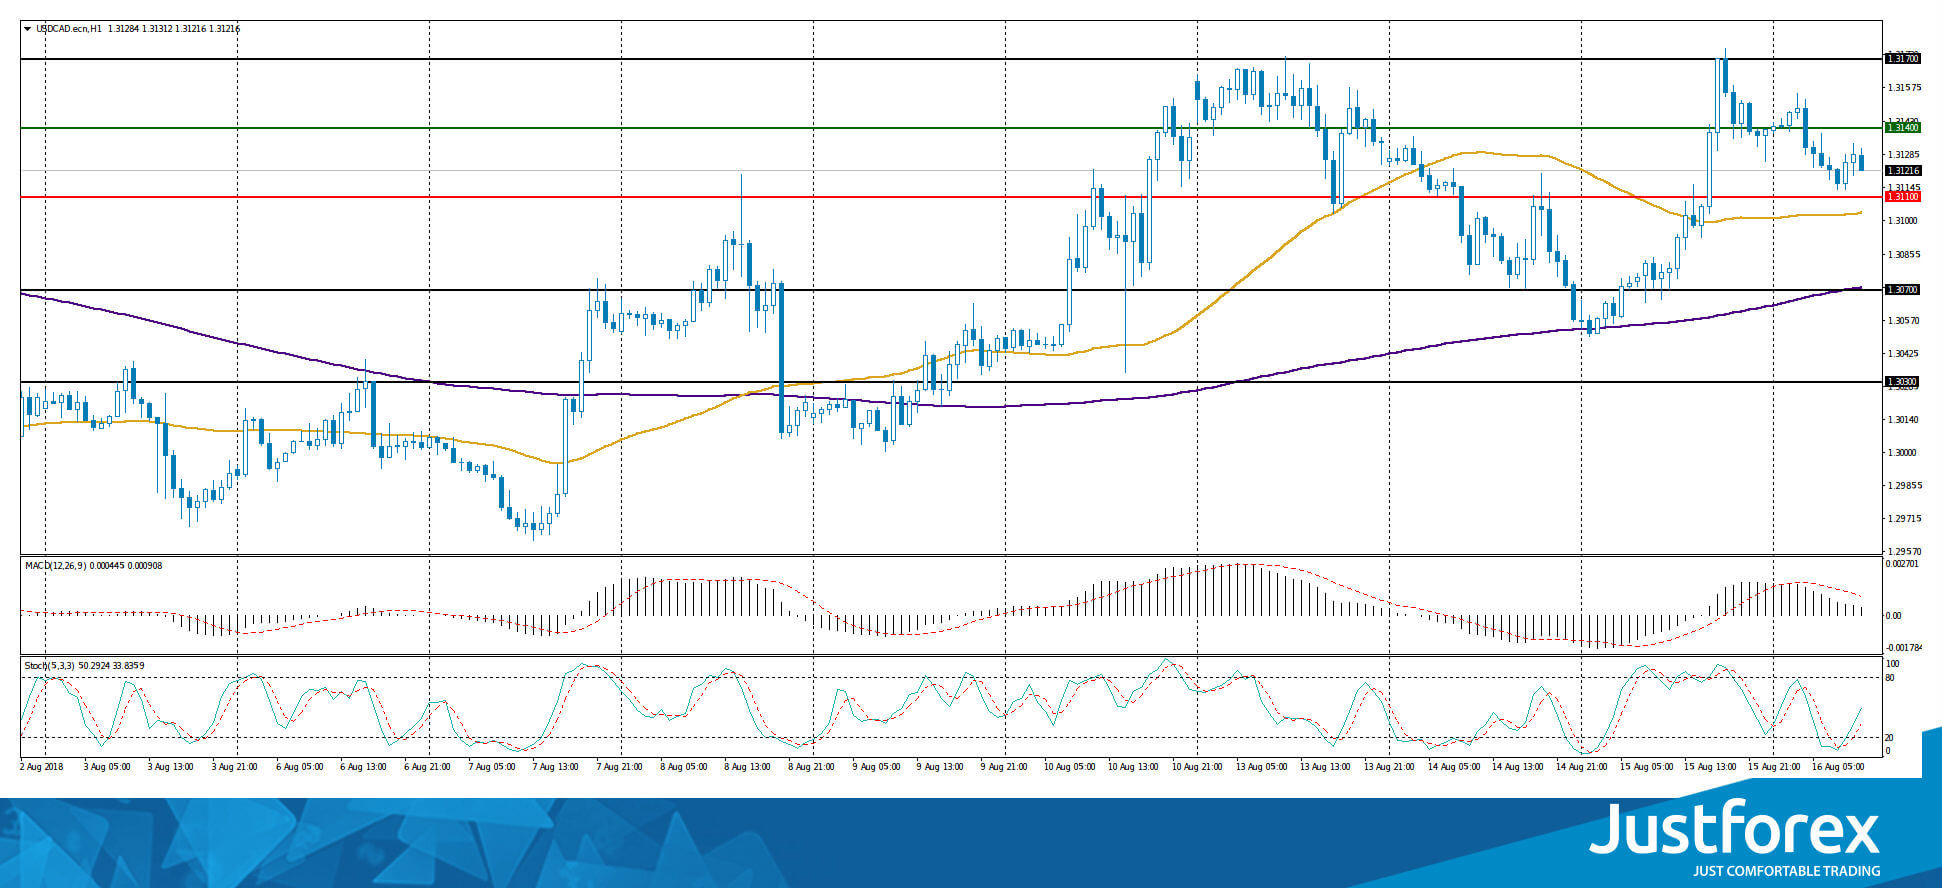
The price has fixed above 50 MA and 200 MA, which indicates the power of buyers.
The MACD histogram is in the positive zone, but below the signal line, which gives a weak signal to buy USD/CAD.
Stochastic Oscillator is located in the neutral zone, the %K line is above the %D line, which indicates the USD/CAD quotes growth.
Trading recommendations
Support levels: 1.31100, 1.30700, 1.30300
Resistance levels: 1.31400, 1.31700
If the price fixes below 1.31100, the USD/CAD quotes are expected to correct. The movement is tending to 1.30700-1.30500.
Alternative option. If the price fixes above the resistance of 1.31400, it is necessary to consider purchases of USD/CAD. The movement is tending to 1.31700-1.31900.
The USD/JPY currency pair
Technical indicators of the currency pair:
Prev Open: 111.112
Open: 110.703
% chg. over the last day: -0.53
Day`s range: 110.766 – 110.831
52 wk range: 104.56 – 114.74
Yesterday, there were aggressive sales on the USD/JPY currency pair. The decrease in quotes exceeded 80 points. Demand for safe assets rises in periods of instability in financial markets. At the moment, quotes are testing local support and resistance levels 110.700 and 110.900, respectively. The positions should be opened from these marks.
During the Asian trading session, weak data on the trade balance of Japan were published.
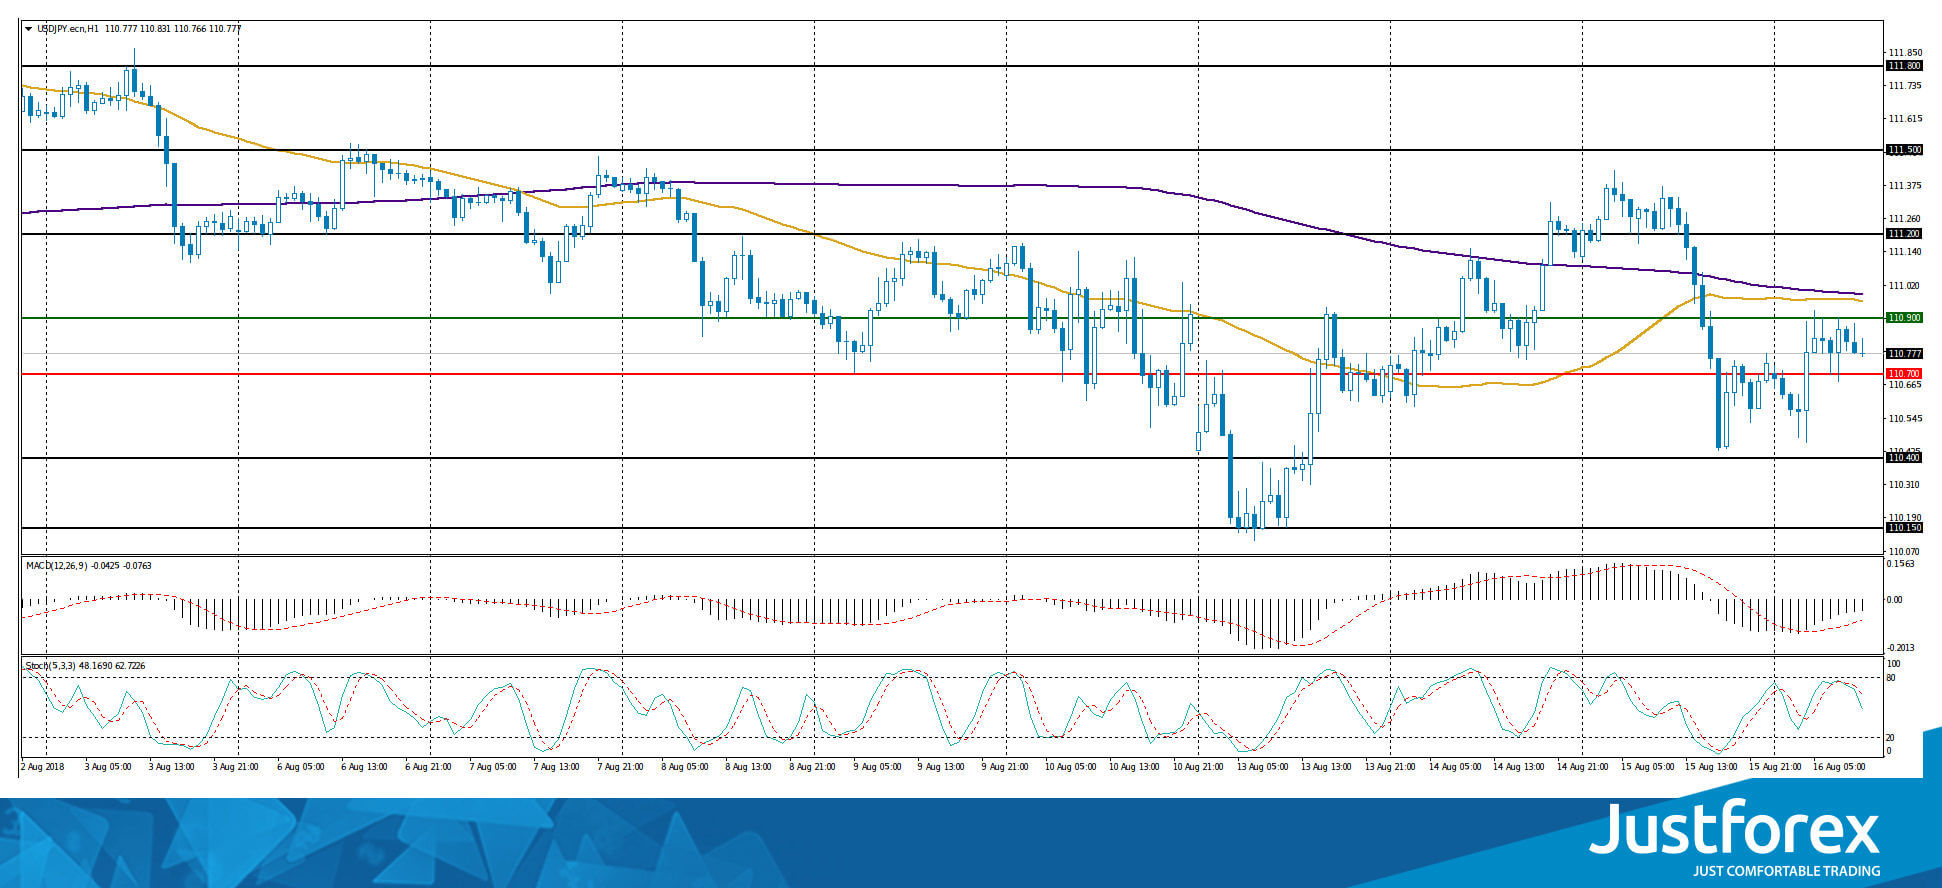
Indicators point to the power of sellers: the price has fixed below 50 MA and 200 MA.
The MACD histogram is in the negative zone, but above the signal line, which gives a weak signal to sell USD/JPY.
Stochastic Oscillator is located in the neutral zone, the %K line is below the %D line, which indicates a decrease in USD/JPY.
Trading recommendations
Support levels: 110.700, 110.400, 110.150
Resistance levels: 110.900, 111.200, 111.500
If the price fixes above the resistance level of 110.900, the USD/JPY currency pair is expected to grow. The movement is tending to 111.200-111.500.
Alternative option. If the price fixes below the 110.700 mark, it is necessary to consider sales of USD/JPY. The movement is tending to 110.400-110.150.