Sample Category Title
Aussie Trading On A Weaker Footing In The Morning Session
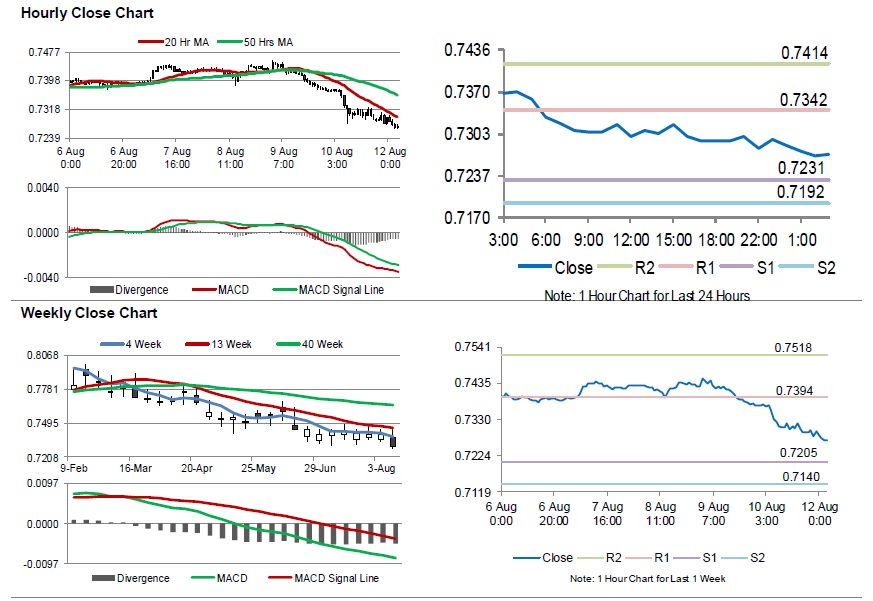
For the 24 hours to 23:00 GMT, the AUD declined 0.96% against the USD and closed at 0.7299 on Friday.
LME Copper prices declined 2.0% or $127.0/MT to $6120.0/MT. Aluminium prices declined 3.7% or $79.0/MT to $2039.0/MT.
In the Asian session, at GMT0300, the pair is trading at 0.7270, with the AUD trading 0.40% lower against the USD from Friday’s close.
The pair is expected to find support at 0.7231, and a fall through could take it to the next support level of 0.7192. The pair is expected to find its first resistance at 0.7342, and a rise through could take it to the next resistance level of 0.7414.
Moving forward, traders would closely monitor Australia’s NAB business conditions and business confidence indices, both for July set to release overnight.
The currency pair is trading below its 20 Hr and 50 Hr moving averages.
Gold: Yellow Metal Trading Lower In The Morning Session
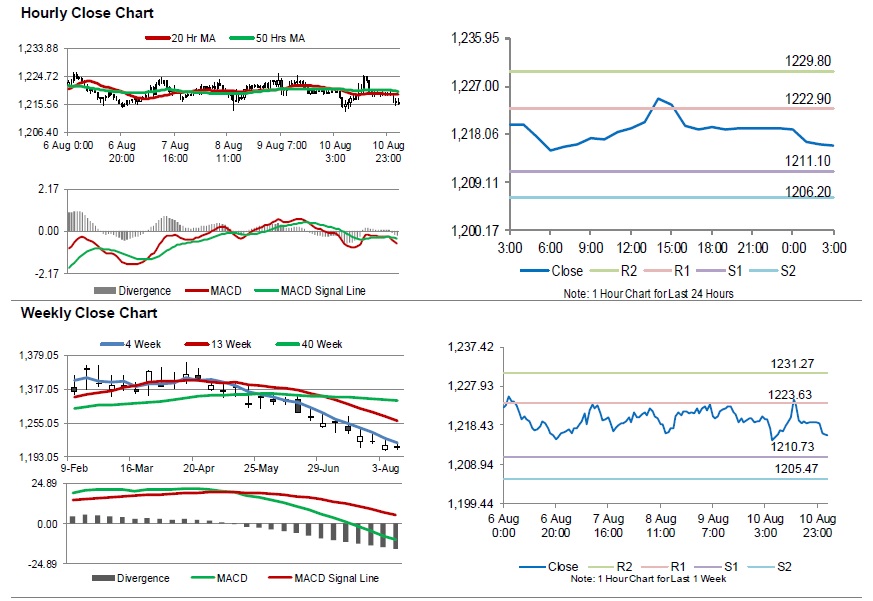
For the 24 hours to 23:00 GMT, Gold declined marginally against the USD and closed at USD1219.00 per ounce on Friday, amid strength in greenback.
In the Asian session, at GMT0300, the pair is trading at 1216.00, with gold trading 0.25% lower against the USD from Friday’s close.
The pair is expected to find support at 1211.10, and a fall through could take it to the next support level of 1206.20. The pair is expected to find its first resistance at 1222.90, and a rise through could take it to the next resistance level of 1229.80.
The yellow metal is trading below its 20 Hr and 50 Hr moving averages.
Silver: White Metal Trading On A Weaker Footing In The Morning Session
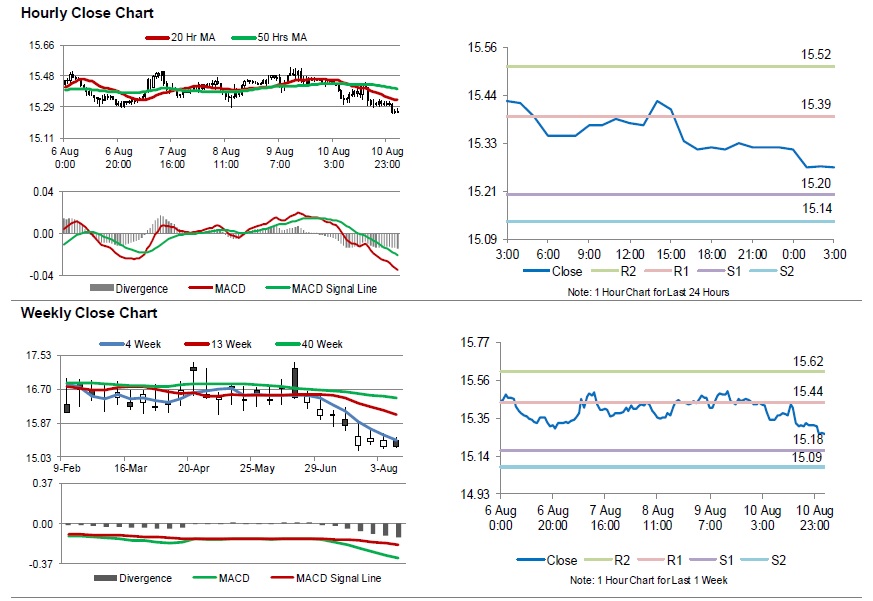
For the 24 hours to 23:00 GMT, Silver declined 0.74% against the USD and closed at USD15.33 per ounce on Friday, tracking losses in gold prices.
In the Asian session, at GMT0300, the pair is trading at 15.27, with silver trading 0.39% lower against the USD from Friday’s close.
The pair is expected to find support at 15.20, and a fall through could take it to the next support level of 15.135. The pair is expected to find its first resistance at 15.39, and a rise through could take it to the next resistance level of 15.52.
The white metal is trading below its 20 Hr and 50 Hr moving averages.
Crude Oil: Oil Trading Reverses Its Gains In The Asian Session
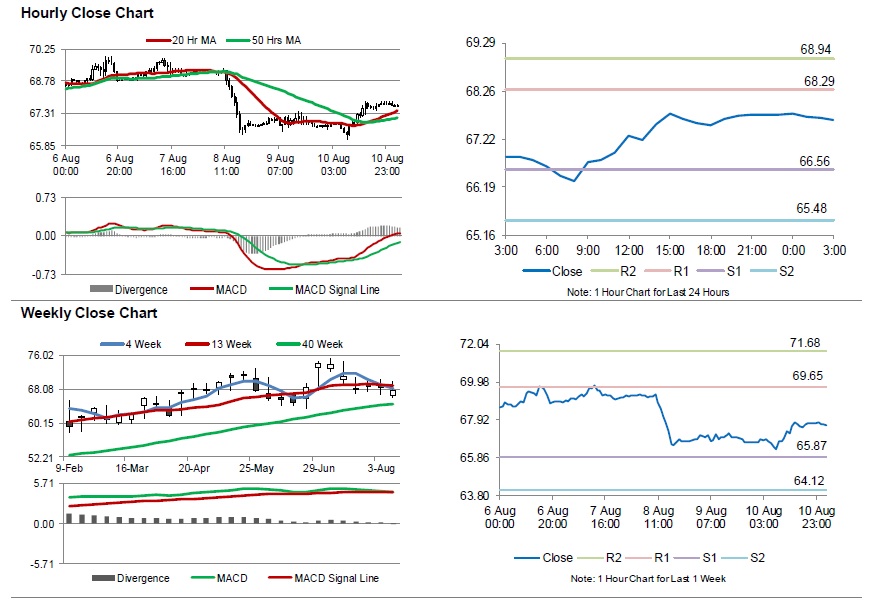
For the 24 hours to 23:00 GMT, Crude Oil rose 1.51% against the USD and closed at USD67.72 per barrel on Friday, after the International Energy Agency increased its forecast for global oil demand growth by 110,000bls a day to 1.5mn bls for 2019.
Meanwhile, fresh figures from Baker Hughes disclosed that the number of active oil rigs rose by 10 to 869 in the week ended 10 August.
In the Asian session, at GMT0300, the pair is trading at 67.63, with oil trading 0.13% lower against the USD from Friday’s close, as rising geopolitical trade tensions dampened demand for the commodity.
The pair is expected to find support at 66.56, and a fall through could take it to the next support level of 65.48. The pair is expected to find its first resistance at 68.29, and a rise through could take it to the next resistance level of 68.94.
Crude oil is trading above its 20 Hr and 50 Hr moving averages.
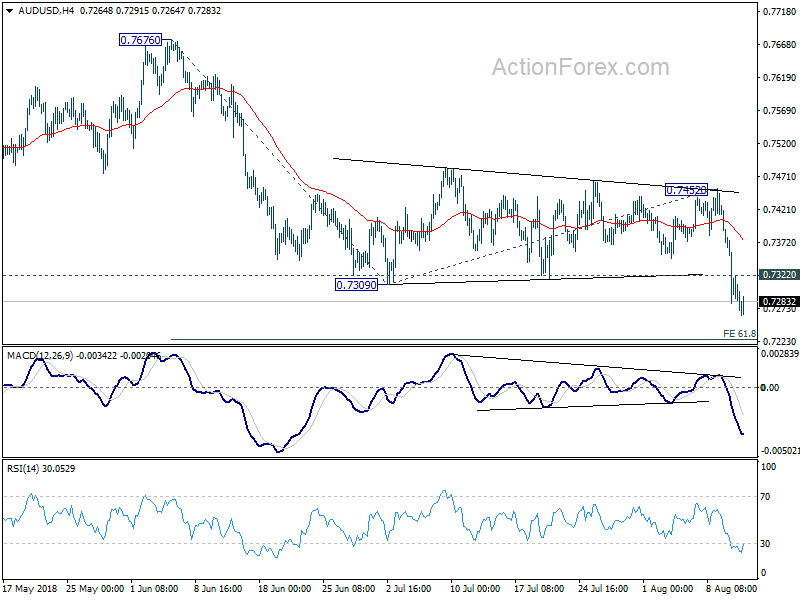
AUD/USD Daily Outlook
Daily Pivots: (S1) 0.7260; (P) 0.7321; (R1) 0.7355; More...
Intraday bias in AUD?USD remains on the downside for the moment. Current down trend from 0.8135 should extend to 61.8% projection of 0.7676 to 0.7309 from 0.7452 at 0.7225 first. Break will target 100% projection at 0.7085 next. On the upside, above 0.7322 minor resistance will turn intraday bias and bring consolidation. But recovery should be limited below 0.7452 resistance to bring fall resumption.
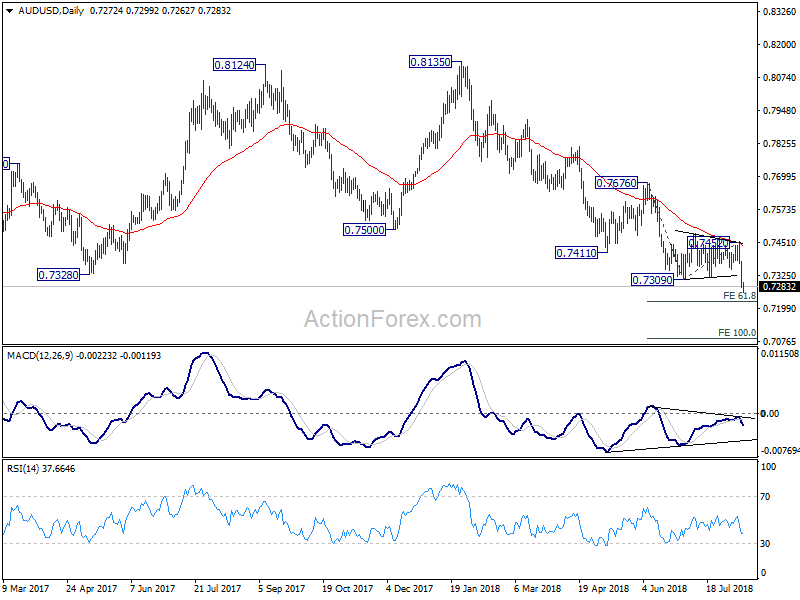
In the bigger picture, medium term rebound from 0.6826 (2016 low) is seen as a corrective move that should be completed at 0.8135. Sustained break of 0.7328 cluster support (61.8% retracement of 0.6826 to 0.8135 at 0.7326) should pave the way to retest 0.6826. There is prospect of resuming long term down trend from 1.1079 (2011 high). But we'll look at downside momentum to assess at a later stage. On the upside, break of 0.7452 resistance might indicate medium term bottoming. But we'll continue to favor the bearish view as long as 0.7676 resistance holds.
USD/CAD Daily Outlook
Daily Pivots: (S1) 1.3066; (P) 1.3110; (R1) 1.3190; More...
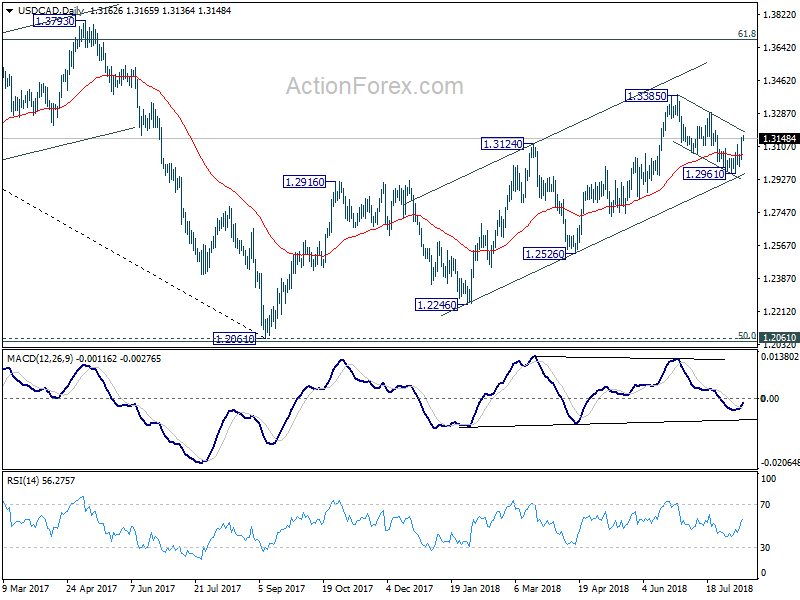
Intraday bias in USD/CAD remains on the upside for 1.3289 resistance. The correction from1.3385 has completed with three waves down to 1.2961. Break of 1.3289 will likely resume larger rise from 1.2061 through 1.3385 high. On the downside, though, break of 1.3035 minor support will dampen this bullish view and turn focus back to 1.2961 low.
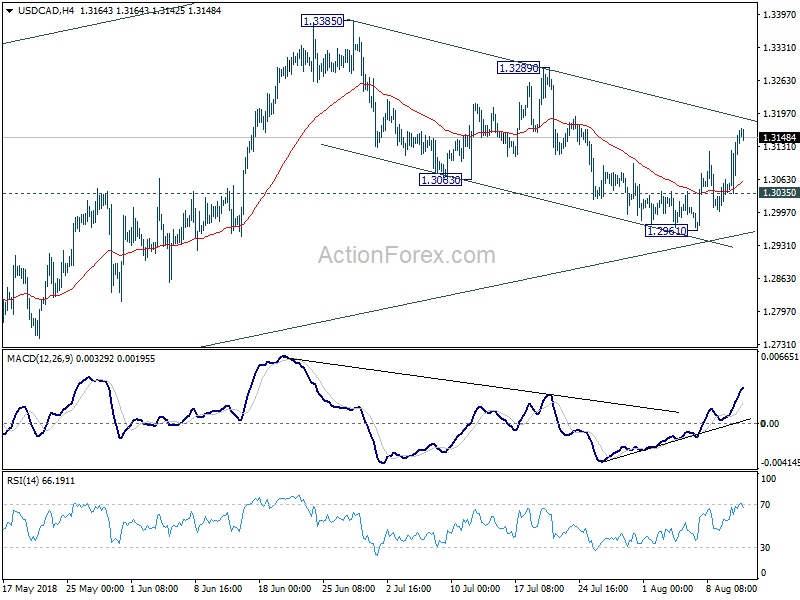
In the bigger picture, as long as channel support (now at 1.2911) holds, we're holding to the bullish view. That is, fall from 1.4689 (2015 high) has completed at 1.2061, ahead of 50% retracement of 0.9406 (2011 low) to 1.4689 (2015 high) at 1.2048. Further rally should be seen for 61.8% retracement of 1.4689 to 1.2061 at 1.3685 and above. However, sustained break of the channel support will argue that rise from 1.2061 has completed and will bring deeper fall to 1.2526 support to confirm.
EUR/USD Daily Outlook
Daily Pivots: (S1) 1.1352; (P) 1.1445 (R1) 1.1502; More.....
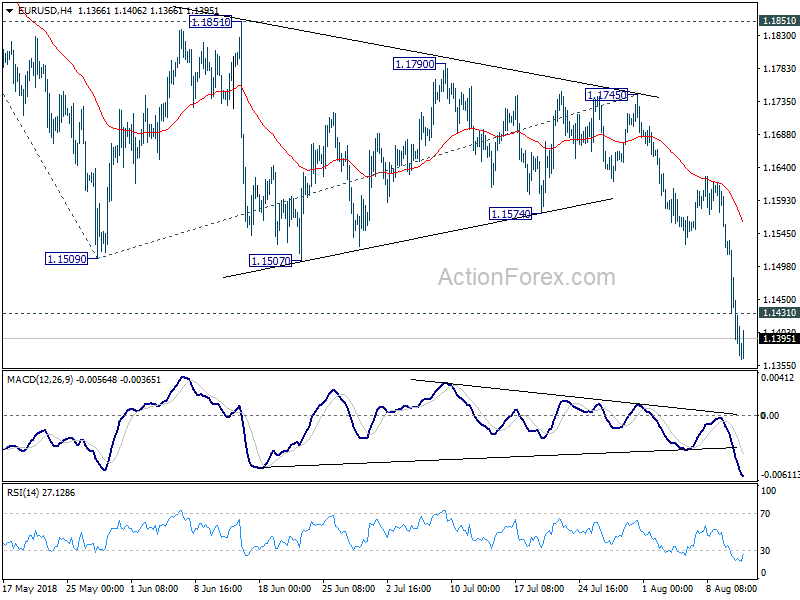
Intraday bias in EUR/USD remains on the downside for the moment. Down trend from 1.2555 is in progress and target 61.8% projection of 1.2413 to 1.1509 from 1.1745 at 1.1186. Note that it's a cluster level with 61.8% retracement of 1.0339 to 1.2555 at 1.1186. Hence, we'll tentatively look for short term bottoming around 1.1186. On the upside, above 1.1431 minor resistance will turn bias neutral and bring consolidations first, before staging another decline.
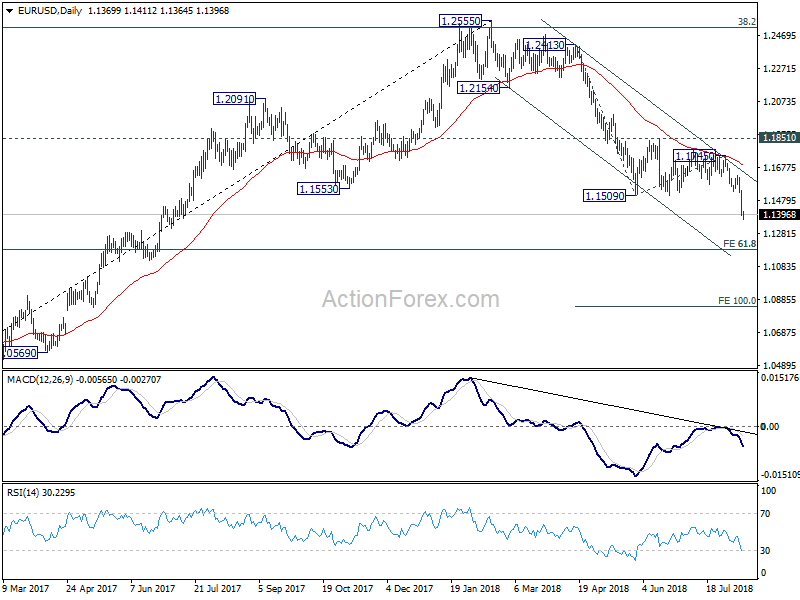
In the bigger picture, the down trend from 1.2555 medium term is in progress for 61.8% retracement of 1.0339 to 1.2555 at 1.1186. Note again that EUR/USD was rejected by 38.2% retracement of 1.6039 (2008 high) to 1.0339 (2017 low) at 1.2516. That carries some long term bearish implications. Sustained break of 1.1186 could pave the way back to retest 1.0339 low. For now, outlook will remain bearish as long as 1.1851 resistance holds, even in case of strong rebound.
GBP/USD Daily Outlook
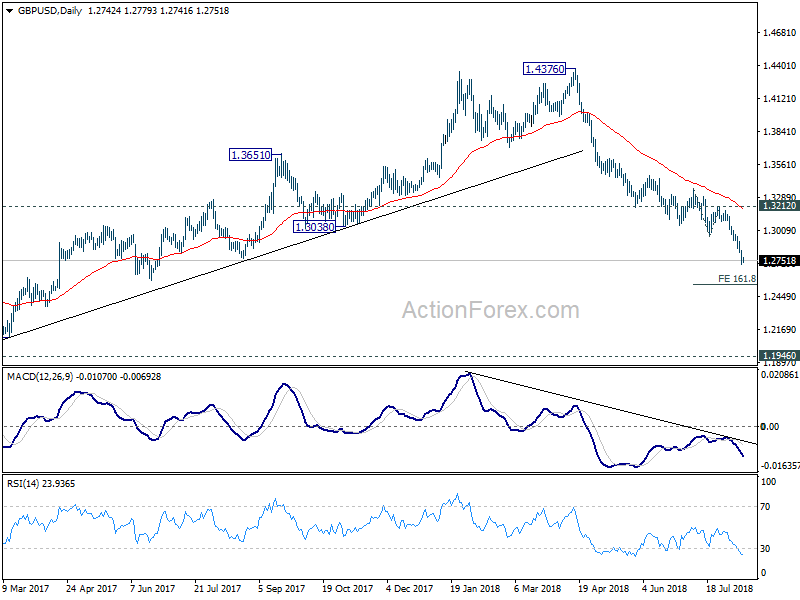
Daily Pivots: (S1) 1.2716; (P) 1.2777; (R1) 1.2831; More...
Intraday bias in GBP/USD remains on the downside for the moment. Down trend from 1.4376 is in progress and should target 161.8% projection of 1.3362 to 1.2956 from 1.3212 at 1.2555 next. On the upside, above 1.2817 minor resistance will turn intraday bias neutral and bring consolidations. But recovery should be limited by 1.2956 support turned resistance to bring fall resumption.
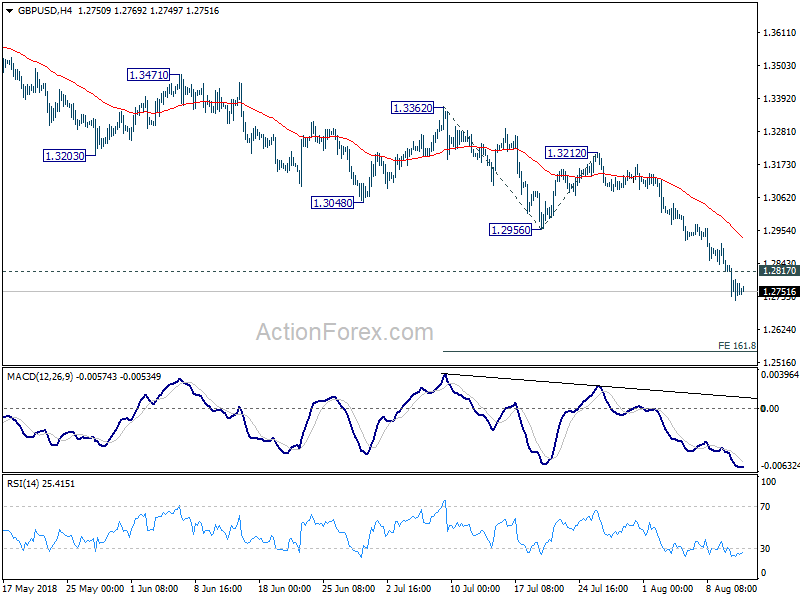
In the bigger picture, whole medium term rebound from 1.1946 (2016 low) should have completed at 1.4376 already, after rejection from 55 month EMA (now at 1.4141). Current downside acceleration argues that it's possibly resuming long term down trend. In any case, outlook will stay bearish as long as 1.3212 resistance holds. Retest of 1.1946 should be seen next.
USD/CHF Daily Outlook
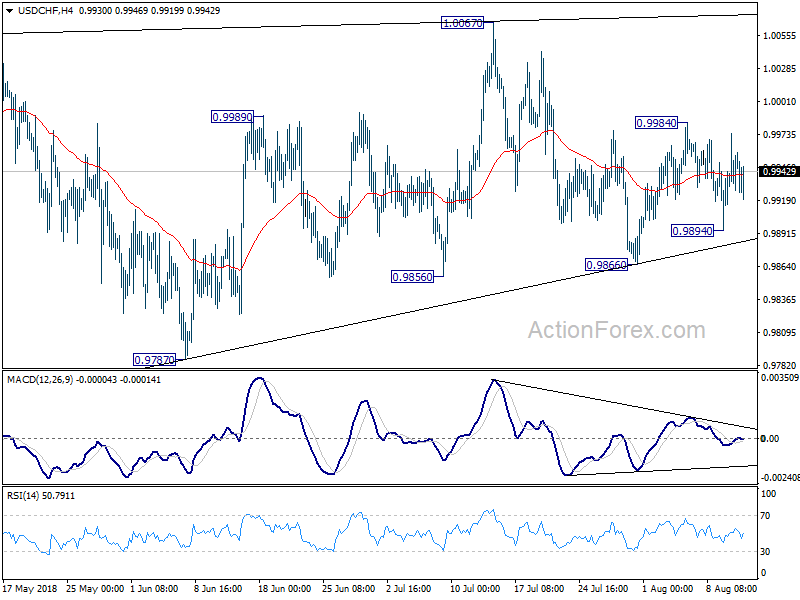
Daily Pivots: (S1) 0.9925; (P) 0.9950; (R1) 0.9979; More...
Intraday bias in USD/CHF remains neutral as it's staying in tight range of 0.9894/9984. On the upside, above 0.9984 will resume the rebound from 0.9866 to retest 1.0067 high. Decisive break there will resume whole rally from 0.9186. On the downside, below 0.9894 might extend the consolidation pattern from 1.0056 with another falling leg. But downside should be contained by 38.2% retracement of 0.9186 to 1.0056 at 0.9724 to bring rebound.
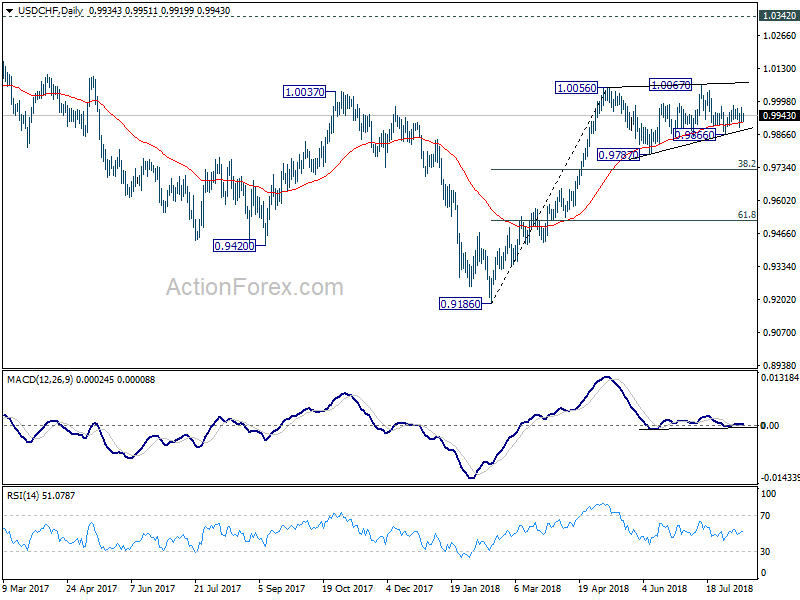
In the bigger picture, current development suggests that the consolidation pattern from 1.0056 is extending with another leg. As long as 38.2% retracement of 0.9186 to 1.0056 at 0.9724 holds, we'd expect rise from 0.9186 to resume at a later stage to retest 1.0342 key resistance (2016 high). However, sustained break of 0.9724 fibonacci level will bring deeper fall, as another declining leg in the long term range pattern.
USD/JPY Daily Outlook
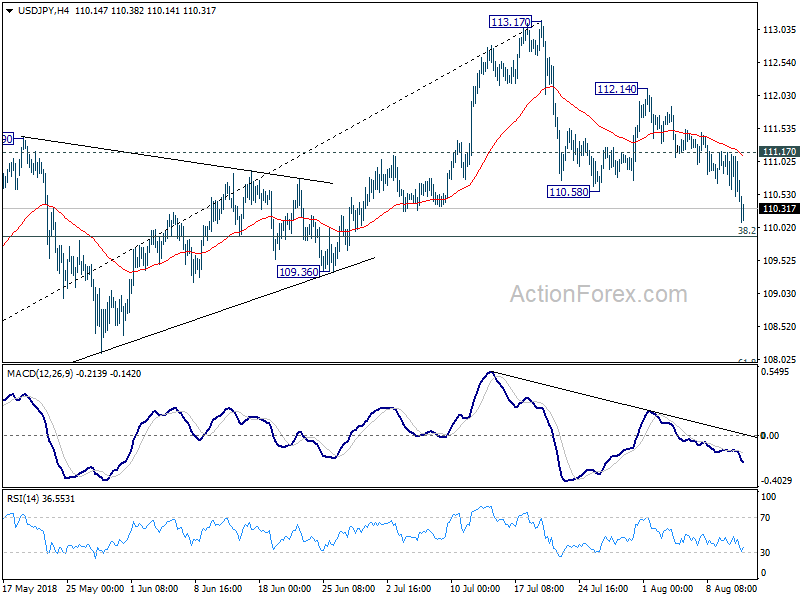
Daily Pivots: (S1) 110.57; (P) 110.87; (R1) 111.23; More...
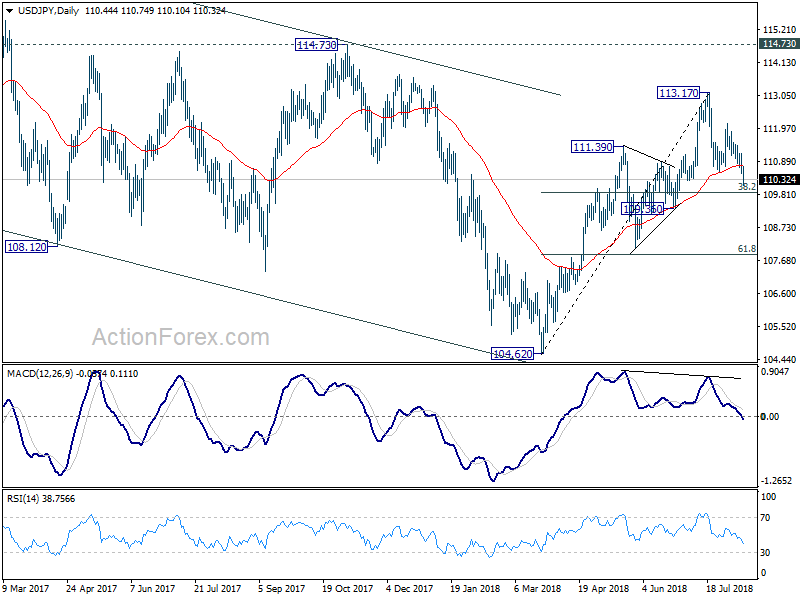
USD/JPY's correction from 113.17 extends lower to 110.10 so far today. Intraday bias stays mildly on the downside for deeper fall. At this point, we'd continue to expect strong support from 38.2% retracement of 104.62 to 113.17 at 109.90 to contain downside and bring rebound. On the upside, above 111.17 minor resistance will turn bias back to the upside. Further break of 112.14 will bring retest of 113.17 high. However, firm break of 109.90 will put focus on 109.36 key structural support level.
In the bigger picture, corrective fall from 118.65 (2016 high) should have completed with three waves down to 104.62. Decisive break of 114.73 resistance will likely resume whole rally from 98.97 (2016 low) to 100% projection of 98.97 to 118.65 from 104.62 at 124.30, which is reasonably close to 125.85 (2015 high). This will stay as the preferred case as long as 109.36 support holds.