Sample Category Title
EUR/USD Tumbles Below 1.1400, 1.1300 Next?
Key Highlights
- The Euro fell sharply recently and broke the 1.1440 and 1.1400 support levels against the US Dollar.
- There is a major bearish trend line forming with resistance at 1.1500 on the 4-hours chart of EUR/USD.
- The US CPI in July 2018 increased 0.2% (MoM), similar to the forecast and more than the last +0.1%.
- The yearly change came in at +2.9%, less than the forecast of +3.0%.
EURUSD Technical Analysis
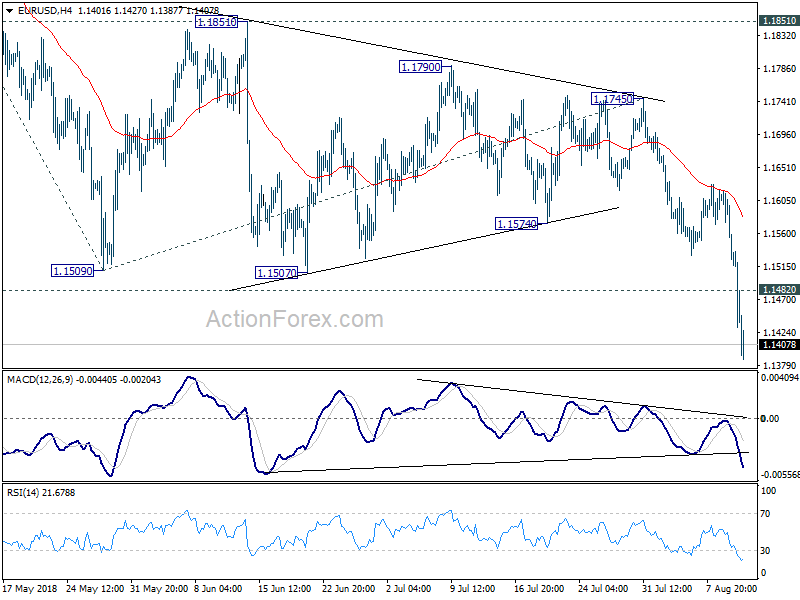
The Euro came under a lot of bearish pressure this past week after it settled below the 1.1520 support area against the US Dollar. The EUR/USD pair even fell below 1.1420 support and declined sharply.
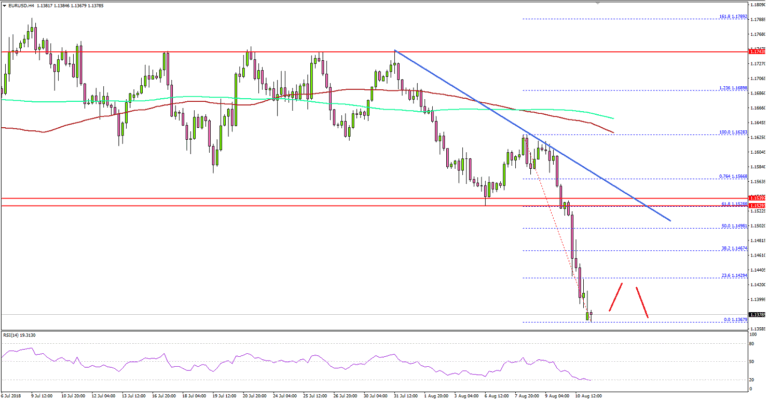
Looking at the 4-hours chart, the pair declined heavily during the past few sessions and sellers even managed to clear the 1.1400 support. The pair is now trading well below 1.1420 and 100 simple moving average (4-hour, red).
A new monthly low was formed at 1.1367 and the pair is currently consolidating losses. An initial resistance on the upside is near the 23.6% Fib retracement level of the last drop from the 1.1628 high to 1.1367 low.
Moreover, there is also a major bearish trend line forming with resistance at 1.1500 on the same chart. The trend line resistance coincides with the 50% Fib retracement level of the last drop from the 1.1628 high to 1.1367 low.
Therefore, if the pair corrects higher, it is likely to face sellers near the 1.1420, 1.1430 and 1.1480 resistance levels in the near term.
On the downside, the recent low of 1.1367 is a short term below. Below 1.1367, the pair may continue to decline towards the 1.1340 and 1.1300 levels.
Euro Touches Lowest In More Than A Year As Turkey Effect Continues
Turkey says it has an action plan
The EUR touched a 13-month low versus the US dollar as trading got underway this week, with markets preparing for more turmoil involving the Turkish lira. The seemingly unstoppable downward spiral in Turkey’s currency and economy is raising concerns about European banks’ exposures to the country helped spark contagion fears while safe haven flows saw German 10-year bond yields edge lower.
The EUR touched 1.1366, the lowest since July last year though has since rebounded as traders focused on comments from Turkish Finance Minister Berat Albayrak who said the country had drafted an action plan to ease investor concerns. He added that the banking watchdog had also limited swap transactions in the currency. There were no details on the so-called plan, so the bounce so far has been muted. The lira extended its weakening bias, hitting a new record low of 7.0081 versus the US dollar. EUR/USD is currently trading at 1.1381.
Oil attempts to keep its firmer bias
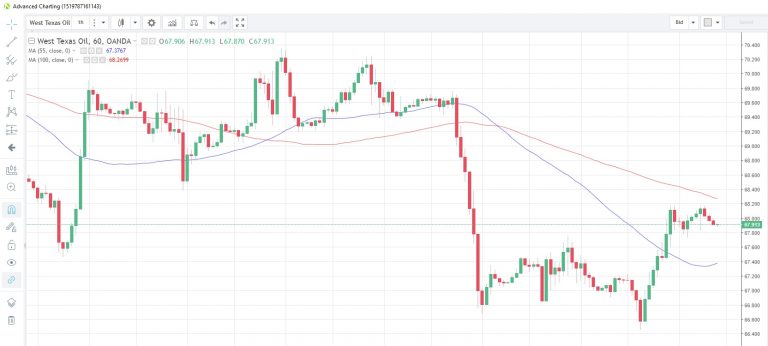
Tight supply conditions pushed oil prices higher as trading got under way though concerns about a possible near-term drop in demand capped gains. In the longer run, oil demand is seen rising to 1.5 million barrels per day in 2019, up from 1.4 million barrels per day this year, according to the monthly IEA market report released Friday. WTI is currently trading at 67.91 after touching 68.17 earlier. Near-term, WTI appears capped by the 100-hour moving average which currently sits at 68.27.
China data scheduled
We are awaiting some second-tier loans data from China this morning. Growth in new loans is expected to slow to 1.21 billion yuan in July while the M2 money supply is expected to advance 8.2% y/y that month. Foreign direct investment could also be released today.
Sentiment readings for Australia’s business conditions and business confidence are also due sometime this morning. The last readings were 15 and 6 respectively.
EURUSD – Bearish, Targets Further Downside
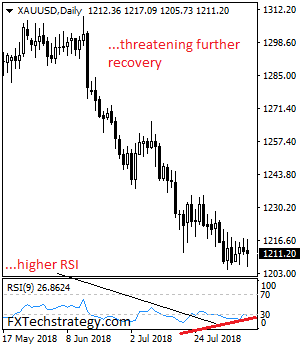
EURUSD - The pair looks to weaken further in the new week following its past week losses. On the upside, resistance comes in at 1.1550 level with a cut through here opening the door for more upside towards the 1.1600 level. Further up, resistance lies at the 1.1650 level where a break will expose the 1.1700 level. Conversely, support lies at the 1.1550 level where a violation will aim at the 1.1500 level. A break of here will aim at the 1.1450 level. Below here will open the door for more weakness towards the 1.1400. All in all, EURUSD faces further downside pressure
GOLD – Looks To Recover Higher On Corrective Recovery
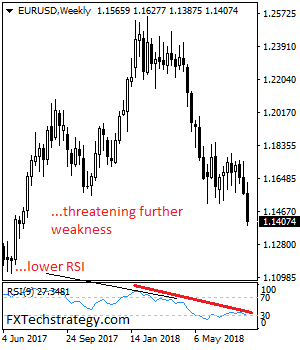
GOLD - The commodity continues to hold on to its recovery pressure. On the downside, support comes in at the 1,200.00 level where a break will turn attention to the 1,190.00 level. Further down, a cut through here will open the door for a move lower towards the 1,180.00 level. Below here if seen could trigger further downside pressure targeting the 1,170.00 level. Conversely, resistance resides at the 1,210.00 level where a break will aim at the 1,220.00 level. A turn above there will expose the 1,230.00 level. Further out, resistance stands at the 1,240.00 level. All in all, GOLD looks to weaken further.
Eco Data 8/13/18
[php_everywhere instance="1"]
Forex Forecast and Cryptocurrencies Forecast
First, a review of last week’s events:
EUR/USD. No matter how you see President Trump, the US economic policy demonstrates obvious success. Forecast for the US GDP in 2018 grows together with stock indexes, and the unemployment rate should go down by the middle of next year to the lowest level for the last 50 years. As a result of the US-led trade wars, the economies of the Eurozone and China have already begun to experience serious problems. Strengthening the success, Donald Trump is likely to increase import duties further, which allows American producers not to be afraid of the dollar strengthening.
At the same time, 88% of respondents interviewed by the Wall Street Journal expect that the Fed will increase interest rates four times this year. And it also fuels interest in the American currency.
And then the Turkish lira has hit the euro. Against the deterioration in US-Turkish relations over the past few days, it has "dried up" with respect to the dollar by about 25%.
It's no secret that a number of major European banks are lending to the Turkish economy, and a sharp reduction in the price of its currency can create serious difficulties for them. This is what an article in the Financial Times said, fueling panic. As a result, starting from Thursday August 9, the pair EUR/USD has sharply gone down.
Recall that 70% of the experts had voted that the pair would go down to the medium-term support 1.1505, which was reached by the pair on Friday. But it did not intend to stop there and fell another 120 points, groping for the local bottom at the level of 1.1385. At the end of the week's session, after a slight rebound, the pair was traded in the zone 1.1410;
GBP/USD. The future of the British pound looks even gloomier than a week ago. The statements of the British Secretary of State for International Trade Liam Fox about 60% probability of a hard version of Brexit sounded in unison with the speech of the head of the Bank of England Mark Carney and strengthened the pessimism of the market.
Last week, most analysts (70%) predicted a decline of the GBP/USD to the minimum values of the summer of 2017, which was what happened. The weekly low was fixed at 1.2720, and the end of the five-day period was at 1.2765;
USD/JPY. The expansion of the trade war between the US and China, combined with the Turkish crisis, play into the hands of the Japanese yen as a safe haven. As a result, it won back about 35 points from the dollar, finishing the week at around 110.90;
Cryptocurrencies. This market was still controlled by the bears. Moreover, their pressure has greatly increased. The market capitalization has fallen by about 10% and now stands at about $230 billion.
In our last week forecast, we indicated that the strongest support for bitcoin is in the $6,000-6,100 zone, the level when mining becomes almost unprofitable. This forecast was 100% true: on Thursday August 8, the pair BTC/USD reached the low at $6,125, after which it fought back and rose to the area of 6,500.
The Ethereum (ETH) lost about 14.5% in the week, Litecoin (LTH) - 22%, ripple (XRP) - more than a quarter of its value.
As for the forecast for the coming week, summarizing the opinions of a number of analysts, as well as forecasts made on the basis of a variety of methods of technical and graphical analysis, we can say the following:
The main factors that determine the movement of dollar pairs for the near future, have been described above. As for the EUR/USD, 60% of analysts believe that the dollar will continue to strengthen, and the pair will go down. Graphical analysis on H4 and D1, most indicators agree with this development. The target is the zone 1.1120-1.1300.
On the other hand, 40% of the experts have voted that the pair will be able to stay in the echelon 1.1370-1.1515 in the near future, which is confirmed by signals that it is oversold, which are filed by 15% of the oscillators;
GBP/USD. Zone 1.2770 is a fairly strong level of support/resistance, which the pair repeatedly tested in both 2016 and 2017.
55% of experts believe that the negative momentum of the pair will continue for some time, and it may drop to support 1.2675-1.2720. As for the remaining 45% of analysts, in their opinion, the pair is already expecting a corrective retreat to the upper boundary of the medium-term downward channel in the zone 1.2940. And only after having reached this height, it will turn around and continue its movement to the south. Both graphical analysis and 20% of oscillators that signal the that this pair is oversold agree with this scenario;
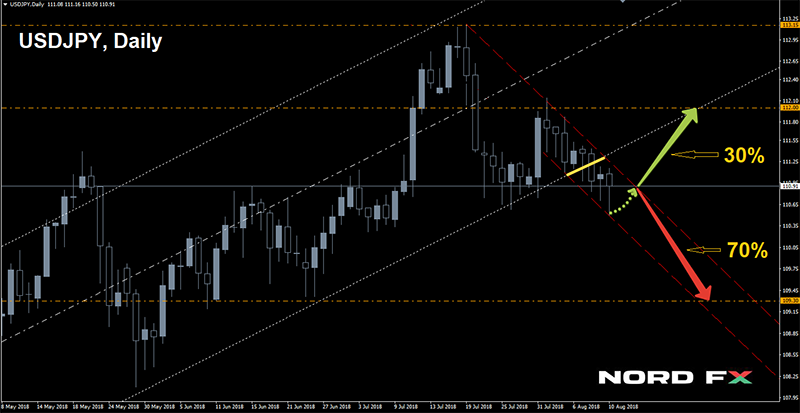
USD/JPY. If you look at the graphs on the time frames D1 and W1, you can see the expected breakdown of the lower boundary of the medium-term channel, which began at the end of last March. It is still too early to consider this a breakthrough, but almost 70% of experts, supported by graphical analysis on H4, believe that the strengthening of the yen, as a safe haven, will continue, and the pair will drop to at least 110.30. The next support is 100 points lower.
On the other hand, the Pivot Point area of the last 12 months can be considered the zone of 111.60-110.80, which indicates the possibility of the pair rebounding upwards - to the resistance of 112.00-112.25, with which 30% of analysts and the graphic analysis on D1 agree;
Cryptocurrencies. Negative sentiment in this market is constantly fueled by negative publications in the media. Thus, Nobel laureate Paul Krugman has predicted in his article in the New York Times, a complete collapse for the entire cryptocurrency market. The reason is the high cost of transactions with virtual money, which makes it unprofitable to use it in trading operations. According to Bloomberg, the volume of commercial operations with bitcoin around the world in May fell to a meager amount of $60 million.
Another publication, in the Wall Street Journal, confirms the version that the volatility of cryptocurrencies is not subject to any economic justification. For example, their rate is influenced by the actions of organized groups of "gray traders" that are created in social networks, such as Telegram. According to the WSJ version, 175 cases of such market manipulation were registered in half a year, when a sharp jump up of the cryptocurrency is followed by a sharp collapse. This manipulation has been called "Pump and Dump".
As for the near future of the pair BTC/USD, it is possible that it may linger in the $5.760-6.800 zone for some time. This is expected, of course, if the week does not bring any important news - either real, or "inflated" according to the " Pump and Dump" scheme. It is important to note that the level of 5.760 is the support that the pair could not overcome from the very beginning of its fall on December 17, 2017.
EUR/USD Weekly Outlook
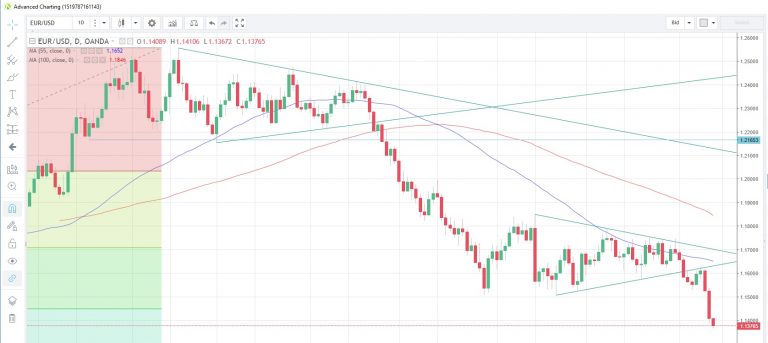
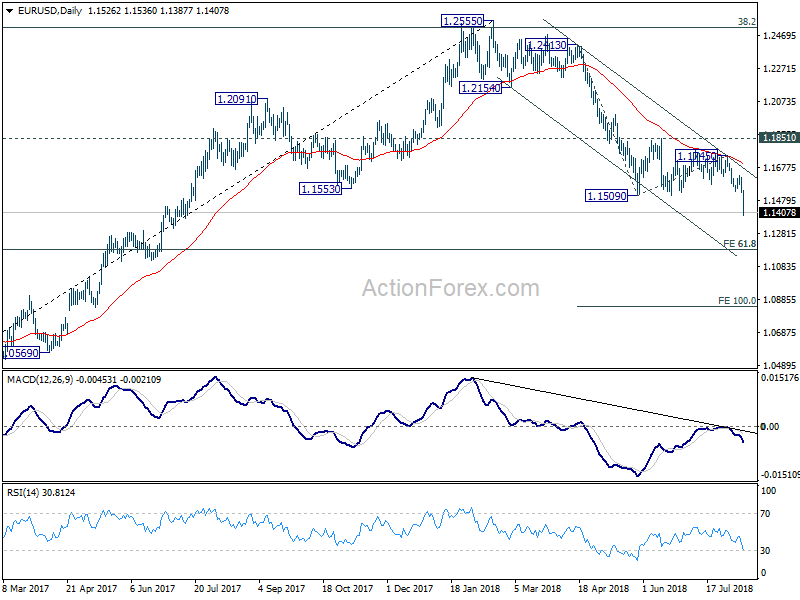
EUR/USD dropped to as low as 1.1387 last week. The firm break of 1.1509 support finally confirmed resumption of down trend from 1.2555. Initial bias stays on the downside this week. Deeper fall should be seen to 61.8% projection of 1.2413 to 1.1509 from 1.1745 at 1.1186. Note that it's a cluster level with 61.8% retracement of 1.0339 to 1.2555 at 1.1186. Hence, we'll tentatively look for short term bottoming around 1.1186. On the upside, above 1.1482 minor resistance will turn bias neutral and bring consolidations first, before staging another decline.
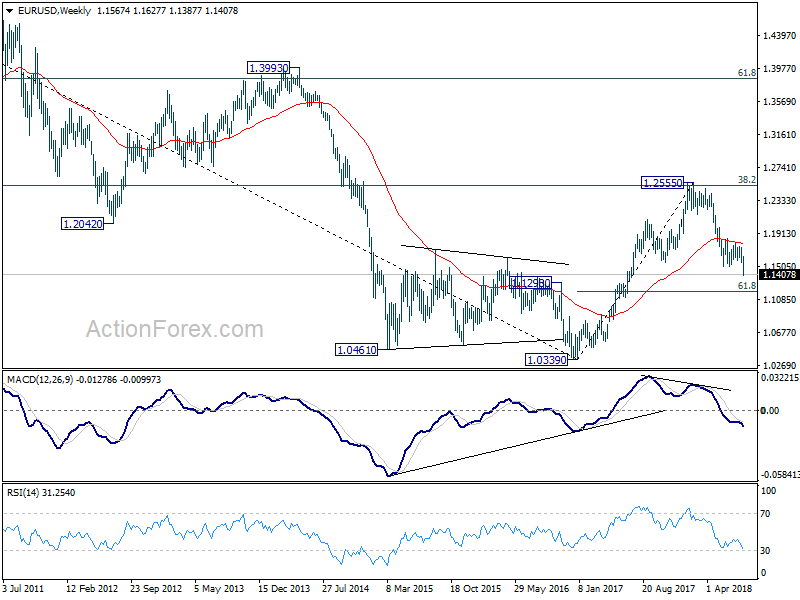
In the bigger picture, the down trend from 1.2555 medium term is in progress for 61.8% retracement of 1.0339 to 1.2555 at 1.1186. Note again that EUR/USD was rejected by 38.2% retracement of 1.6039 (2008 high) to 1.0339 (2017 low) at 1.2516. That carries some long term bearish implications. Sustained break of 1.1186 could pave the way back to retest 1.0339 low. For now, outlook will remain bearish as long as 1.1851 resistance holds, even in case of strong rebound.
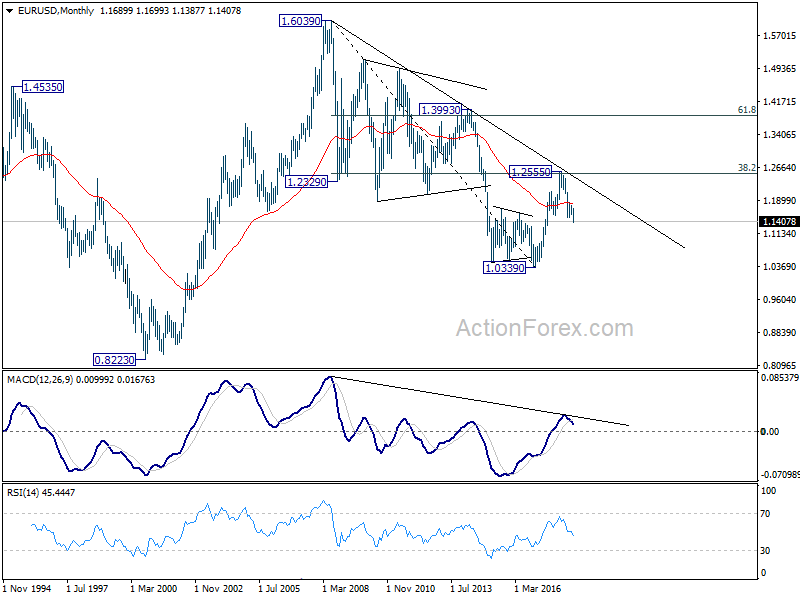
In the long term picture, the rejection from 38.2% retracement of 1.6039 to 1.0339 at 1.2516 argues that long term down trend from 1.6039 (2008 high) might not be over yet. EUR/USD is also held below decade long trend line resistance. Sustained trading below 55 week EMA adds bearishness to the case. Firm break of 61.8% retracement of 1.0339 to 1.2555 at 1.1186 should at least bring a retest on 1.0339 low.
USD/JPY Weekly Outlook
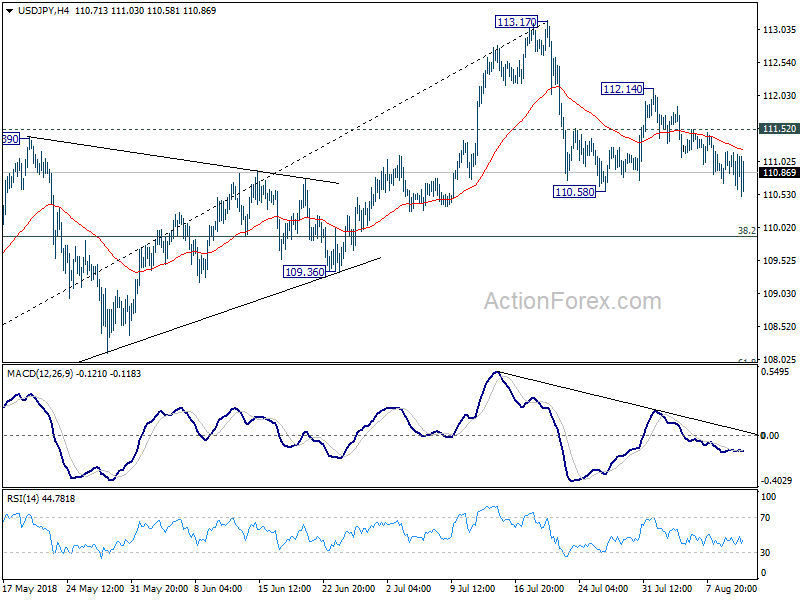
USD/JPY gyrated lower last week as as the corrective pattern from 113.17 extended. Initial bias is mildly on the downside this week for deeper fall. But we'd expect strong support from 38.2% retracement of 104.62 to 113.17 at 109.90 to contain downside and bring rebound. On the upside, above 111.52 minor resistance will turn bias back to the upside. Further break of 112.14 will bring retest of 113.17 high.
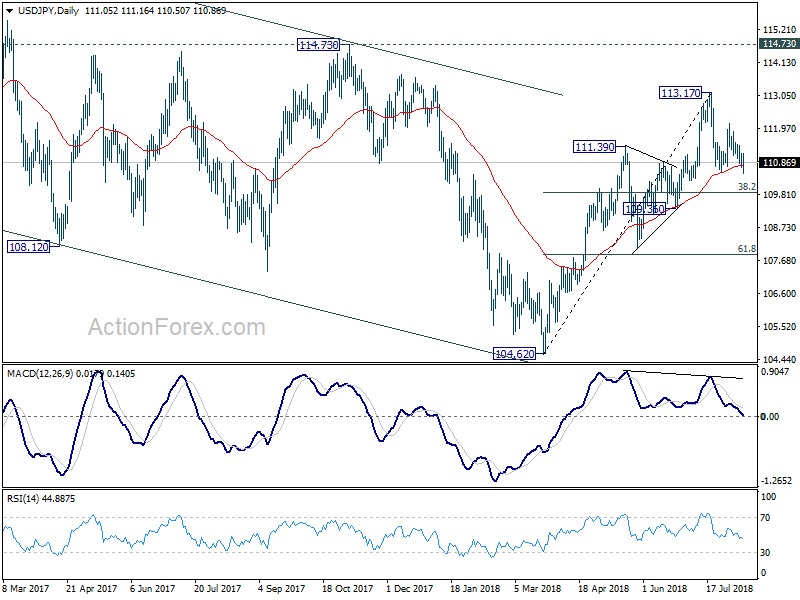
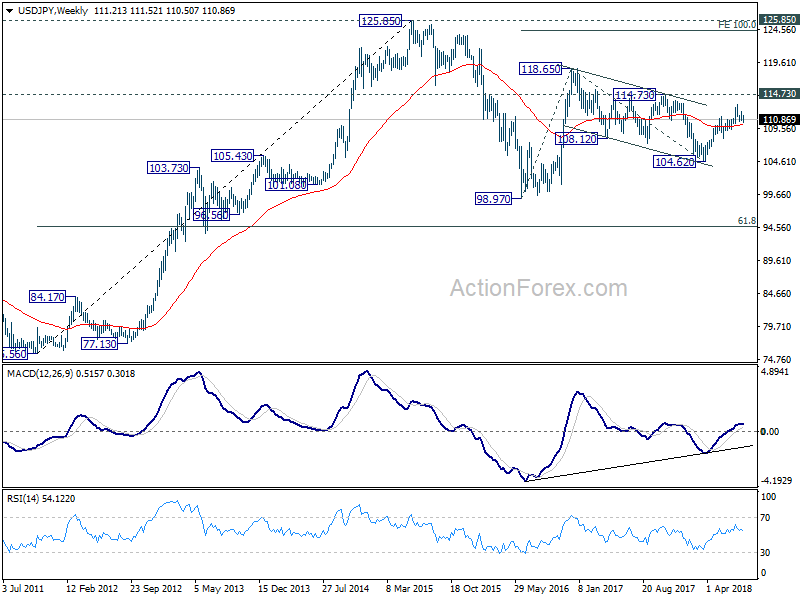
In the bigger picture, corrective fall from 118.65 (2016 high) should have completed with three waves down to 104.62. Decisive break of 114.73 resistance will likely resume whole rally from 98.97 (2016 low) to 100% projection of 98.97 to 118.65 from 104.62 at 124.30, which is reasonably close to 125.85 (2015 high). This will stay as the preferred case as long as 109.36 support holds.
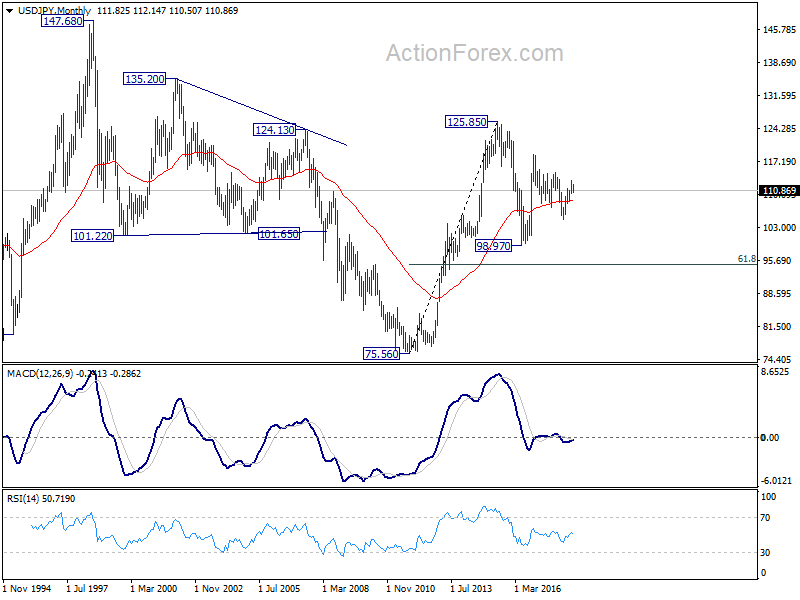
In the long term picture, the rise from 75.56 (2011 low) long term bottom to 125.85 top is viewed as an impulsive move, no change in this view. Price actions from 125.85 are seen as a corrective move which could still extend. In case of deeper fall, downside should be contained by 61.8% retracement of 75.56 to 125.85 at 94.77. Up trend from 75.56 is expected to resume at a later stage for above 135.20/147.68 resistance zone.
GBP/USD Weekly Outlook
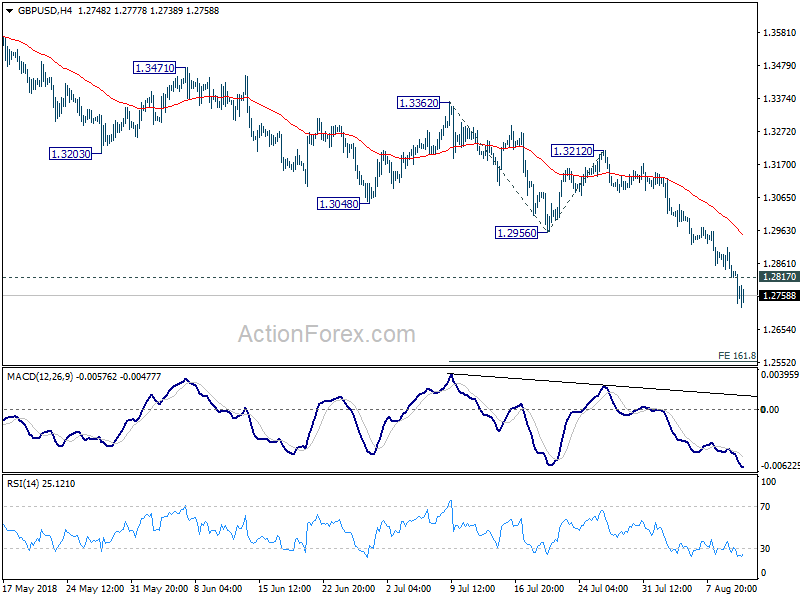
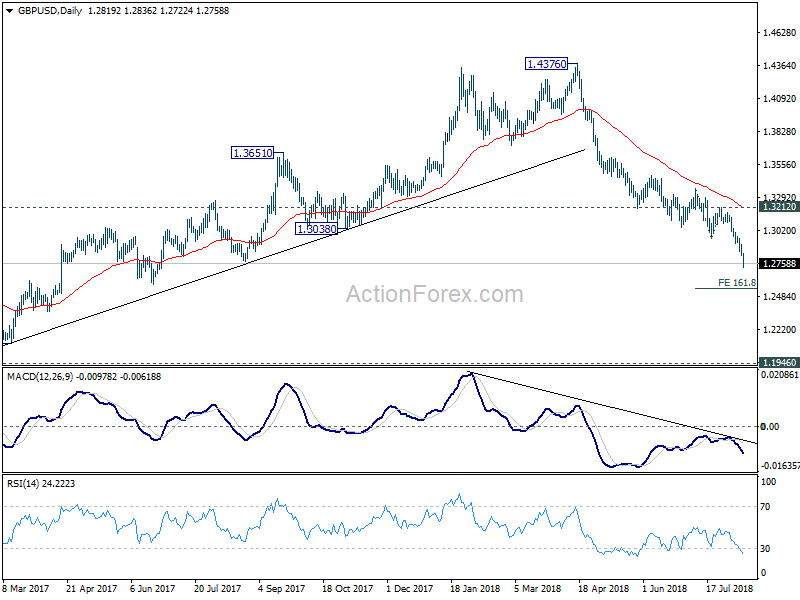
GBP/USD fell to as low as 1.2722 last week as the decline from 1.4376 resumed. Initial bias stays on the downside this week for 161.8% projection of 1.3362 to 1.2956 from 1.3212 at 1.2555 next. On the upside, above 1.2817 minor resistance will turn intraday bias neutral and bring consolidations. But recovery should be limited by 1.2956 support turned resistance to bring fall resumption.
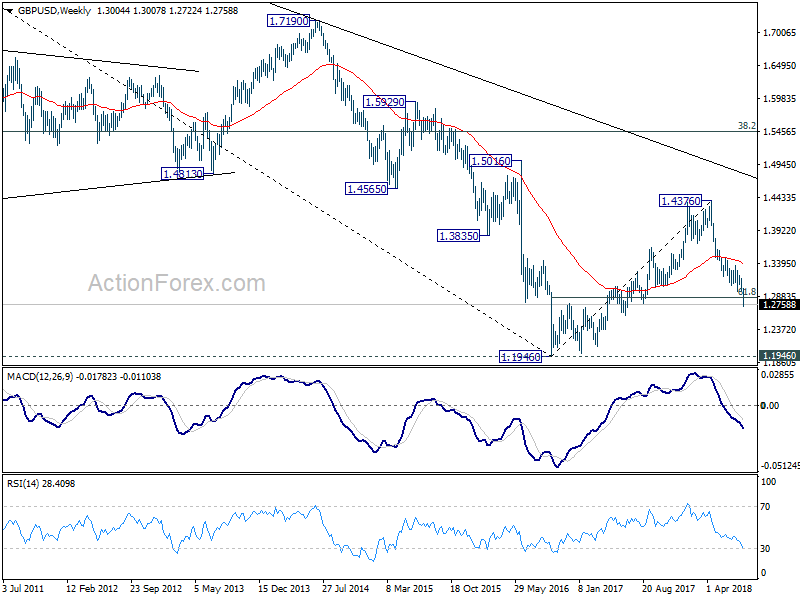
In the bigger picture, whole medium term rebound from 1.1946 (2016 low) should have completed at 1.4376 already, after rejection from 55 month EMA (now at 1.4141). Current downside acceleration argues that it's possibly resuming long term down trend. In any case, outlook will stay bearish as long as 1.3212 resistance holds. Retest of 1.1946 should be seen next.
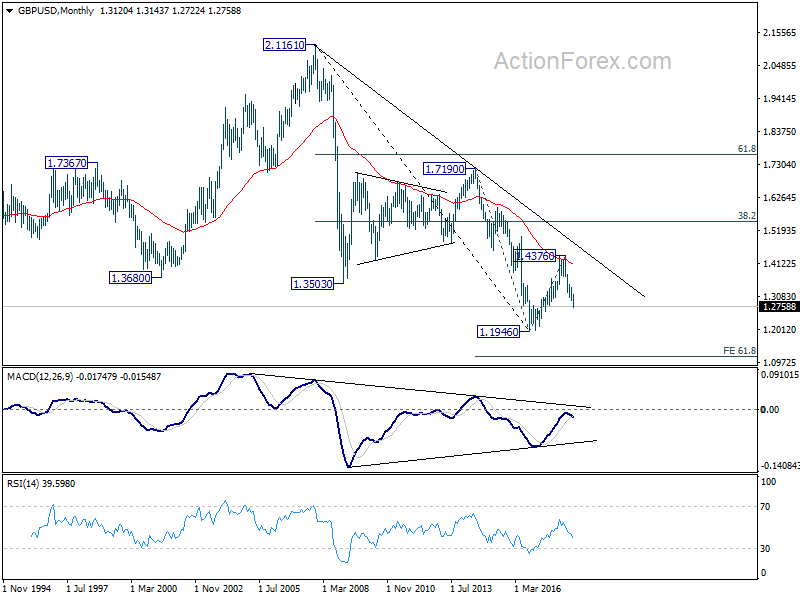
In the longer term picture, outlook in GBP/USD is held bearish. Rebound from 1.1946 was rejected solidly by falling 55 month EMA. The pair was limited well below 38.2% retracement of 2.1161 (2007 high) to 1.1946, as well as the decade long falling trend line. On break of 1.1946, next target will be 61.8% projection of 1.7190 to 1.1946 from 1.4376 at 1.1135.
USD/CHF Weekly Outlook
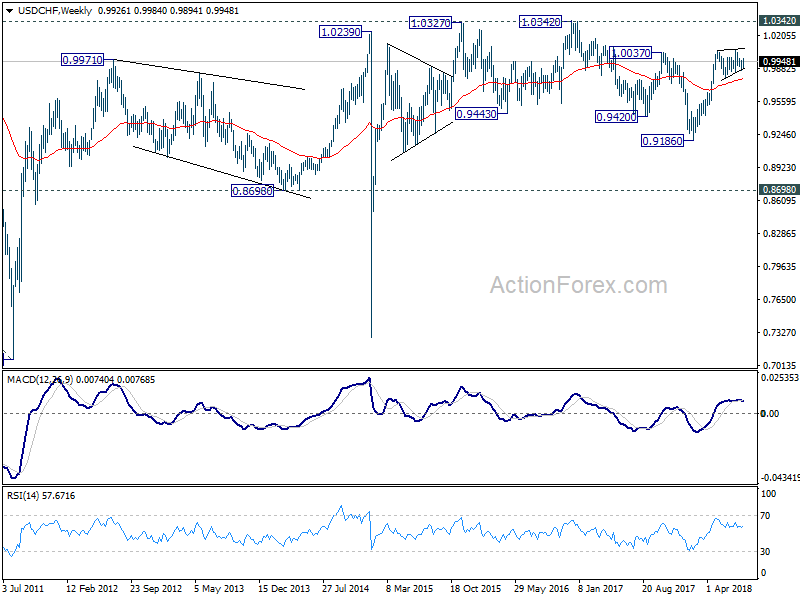
Despite edging higher to 0.9984 last week, USD/CHF failed to extend gain and turned sideway. Initial bias remains neutral this week first. On the upside, above 0.9984 will resume the rebound from 0.9866 to retest 1.0067 high. Decisive break there will resume whole rally from 0.9186. On the downside, below 0.9894 might extend the consolidation pattern from 1.0056 with another falling leg. But downside should be contained by 38.2% retracement of 0.9186 to 1.0056 at 0.9724 to bring rebound.
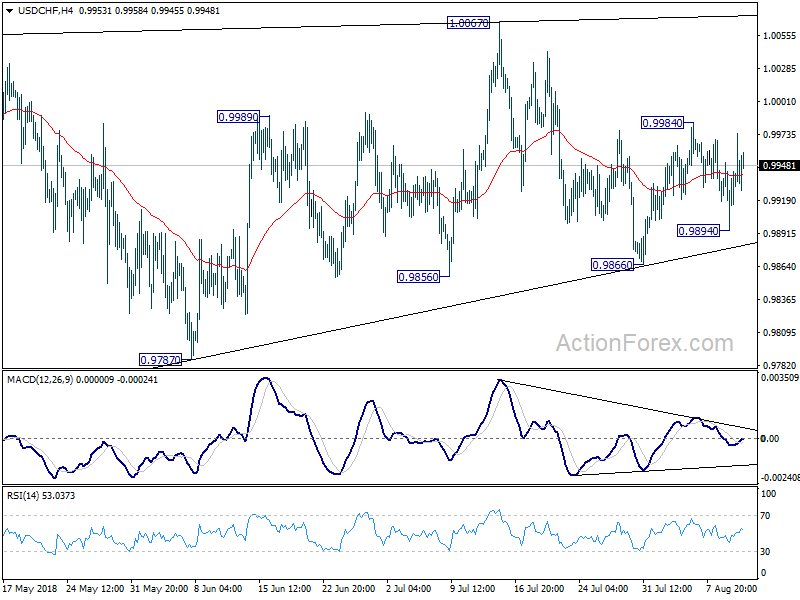
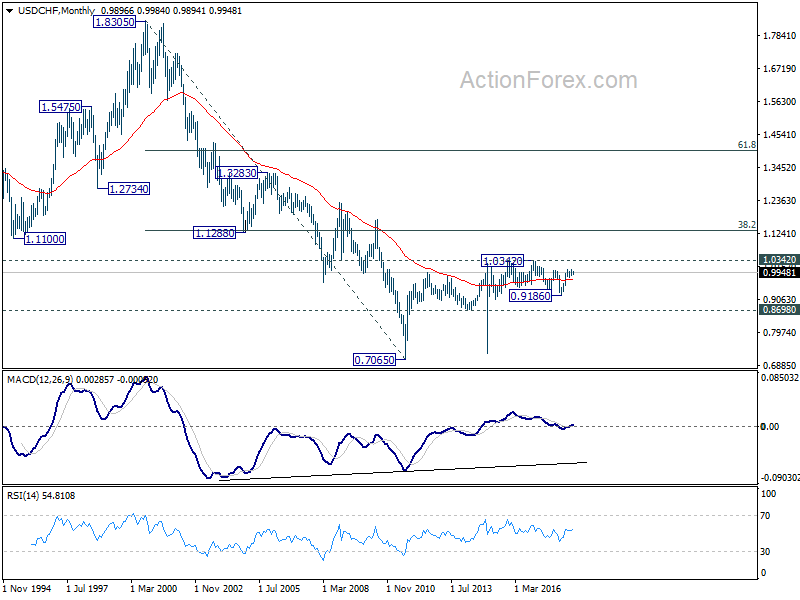
In the bigger picture, current development suggests that the consolidation pattern from 1.0056 is extending with another leg. As long as 38.2% retracement of 0.9186 to 1.0056 at 0.9724 holds, we'd expect rise from 0.9186 to resume at a later stage to retest 1.0342 key resistance (2016 high). However, sustained break of 0.9724 fibonacci level will bring deeper fall, as another declining leg in the long term range pattern.
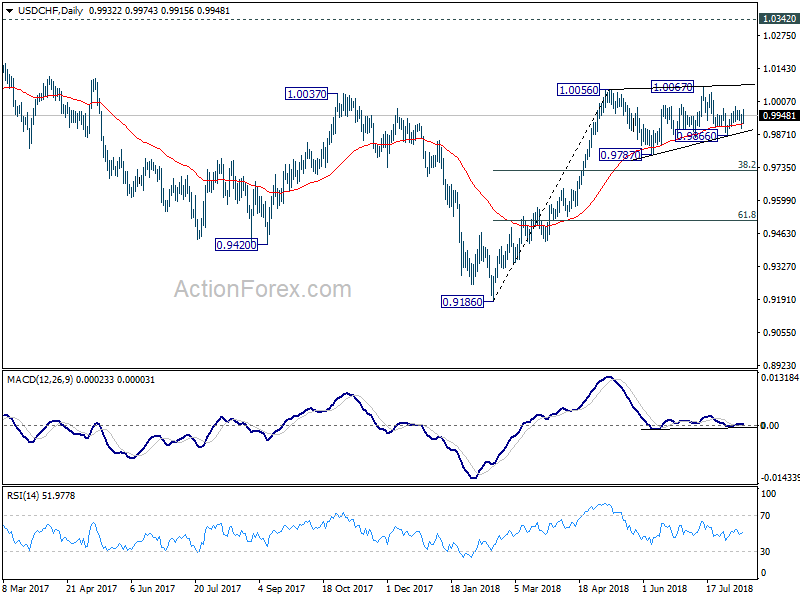
In the long term picture, price actions from 0.7065 (2011 low) are not clearly impulsive yet. Thus, we'll treat it as developing into a corrective pattern, at least, until a firm break of 1.0342 resistance.