

Sample Category Title
AUD/USD Weekly Outlook
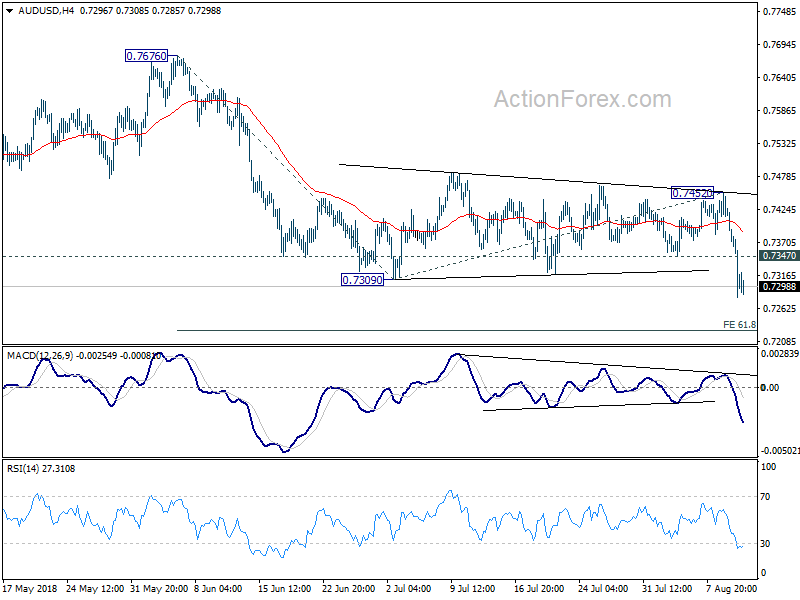
AUD/USD dropped to as low as 0.7279 last week and the break of 0.7309 low finally indicates resumption of down trend from 0.8135. Initial bias stays on the downside this week for 61.8% projection of 0.7676 to 0.7309 from 0.7452 at 0.7225 first. Break will target 100% projection at 0.7085 next. On the upside, above 0.7347 minor resistance will turn intraday bias and bring consolidation. But recovery should be limited below 0.7452 resistance to bring fall resumption.
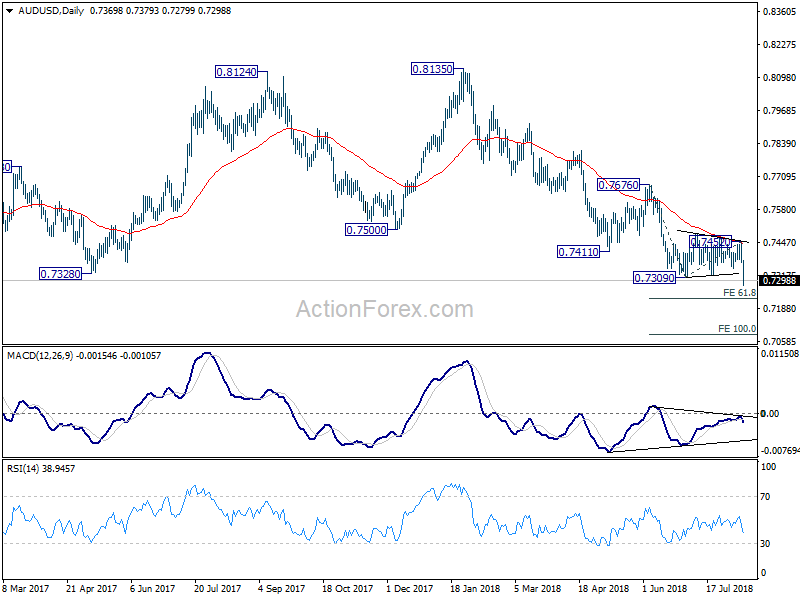
In the bigger picture, medium term rebound from 0.6826 (2016 low) is seen as a corrective move that should be completed at 0.8135. Sustained break of 0.7328 cluster support (61.8% retracement of 0.6826 to 0.8135 at 0.7326) should pave the way to retest 0.6826. There is prospect of resuming long term down trend from 1.1079 (2011 high). But we'll look at downside momentum to assess at a later stage. On the upside, break of 0.7452 resistance might indicate medium term bottoming. But we'll continue to favor the bearish view as long as 0.7676 resistance holds.
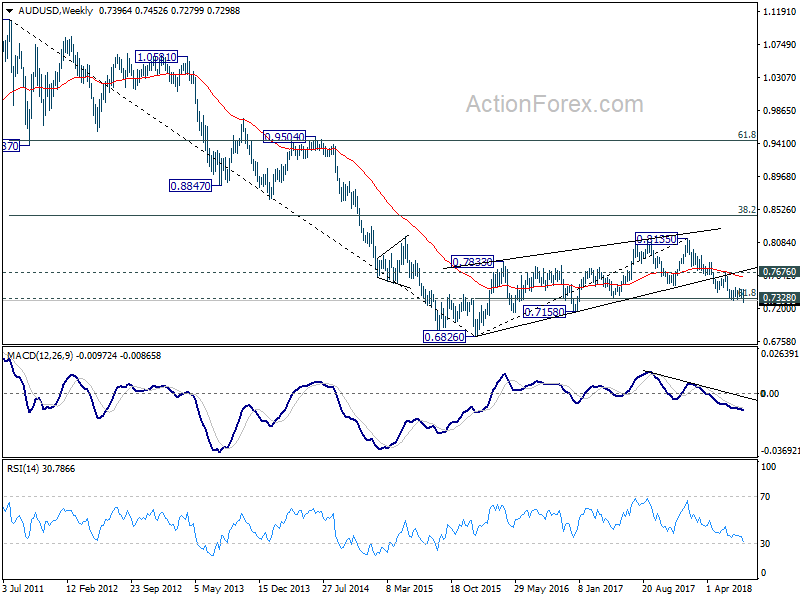
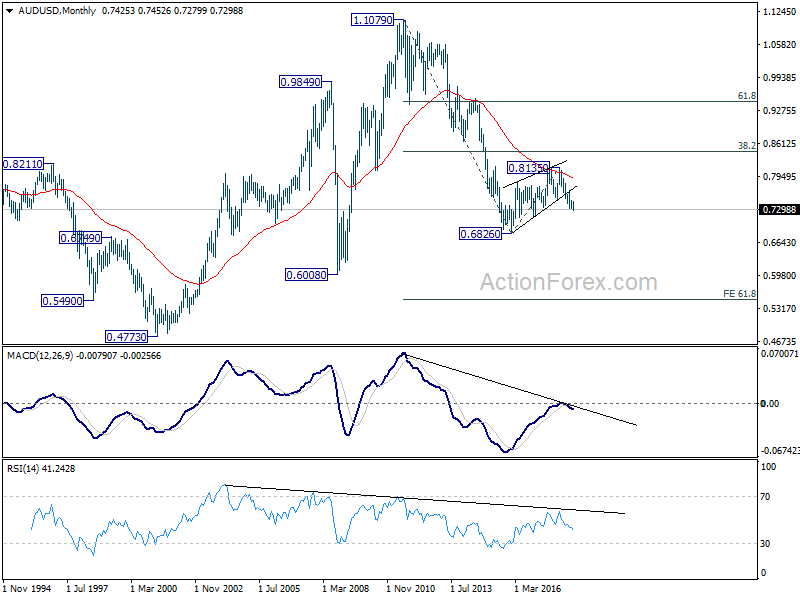
In the longer term picture, rebound from 0.682 (2016 low) should have completed at 0.8135 already. Failure to reach 38.2% retracement of 1.1079 (2011 high) to 0.6826 at 0.8451 carries bearish implications. This is also supported by the corrective structure from 0.6826 to 0.8135, as well as the rejection by 55 month EMA. The down trend from 1.1079 is in favor to extend. On break of 0.6826, next target will be 61.8% projection of 1.1079 to 0.6826 from 0.8135 at 0.5507.
USD/CAD Weekly Outlook
Despite some interim jitters, USD/CAD's rebound from 1.2961 last week suggests that correction from 1.3385 has completed with three waves down to 1.2961. It's also kept inside medium term rising channel. Initial bias is now on the upside this week for 1.3289 resistance next. Break will argue that rise from 1.2061 is resuming through 1.3385 high. On the downside, though, break of 1.3035 minor support will dampen this bullish view and turn focus back to 1.2961 low.
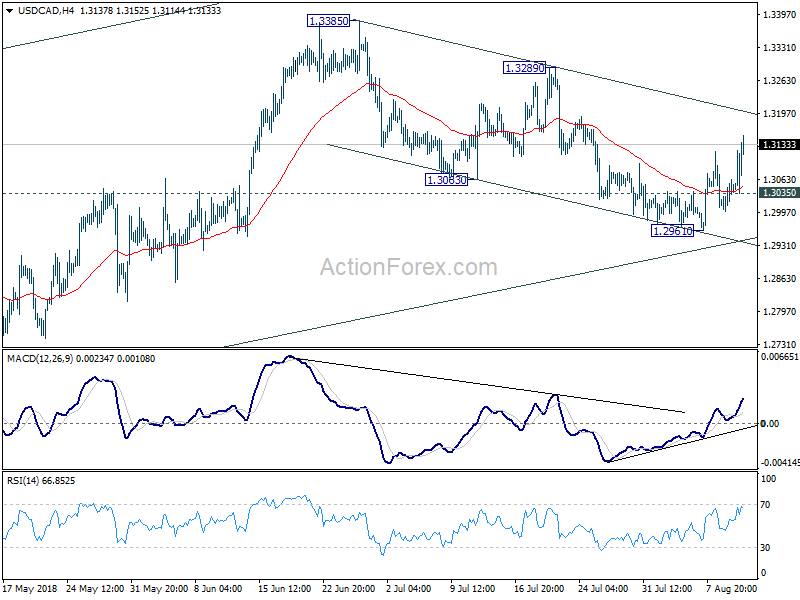
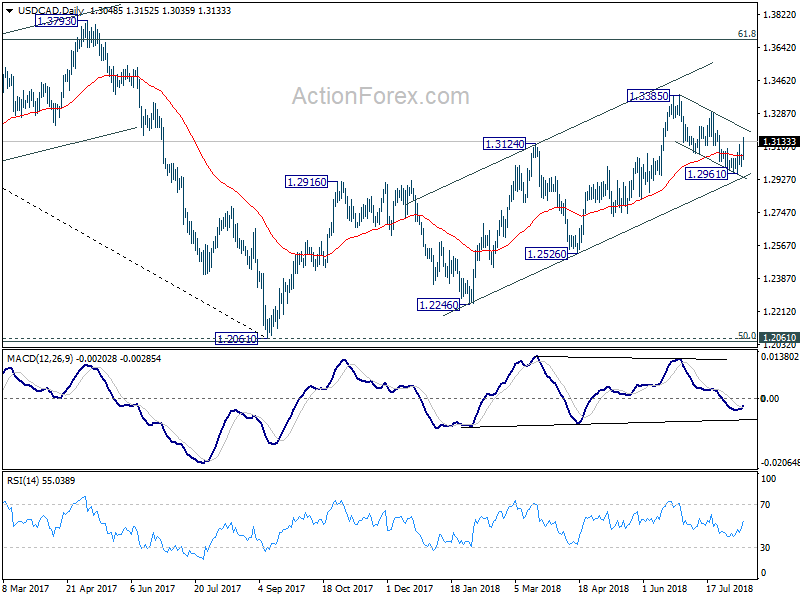
In the bigger picture, as long as channel support (now at 1.2911) holds, we're holding to the bullish view. That is, fall from 1.4689 (2015 high) has completed at 1.2061, ahead of 50% retracement of 0.9406 (2011 low) to 1.4689 (2015 high) at 1.2048. Further rally should be seen for 61.8% retracement of 1.4689 to 1.2061 at 1.3685 and above. However, sustained break of the channel support will argue that rise from 1.2061 has completed and will bring deeper fall to 1.2526 support to confirm.
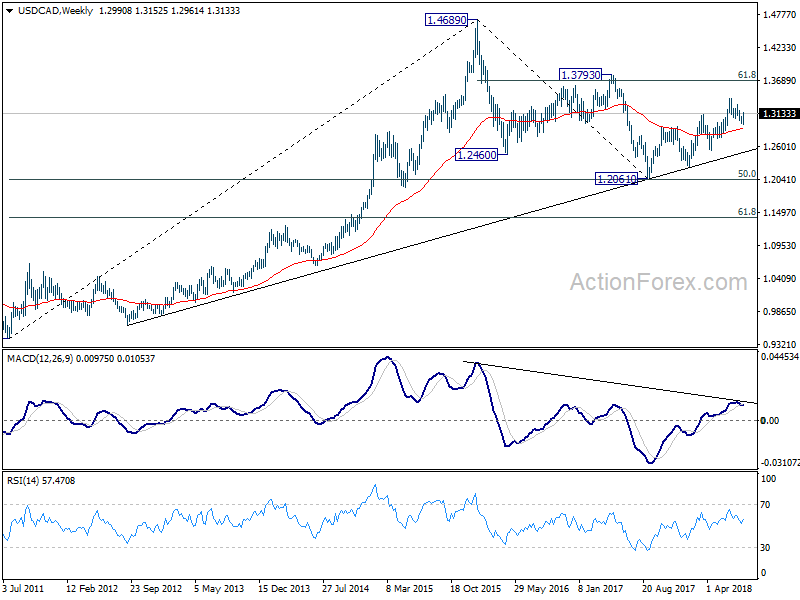
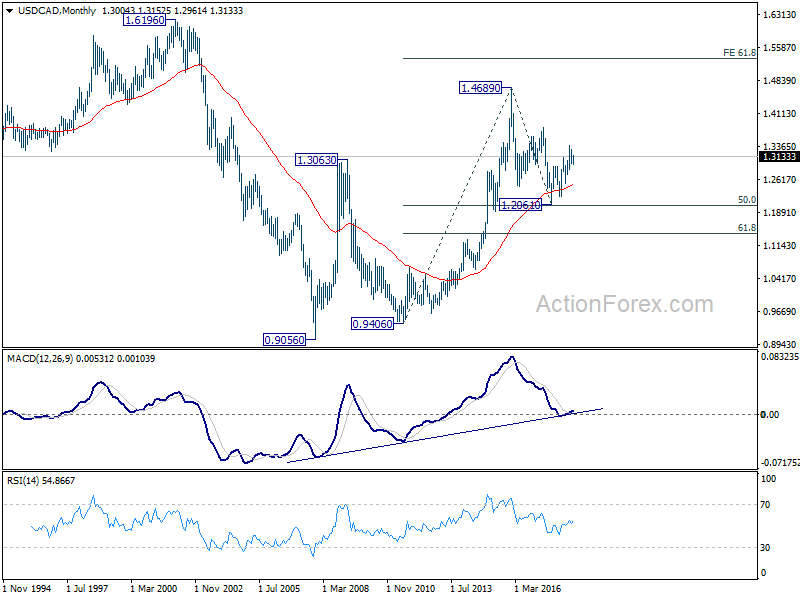
In the longer term picture, corrective fall from 1.4689 (2015 high) should have completed with three waves down to 1.2061, just ahead of 50% retracement of 0.9406 (2011 low) to 1.4689 (2015 high) at 1.2048. The development keeps long term up trend from 0.9406 and that from 0.9056 (2007 low) intact. It's early to tell, but there is now prospect of extending the long term up trend to 61.8% projection of 0.9406 to 1.4689 from 1.2061 at 1.5326 in medium to long term.
GBP/JPY Weekly Outlook
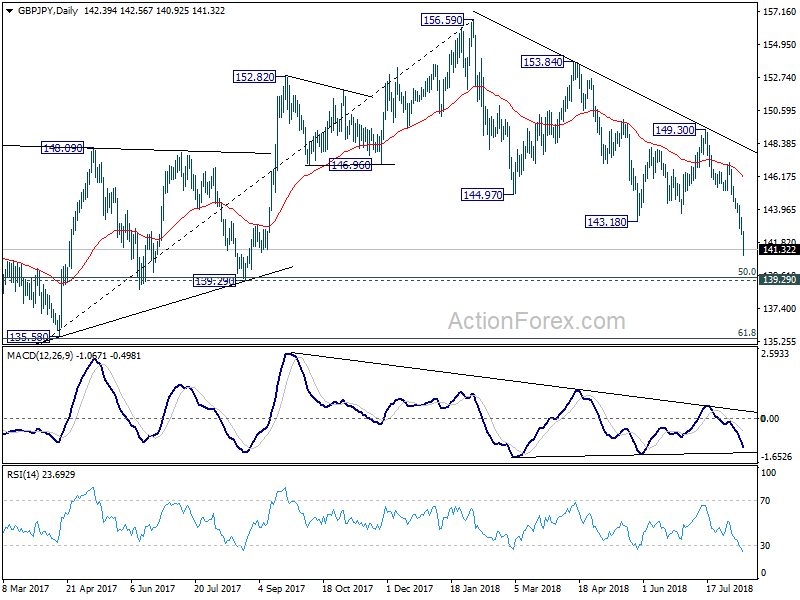
GBP/JPY dropped sharply to as low as 140.92 last week. Strong break of 143.18 support confirmed resumption of whole decline from 156.59. Initial bias stays on the downside this week for 139.29/47 key support level. We'll pay attention to bottoming signal around that level. On the upside, break of 143.48 resistance is needed to indicate short term bottoming. Otherwise, outlook will remain bearish in case of recovery.

In the bigger picture, at this point decline from 156.59 is still seen as a corrective move. But the current downside accelerate makes this view shaky. Focus will be on 139.29 cluster support (50% retracement of 122.36 to 156.59 at 139.47). Strong rebound from there will re-affirm the bullish case that rise from 122.36 is still to extend through 156.59 high. However, sustained break of 139.29/47 should confirm medium term reversal. GBP/JPY would then target a retest on 122.26 (2016 low).
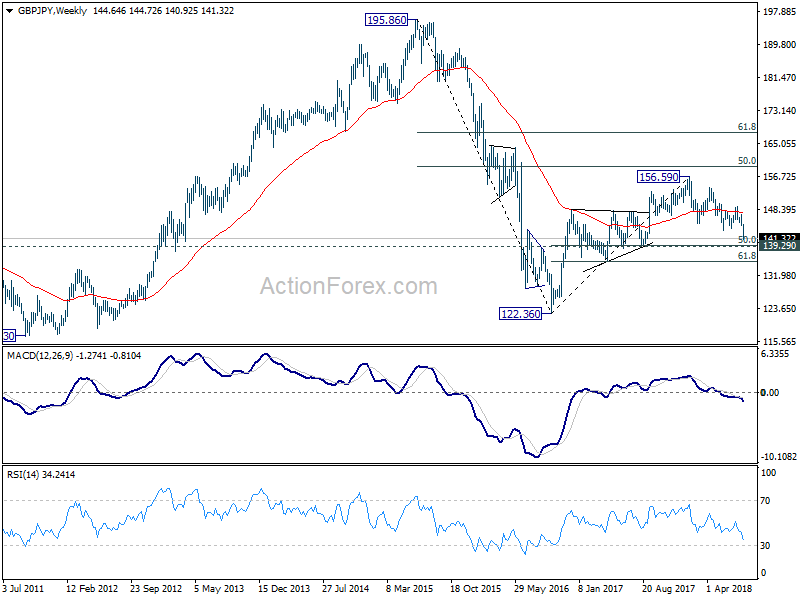
In the longer term picture, the failure to sustain above 55 month EMA (now at 152.88) is mixing up the outlook. Nonetheless, as long as 139.29 holds, rise from 122.36 is in favor to extend to 50% retracement of 195.86 (2015high) to 122.36 (2016 low) at 159.11, and possibly further to 61.8% retracement at 167.78 before completion. However, firm break of 139.29 will turn focus back to 116.83/122.36 support zone instead.

EUR/JPY Weekly Outlook
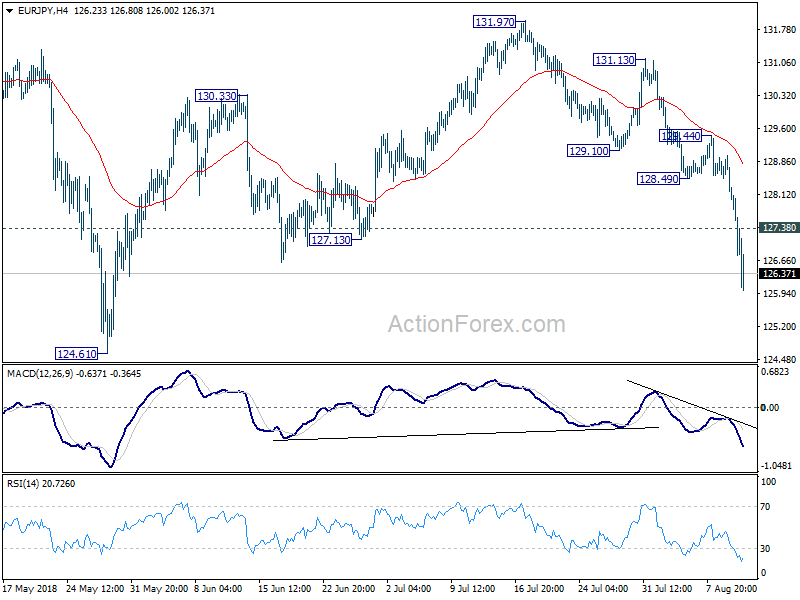
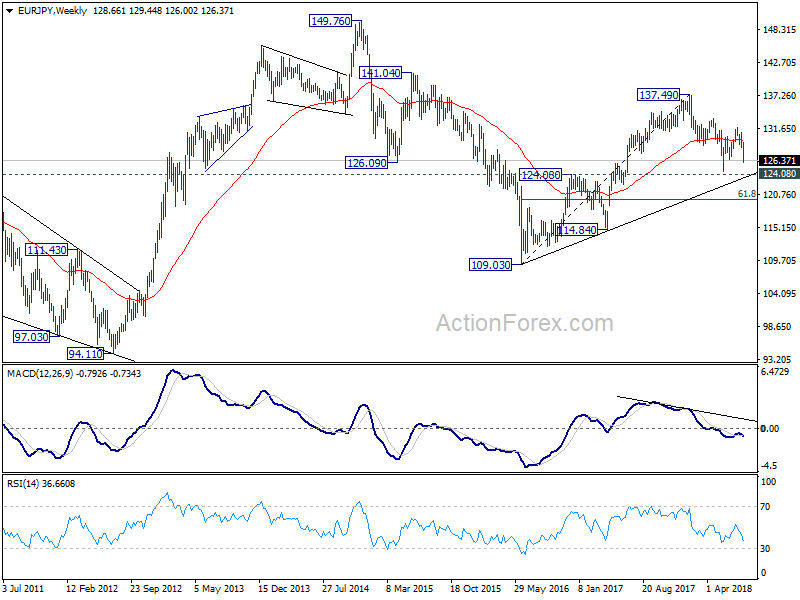
EUR/JPY dropped sharply to as low as 126.00 last week. The solid break of 127.13 support confirmed our view that corrective rise from 124.61 has completed with three waves up to 131.97. And more importantly, the whole fall from 137.49 is likely resuming. Initial bias remains on the downside this week for 124.61 . On the upside, above 127.38 minor resistance will turn intraday bias neutral first. But recovery should be limited below 128.49 support turned resistance to bring another fall.
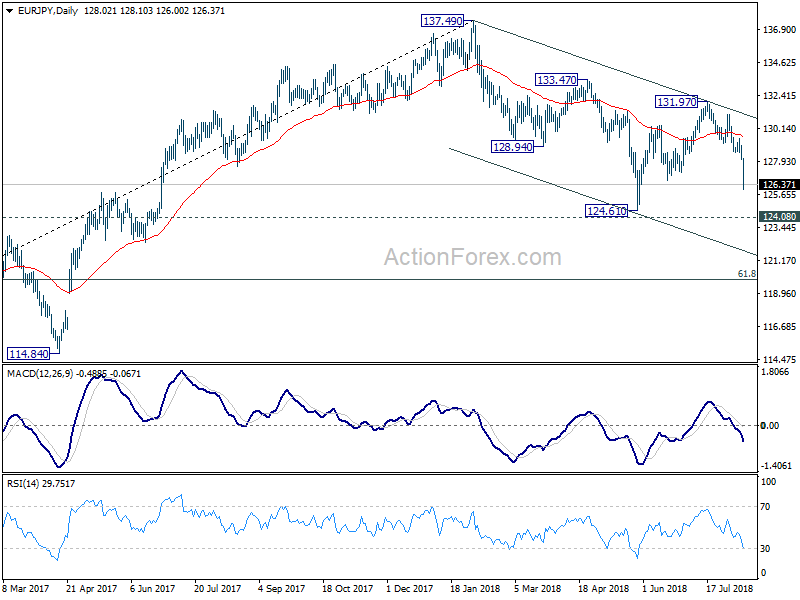
In the bigger picture, focus is back on 124.08 key resistance turned support. Decisive break there will argue that whole rise from 109.03 (2016 low) has completed at 137.49. Deeper decline would be seen to 61.8% retracement of 109.03 to 137.49 at 119.90 next. Sustained break there will pave the way to 109.03 and below. Meanwhile, rebound from 124.08 will keep medium term bullishness intact for another high above 137.49.
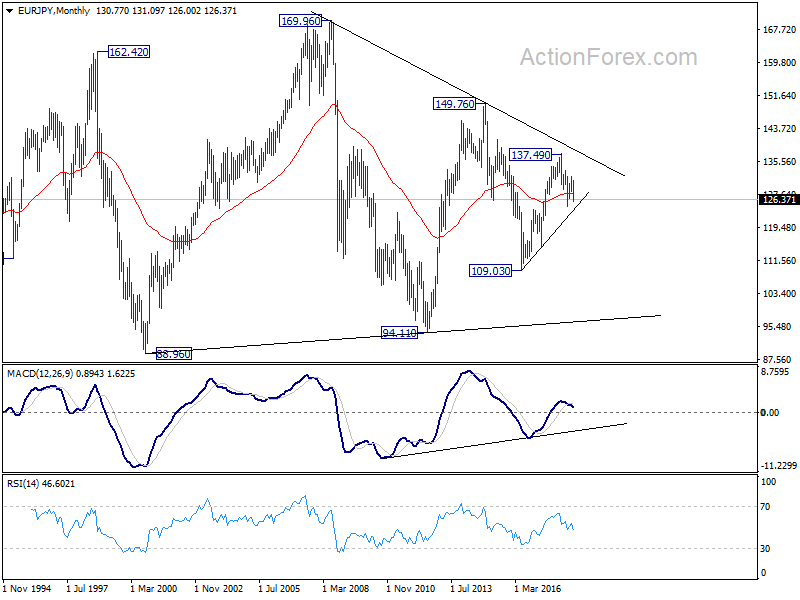
In the long term picture, at this point, EUR/JPY is staying in long term sideway pattern, established since 2000. Rise from 109.03 is seen as a leg inside the pattern. As long as 124.08 support holds, further rally is in favor in medium to long term through 149.76 high. However, break of 124.08 could extend the fall through 109.03 low instead.
EUR/GBP Weekly Outlook
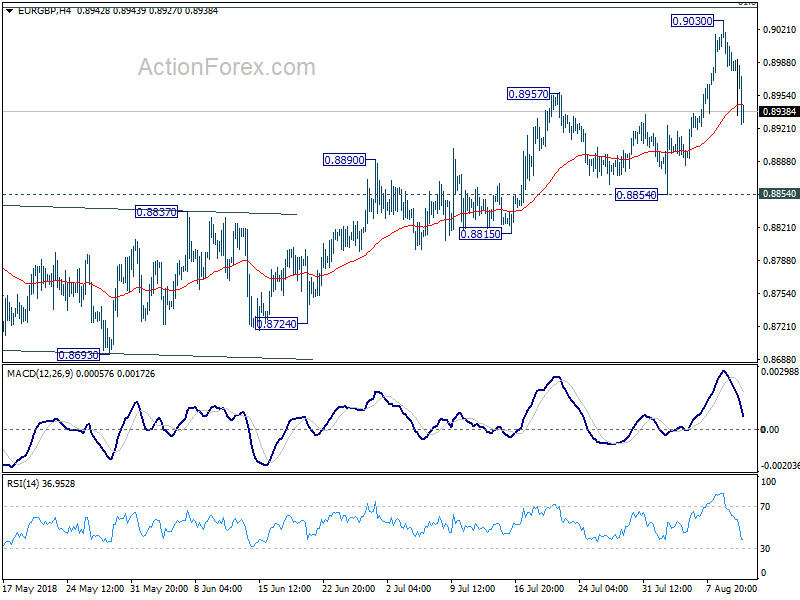
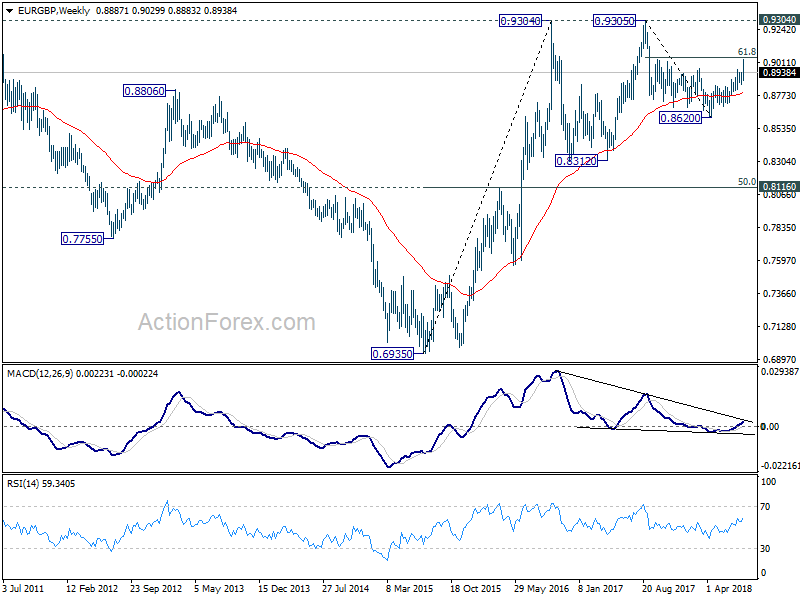
EUR/GBP's rise from 0.8620 finally resumed last week and hit as high as 0.9030. Nonetheless, it faced some resistance from 61.8% retracement of 0.9305 to 0.8620 at 0.9043 and retreated deeply. Initial bias is neutral this week first. At this point, we'd expect downside of retreat to be contained by 0.8854 support to bring another rally. Firm break of 0.9043 will pave the way to retest 0.9305 key resistance. However, sustained break of 0.8854 will indicate near term reversal and turn outlook bearish.
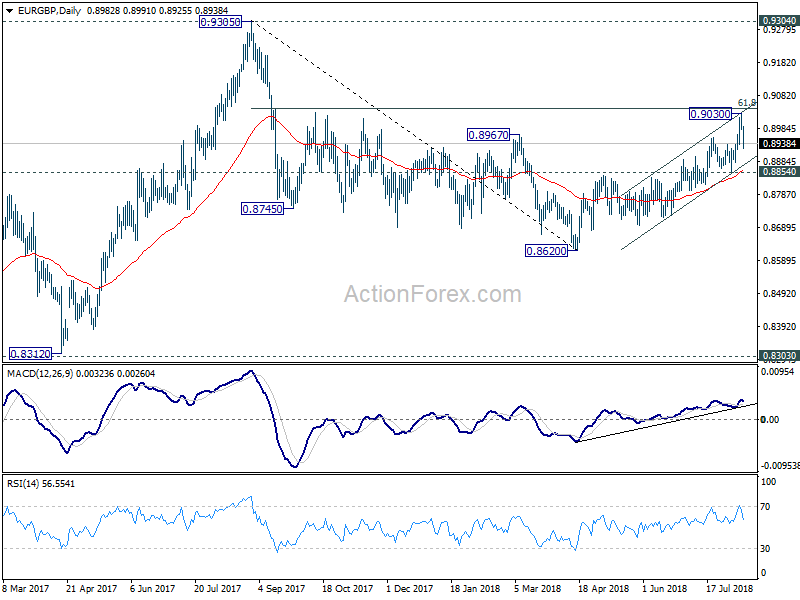
In the bigger picture, EUR/GBP is staying in long term range pattern from 0.9304 (2016 high). The corrective structure of the fall from 0.9305 to 0.8620 is raising the chance that rise from 0.8312 to 0.9305 is an impulsive move. But we're not too confident on it yet. In any case, we'd stay cautious on strong resistance from 0.9304/5 to limit upside in case of further rally. Meanwhile, if there is another medium term decline, strong support will likely be seen from 0.8303 to contain downside.
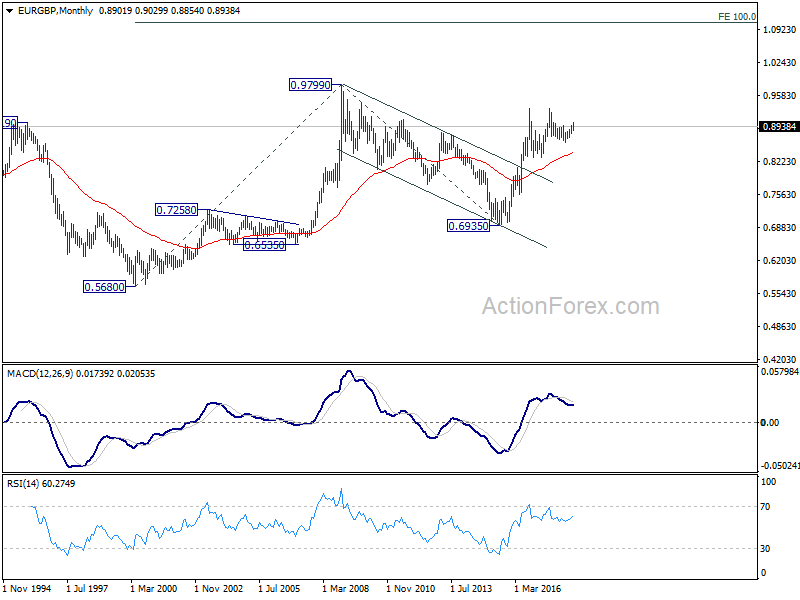
In the long term picture, we're holding on to the view that rise from 0.6935 (2015 low) is resuming the up trend from 0.5680 (2000 low). Hence, after the consolidation from 0.9304 completes, we'd expect another medium term up trend through 0.9799 to 100% projection of 0.5680 to 0.9799 from 0.6935 at 1.1054.
EUR/AUD Weekly Outlook
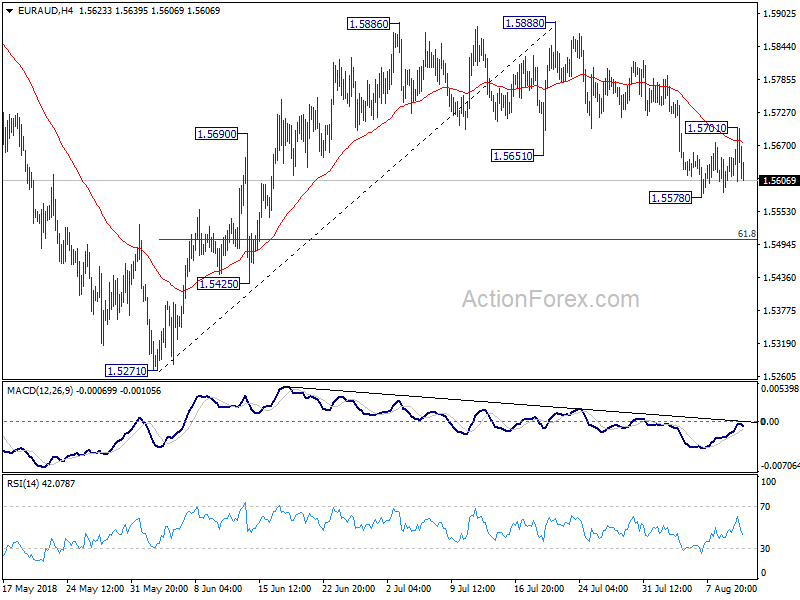
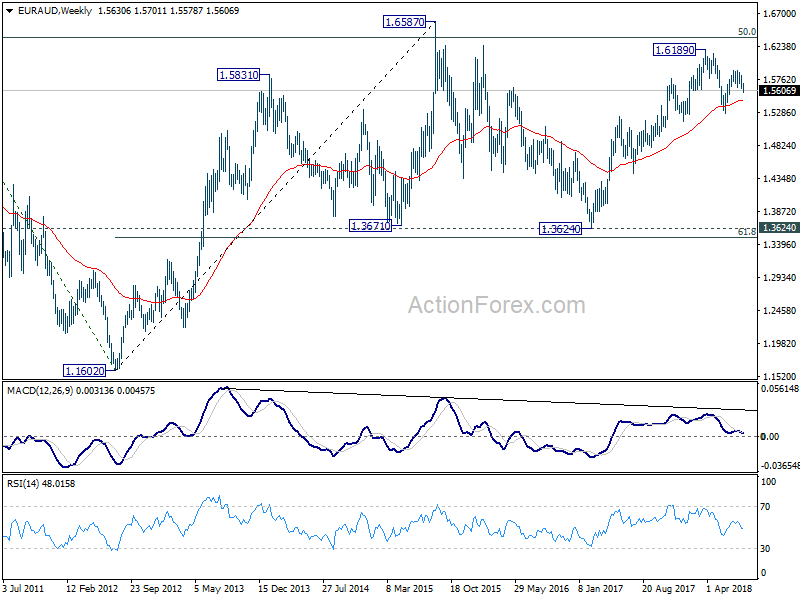
EUR/AUD dipped to 1.5578 last week but recovered since then. Initial bias remains neutral this week first. Further decline is still expected in the cross. Break of 1.5578 will extend the fall from 1.5888 to 61.8% retracement of 1.5271 to 1.5888 at 1.5507. Sustained break there will pave the way to retest 1.5271 low. Nonetheless, on the upside, break of 1.5701 minor resistance will argue that fall from 1.5888 might be completed. Intraday bias is will be turned back to the upside for retesting 1.5888.
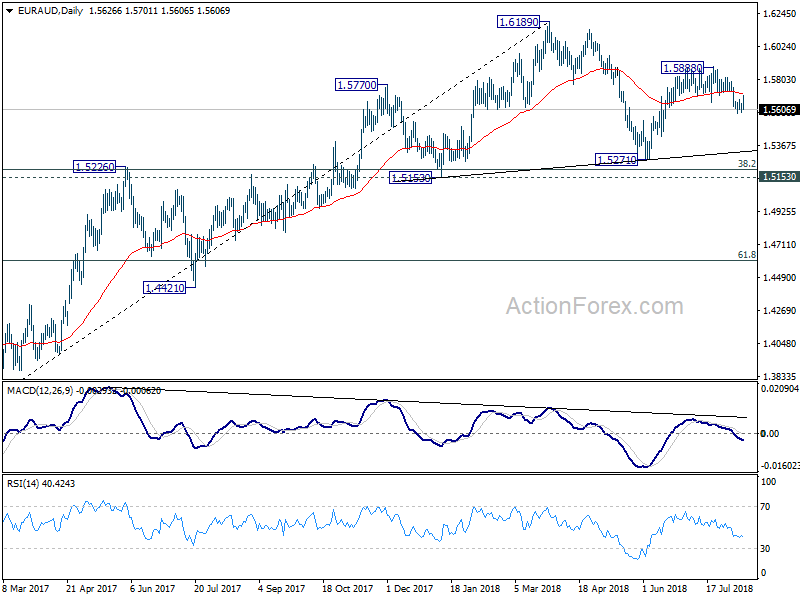
In the bigger picture, the rebound from 1.5271 was somewhat weaker than expected. EUR/AUD also failed to sustain above 55 day EMA and hints on some underlying bearishness. Though, for now, as long as 1.5271 support holds, medium term rise from 1.3624 (2017 low) is still mildly in favor to extend through 1.6189 high, to 1.6587 key resistance (2015 high). Nevertheless, firm break of 1.5271 will complete a head and shoulder top pattern (ls: 1.5770, h: 1.6189, rs: 1.5888). That would indicate medium term reversal and turn outlook bearish.
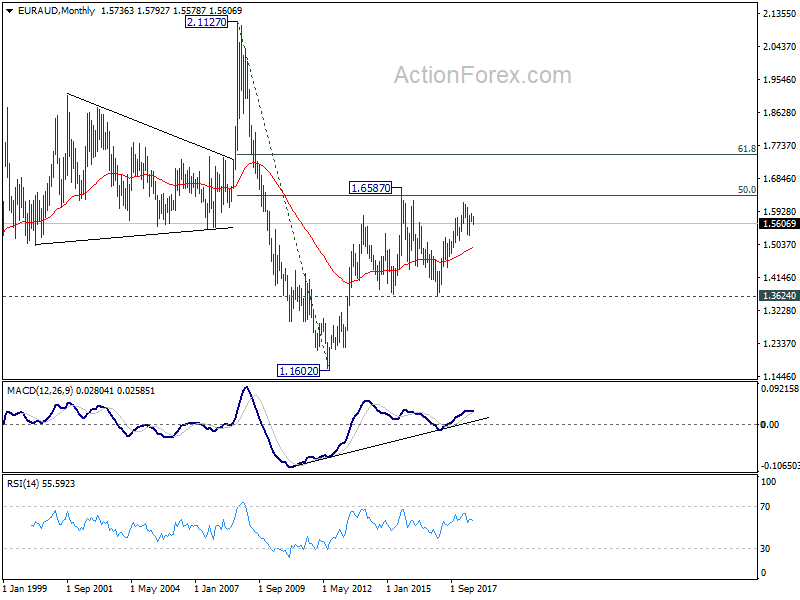
In the longer term picture, the rise from 1.1602 long term bottom (2012 low) isn't over yet. We'll keep monitoring the development but there is prospect of extending the rise to 61.8% retracement of 2.1127 to 1.1602 at 1.7488 and above. However, sustained trading below 1.3624 key support should indicate long term reversal and target 1.1602 long term bottom again.
EUR/CHF Weekly Outlook
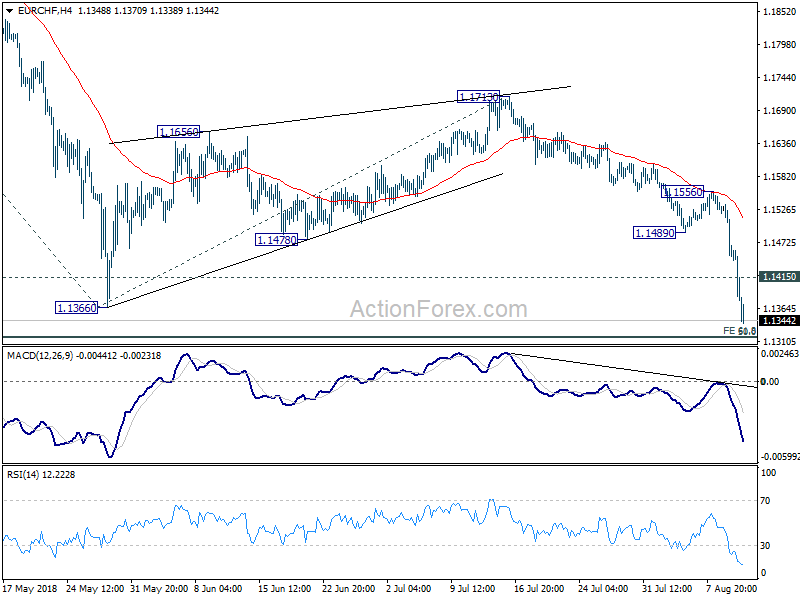
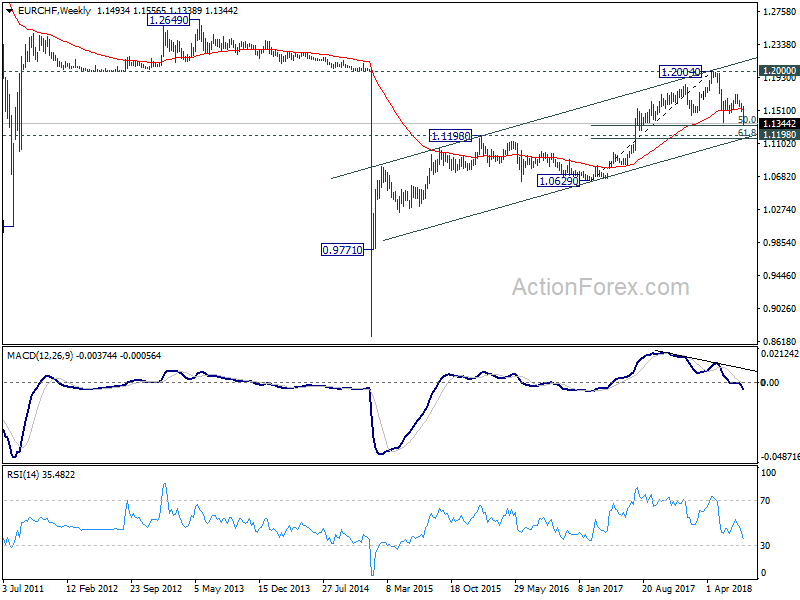
EUR/CHF dropped sharply to as low as 1.1336 last week. Break of 1.1366 confirmed resumption of whole decline from 1.2004. Initial bias stays on the downside this week for 61.8% projection of 1.2004 to 1.1366 from 1.1713 at 1.1319. Decisive break there will target key support zone between 1.1154/98. On the upside, above 1.1415 minor resistance will turn intraday bias neutral and bring consolidation. But recover should be limited below 1.1489 support turned resistance to bring another fall.
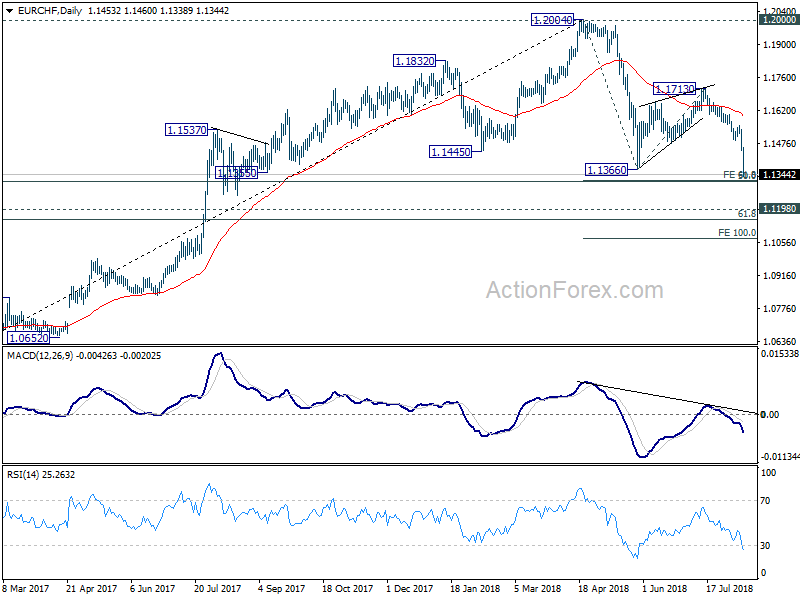
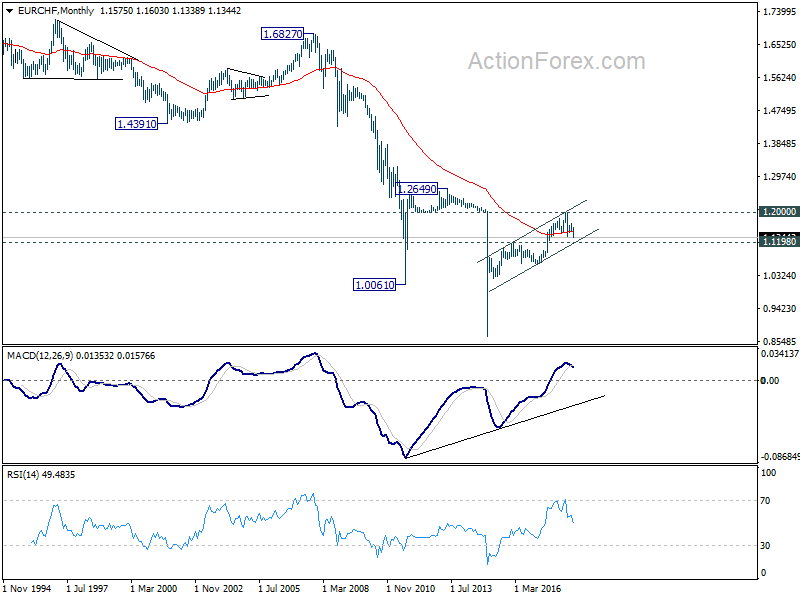
In the bigger picture, for now, the price actions from 1.2004 medium term top is seen as a correction only. Downside should be contained by 1.1198 (2016 high), 61.8% retracement of 1.0629 to 1.2004 at 1.1154 to complete it and bring rebound. This cluster level is in proximity to long term channel support (now at 1.1173) too. A break of 1.2 key resistance is still expected in the medium term long term. However, sustained break of the mentioned support zone will mark reversal of the long term trend.
Looking Through the Turkish Currency Crisis, Dollar is Strong Anyway
It was one of those wild week in the financial markets with a number of market moving themes. New Zealand Dollar was the worst performing one after RBNZ made itself clear that interest rate is going to stay low for longer. And the next move could either be up or down. Sterling extended prior week's post dovish BoE selloff. The markets realized that a no-deal Brexit could now be more likely than not. Euro and Australian Dollar tied for the third weakest. Currency crisis in Turkey prompted deep fear of contagion and sent global stocks markets down. In particular, Eurozone would be vulnerable given its deep tie with Turkey.
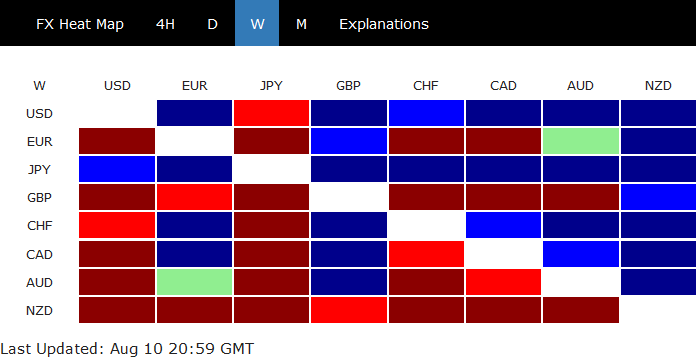
Yen ended as the strongest one on risk aversion. Adding to that, 10 year JGB yield remained resilient, closing slightly above 0.1 handle at 0.102. It's more than double of around 0.4% a month ago. Meanwhile, 10 year German bund yield ended the week down 0.089 to 0.322, comparing to August high at 0.494. US 10 year yields also lost 2.9 handle to close at 2.857, after failing to stay above 3.000 handle. Dollar followed as the second strongest one on safe haven flow while Swiss Franc was the third strongest. Strong Canadian GDP and employment data solidified the chance of October BoC rate hike. But Loonie was mixed as NAFTA negotiation dragged on, without Canada's participation.
While Turkish currency crisis triggered violent moves in the markets. We'd like to emphasize that it didn't created any changes in underlying trends. It just intensified the moves.
Turkey in currency crisis and there is no sign of resolution.
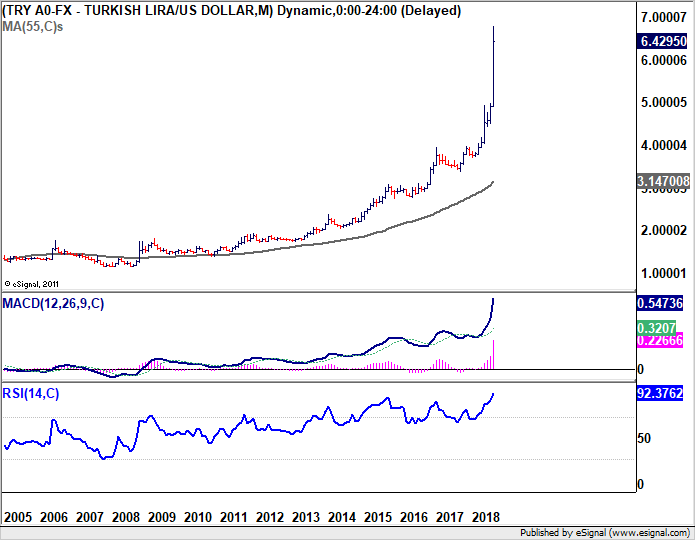
Selloff in Turkish Lira intensified last Friday and rocked the global financial markets. In the background, the economic outlook of the country worsened after re-elected President Tayyip Erdogan's policies failed to alleviate the serious problems of high inflation and rapid currency devaluation. More importantly, his counter-common-sense economic policies are widely disapproved by economists. After Turkish central bank disappointed the markets by keeping interest rates unchanged at the July meeting, versus expectation of 100bps hike, the Lira was already at the edge of a cliff.
The push came from US sanctions for Turkey's imprisonment of an American pastor. At that moment, Lira was already in deep selloff. And situation quickly worsened further on Thursday after Erdogan declared that "if they have their dollars, we have our people, our God." Later on Friday, Erdogan showed no sign of backing down from the confrontation with the US, nor any sign of allowing the central bank to raise interest rates to curb inflation and capital outflow. He even called for citizens to save the TRY by selling foreign exchanges and golds. US Trump then fired another shot of "economic attack" on Turkey by announcing to double up the Steel and Aluminum Tariffs.
As a result, on Friday alone, the Lira depreciated 25%. And it's now very clear that both sides, the US and Turkey, have chosen a confrontational path. There is little sign of de-escalation any time soon. Erdogan also doesn't appear to have any intention to change his economic course. Though, we'll see if Erdogan would turn to Russia for financial aid, or would there be some form of capital control to be imposed to curb Lira's free fall.
Euro dives on fear of contagion, and risks of longer ECB stimulus
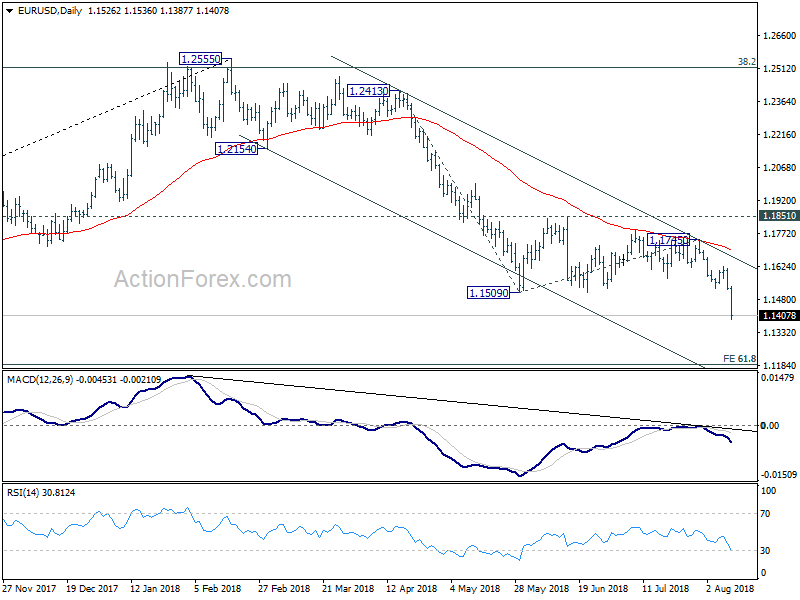
The fear of contagion sent global equities lower while flight to safe haven boosted Dollar, Yen, Swiss Franc, and treasuries. Euro suffered with EUR/USD diving through an important support at 1.15. Spain, France and Italy are believed to be particular vulnerable due to the deep financial tie with Turkey. In particular, Spain's BBVA, Italy's UniCredit, and France's BNP Paribas could be particularly impacted by the ongoing depreciation of the Lira. The development even triggered speculation that ECB could derail from its policy path to counter the worsening situation. That is, there is now risk that ECB would extend the asset purchase program beyond December, and thus, push the first hike farther away.
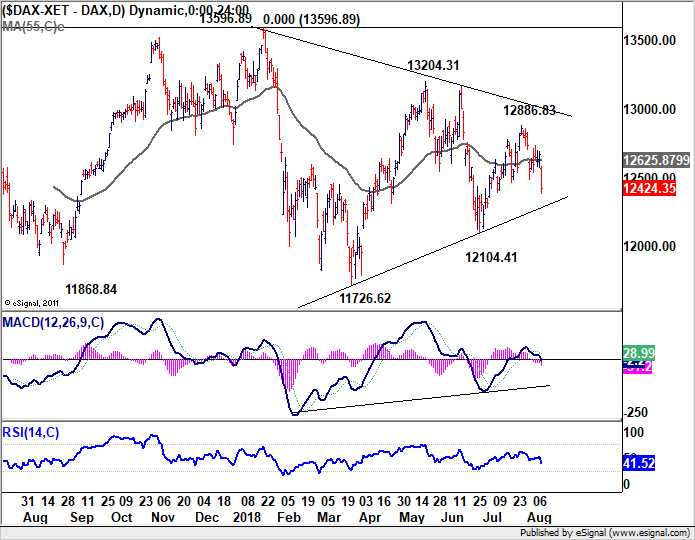
DAX steep selloff confirmed near term reversal after topping at 12886.83
Nonetheless, while the Turkish crisis prompted huge movements in the financial markets, they were just intensification of what's already happening. They're not new trends.
For example, we've pointed out last week that DAX has topped out at 12886.83 in near term. It's initial corrective-looking recovery ended after closing prior Thursday's gap. Friday's selloff and break of 12493.20 support confirmed the bearish view that it's heading back to lower trend line support (12282). There is prospect of falling through 12104.41 support after taking out the trend line. And this will now be the preferred case as long as 55 day EMA (now at 12625.87) holds. Overall, DAX is seen as in consolidation pattern from 13596.89 and some support would likely be seen around 11726.62 even if the selloff intensifies.
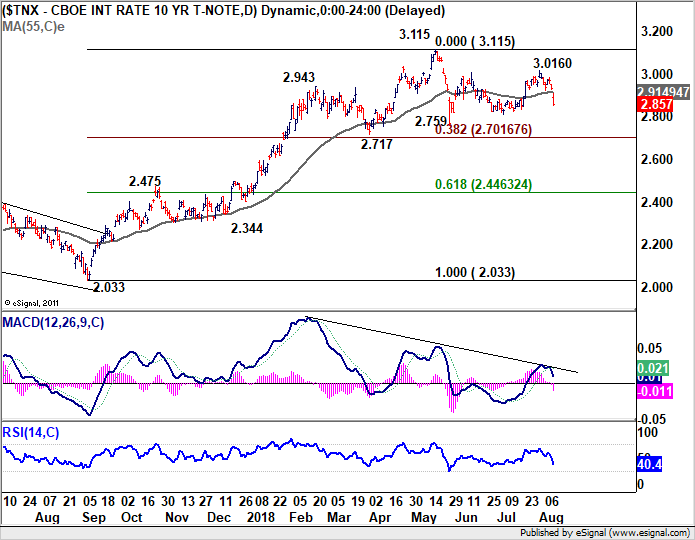
US 10 year yields started third leg of consolidation from 3.115, targeting 2.759
We've also noted that US treasury yields have probably topped in near term already. Last week's sharp fall affirmed this view. 3.000 handle is proven to be too much for 10 year yield for now. The choppy rebound from 2.759, second leg of the corrective pattern from 3.115, is likely completed at 3.019. With 55 day EMA firmly taken out, TNX has likely started the third leg and should head to 2.759 and possibly below. Though, we'd expect strong support at 2.717 clusters, 38.2% retracement of 2.033 to 3.115 at 2.701, to contain downside and bring rebound.
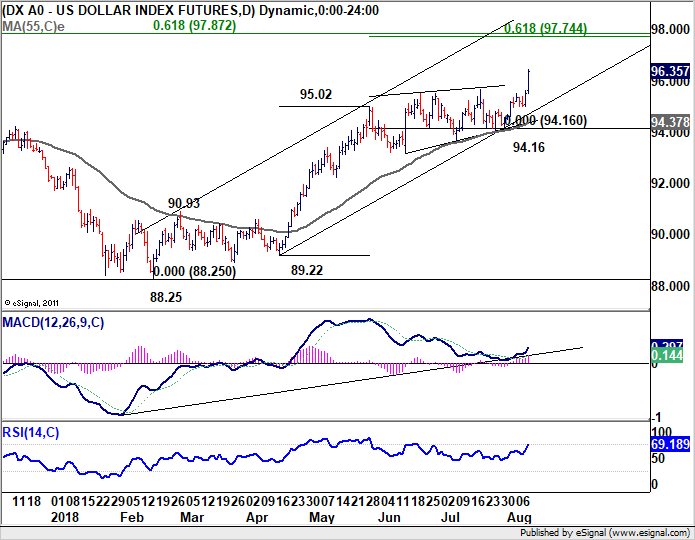
Dollar index finally resumed up trend, 97.74/87 to test its real strength
Meanwhile, we'd like to emphasis too that Dollar's strength is not solely due to problem in Turkey. And more importantly, the developments in the US are clearly Dollar-supportive.
In particular, known dove Chicago Fed President Charles Evans' hawkish turn is worth a mention. He said that the economy is "extremely strong" and it's "really a very good period of time" for both the economy and monetary policy setting. And Fed funds rate might eventually enter into "somewhat restrictive" area as economy strengthens while inflation stays above target. He cited it could be roughly 0.5% above his neutral rate of 2.75%. That is a signal that Fed's tightening cycle could eventually be longer than currently expected.
Supporting that, US CPI was unchanged at 2.9% yoy in July. Core CPI unexpectedly accelerated to 2.4% yoy versus expectation of 2.3% yoy. The impact of trade war with China hasn't really started to show any effect on prices yet. If further tightening in the labor market finally pushes unemployment rate through the natural rate, inflation could accelerate rather quickly.
And, the trade war with China is just at the beginning stage. Dollar seems to be lifted every time there is an escalation. All these are going to happen with or without the Turkish crisis.
Dollar index finally resumed the up trend from 88.25 and hit as high as 96.45 before closing at 96.35. As usual, there are many ways to interpretation prices actions. One interpretation is that price actions from 95.02 to 91.16 is a consolidation pattern that's "skewed upwards". If it's true, the current rally should be rather powerful. Anyway, near term outlook will stay bullish as long as last week's low at 94.99 holds. Next target is cluster level at 97.74/87, 61.8% projection of 89.22 to 95.02 from 94.16 at 97.74, 61.8% retracement of 103.82 to 88.25 at 97.87. Reaction to this cluster fibonacci level will reveal how powerful the Dollar's rally is.
Position trading strategies - Hold short in GBP/CHF, EUR/JPY
We said in last week's report that we'll hold short in GBP/CHF and sell EUR/JPY at market when the week started.
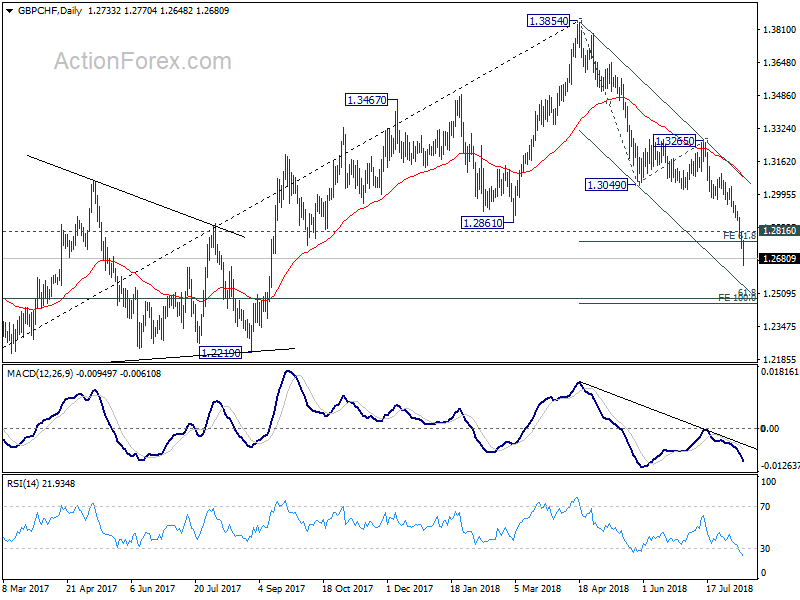
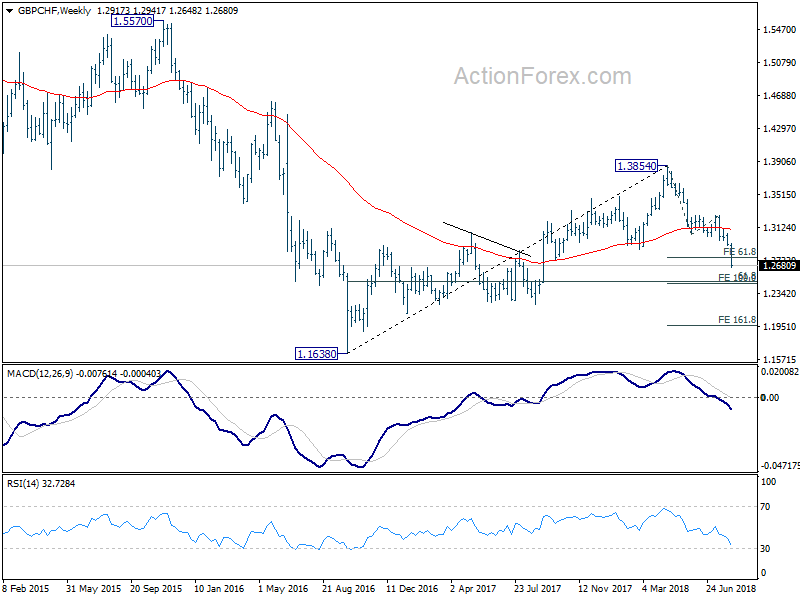
GBP/CHF short (sold at 1.2971) worked quite well as the cross dived to as low as 1.2648 so far. First target of 61.8% projection of 1.3854 to 1.3049 from 1.3265 at 1.2768 was already met. We suggested in this post to tighten up the stop to 1.2820 (slightly above 1.2816 minor resistance). We'll keep the stop there to give the decline some room to breathe. Meanwhile, 100% projection at 1.2460 is close to 61.8% retracement of 1.1638 to 1.3854 at 1.2485. Hence, we'll take all profit and exit if 1.2500 is met (slightly above 1.2460 and 1.2485).
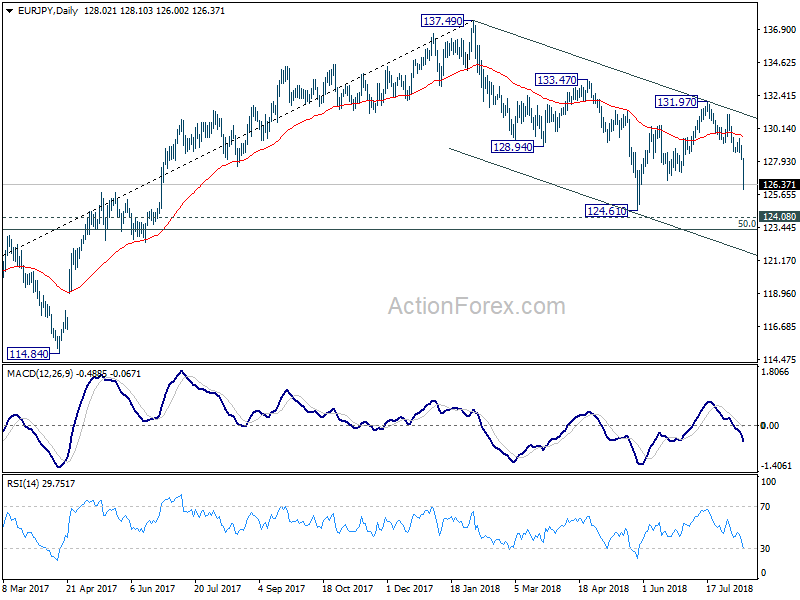
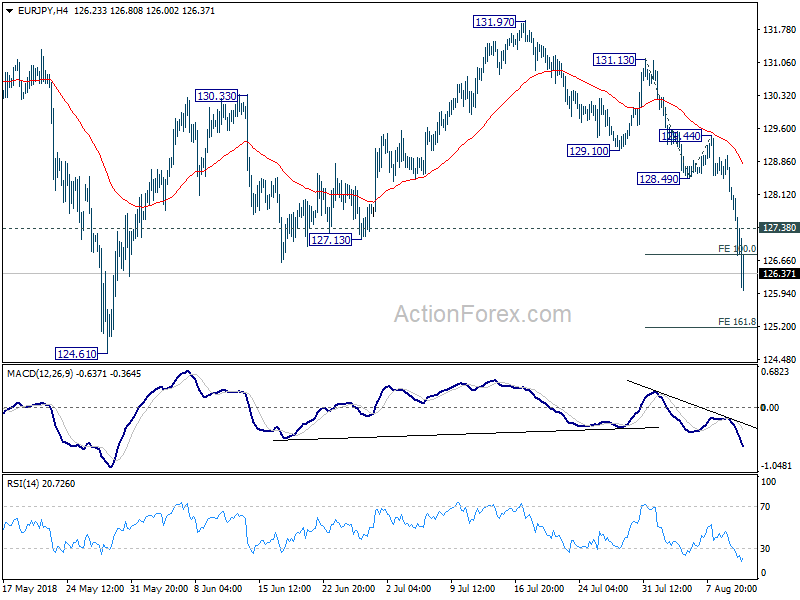
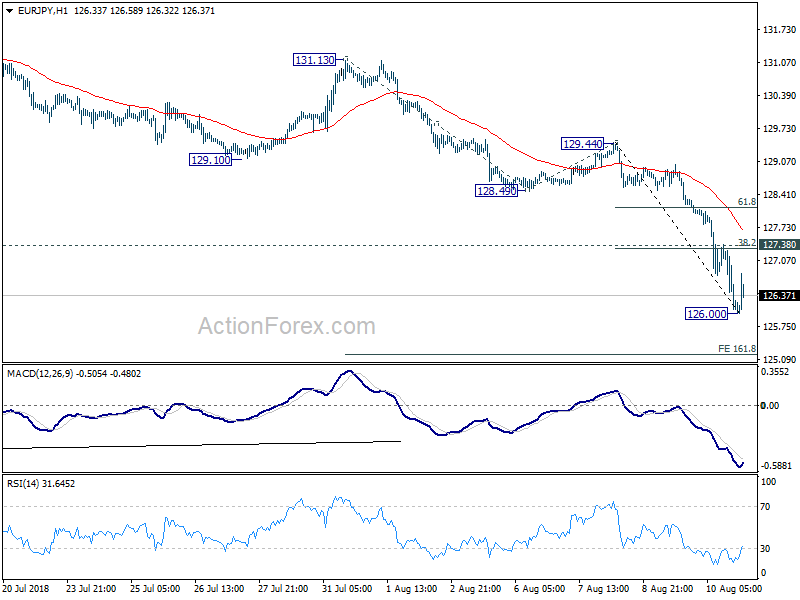
We sold EUR/JPY at open at (128.60) last week. Initial rebound made the strategy look shaky. But our stop at 129.60 wasn't hit. And subsequent decline to as low as 126.00 is inline with our expectation. In the last update, we lowered the stop to 128.10, and this has to be lowered further for sure. In the bigger picture, we're expecting fall from 131.97 to have a test on 124.61 low at least. Meanwhile, the fall from 129.44 has gone well past 100% projection of 131.13 to 128.49 from 129.44 at 126.88 already. It argues that EUR/JPY is heading to 161.8% projection at 125.16 in near term. Hence, we don't want to tightening up the stop too much. Considering all, we'll lower the stop to 127.45, slightly above 127.38 minor resistance and 38.2% retracement of 129.44 to 126.00 at 127.31. We'll still tentatively target to take profit at 124.61. But we'll see how it goes when EUR/JPY drops below 125.00.
As for new strategies, we'll look for opportunity to buy Dollar given that the up trend has finally resumed. But we'll wait for the market to exhaust the current move first, before entering in a pull back.
AUD/USD Weekly Outlook
AUD/USD dropped to as low as 0.7279 last week and the break of 0.7309 low finally indicates resumption of down trend from 0.8135. Initial bias stays on the downside this week for 61.8% projection of 0.7676 to 0.7309 from 0.7452 at 0.7225 first. Break will target 100% projection at 0.7085 next. On the upside, above 0.7347 minor resistance will turn intraday bias and bring consolidation. But recovery should be limited below 0.7452 resistance to bring fall resumption.
In the bigger picture, medium term rebound from 0.6826 (2016 low) is seen as a corrective move that should be completed at 0.8135. Sustained break of 0.7328 cluster support (61.8% retracement of 0.6826 to 0.8135 at 0.7326) should pave the way to retest 0.6826. There is prospect of resuming long term down trend from 1.1079 (2011 high). But we'll look at downside momentum to assess at a later stage. On the upside, break of 0.7452 resistance might indicate medium term bottoming. But we'll continue to favor the bearish view as long as 0.7676 resistance holds.
In the longer term picture, rebound from 0.682 (2016 low) should have completed at 0.8135 already. Failure to reach 38.2% retracement of 1.1079 (2011 high) to 0.6826 at 0.8451 carries bearish implications. This is also supported by the corrective structure from 0.6826 to 0.8135, as well as the rejection by 55 month EMA. The down trend from 1.1079 is in favor to extend. On break of 0.6826, next target will be 61.8% projection of 1.1079 to 0.6826 from 0.8135 at 0.5507.
Summary 8/13 – 8/17
Monday, Aug 13, 2018
[php_everywhere instance="1"]
Tuesday, Aug 14, 2018
[php_everywhere instance="2"]
Wednesday, Aug 15 2018
[php_everywhere instance="3"]
Thursday, Aug 16, 2018
[php_everywhere instance="4"]
Friday, Aug 17, 2018
[php_everywhere instance="5"]
Recession Update: Should We Worry?
"To expect the unexpected shows a thoroughly modern intellect." – Oscar Wilde
Executive Summary: Bright Sunshine in the Short Run, Clouds Are Gathering Over the Medium Term
So far, 2018 shows interesting (and, to some extent, contradictory) developments. While the economic/financial world experienced some healthy gains, recession worries are also in the picture. That is, Q2-2018 GDP growth came in at 4.1 percent, and the S&P 500 Index hit 2,800 for the first time (in January 2018). The flip side of the coin is that, mainly due to the rising fed funds rate environment, some analysts are worried about the inverted yield curve and the impending risk of a recession. Furthermore, the current expansion is the second-longest expansion on record. It is true that expansions don't die of old age, but they are not eternal either—and a recession ends an expansion phase.
To inform our readers, we updated our models to estimate the potential risks of a recession in the short run (within the next six months), as well as in the medium term (the next couple of years). Our preferred Probit model suggests a very low probability (less than 5 percent) of a recession during the next six months. The ordered Probit model, which predicts the probability of a recession as well as the strength of a recovery/expansion, also shows a very low recession possibility for the next six months. The model is suggesting above-trend growth for the rest of 2018. Essentially, our models suggest bright sunshine and no recession risk for the rest of 2018.
Last year, we developed a new framework to predict recessions in the medium term (up to two years ahead). The predictive power of the framework is significantly higher than the inverted yield curve; our proposed method predicted all recessions since 1954, but the inverted yield curve failed to predict recessions during the 1954-1965 period.1 Our proposed framework identifies a threshold between the fed funds rate and the 10-year Treasury yield, and when the threshold is breached, the risk of a recession in the medium term is significant. This threshold was breached in December 2017. Historically, when the threshold is met, there is 69.2 percent chance (average probability) of a recession within the next 17 months (average lead time). Therefore, this framework suggests that clouds are gathering over the next couple of years.
In addition, there are two major recent developments that can affect the threshold's call. First, there is the 2018 tax cuts to consider, but we believe the net effect of the tax cuts may be neutral (and may not affect the threshold call). On the one hand, the tax cuts are likely to boost personal spending and after-tax corporate profits (at least in the short run). On the other hand, the tax cuts may put the FOMC on a faster rate-hike track, as there is a high probability of four rate hikes in 2018. The four rate hikes may take the fed funds rate close to its peak of the cycle. Historically, the peaking of the fed funds rate in a monetary cycle has been an indication of an elevated risk of a recession in the medium term.2
The second factor is the newly-announced and enacted tariffs (and fears of a trade war), which may favor the threshold's call by creating challenges for business as well as for consumers, at least in the near term.3 At present, we are not making a recession call for 2019, and are instead forecasting healthy growth (2.9 percent for 2019). We will be evaluating the upcoming data and will publish a report if we notice significant developments, either against or in favor of the threshold's call. Therefore, we suggest that decision makers carefully monitor the upcoming data in the rest of 2018 and 2019 to gauge signs of a turning point.
Forecasting Recession Risks for the Short Run: No Worries!
One useful method of predicting the chances of a recession over the near term is to build a Probit model. A Probit model, in the present case, estimates (using a handful of predictors) the probability of a recession for a certain period in the future. Our official model, which we built back in 2007, utilizes the Leading Economic Index (LEI), S&P 500 Index and Chicago PMI employment index as predictors. Our model has served us well, as it started predicting (in real-time) a significantly higher probability of recession in 2007 (58 percent probability in Q3-2007).4 In addition, we never joined the "double-dip" camp back in 2010-2012, largely because our Probit model never indicated that a recession during that time period was likely.
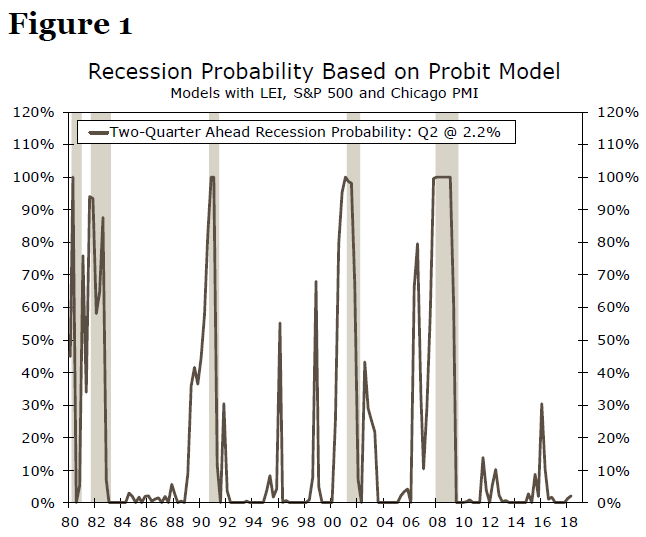
Using the most recent data, our model suggests a less than 5 percent probability of a recession during the next six months (Figure 1). The reason for the low recession probability in 2018 is that the LEI, the key predictor in our model, has not shown a single month of negative growth so far this year. A decline in the LEI may indicate weakness in the economy. Furthermore, given the positive momentum of the LEI (the average growth rate is 0.42 percent in 2018), it would be very difficult to imagine a recession in 2018.
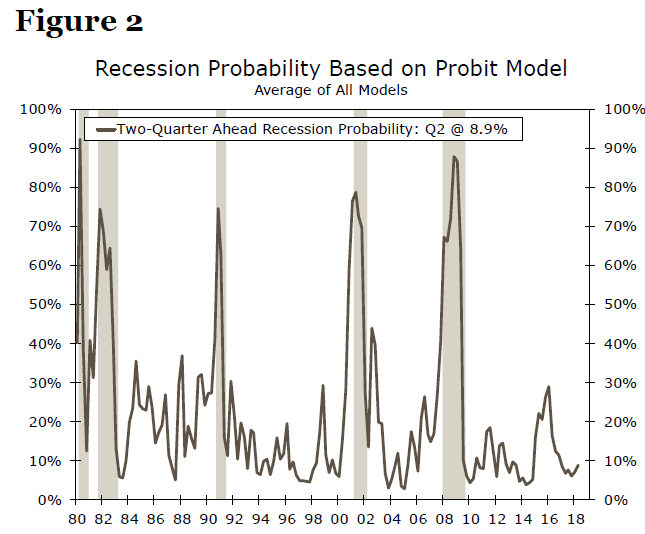
Back in 2016, in addition to our official Probit model, we built seven sector-specific Probit models to capture the risk of a recession for the U.S. economy.5 The different models utilize information from different sectors of the economy to estimate the potential risk posed by those sectors. We take the average probability from all these models to estimate the potential risk of a recession posed by the major sectors of the economy. Currently, the average probability is very low (8.9 percent, Figure 2).
To sum up, our Probit models are suggesting a very low risk of a recession for the rest of 2018. There is always possibility of a shock, but economic fundamentals are strong at present.
Predicting Growth Outlook for the Near Term: Above Trend Growth
Economies evolve over time, as do the relationships between economic/financial variables. For example, the Great Recession ended in June 2009, but the first interest rate hike by the FOMC occurred in December 2015. One major reason for the accommodative monetary policy stance (even after the recession ended) was the painfully slow nature of the recovery when compared to historical standards. Therefore, it is important to predict the pace of a recovery/expansion (weaker versus stronger) in addition to the timing of a recession. A weaker recovery prediction (such as the recovery from the Great Recession) suggests a continuation of accommodative monetary policy, as opposed to a stronger recovery forecast, which may support a change in the monetary policy stance.
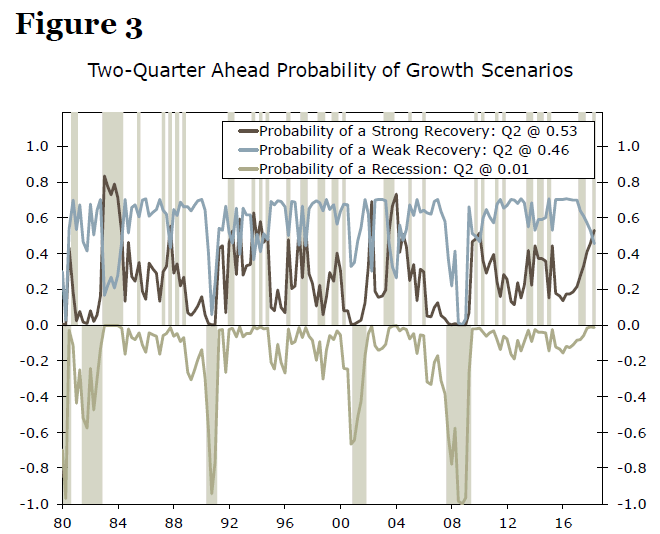
Therefore, we built an ordered Probit framework that simultaneously predicts the probability of a recession and the strength of a recovery/expansion. The model's estimates are very impressive; the model successfully predicted all recessions and the pace of recoveries since the 1980s in a simulated, out-of-sample experiment.6 The most recent estimate of the model (based on Q2-2018 data) suggests higher chances (53 percent probability) of above-trend growth (around 3.0 percent to 3.5 percent) for the second half of 2018 (Figure 3).
In sum, the growth outlook for the rest of 2018 looks to be above-trend (our official forecast is 3.1 percent for 2018). The current expansion is the second-longest expansion on record and, typically, economies produce slower growth rates in late phases of the business cycle, as resource utilization is either at or close to its peak. We expect economic growth to lose some steam, as we are predicting 2.9 percent growth for 2019.
Yes, We are All Dead in the Long Run. What About the Medium Term?
Keynes once said that in the long run we are all dead. We agree with Keynes, but the medium-term economic outlook is also important for decision makers. This is because a different set of decisions is required when anticipating a recession compared to when the medium-term outlook is bright. Therefore, to estimate the medium-term recession risk (up to a couple of years), we developed a new framework last year. Our proposed framework identifies a threshold between the fed funds rate and the 10-year Treasury yield (we call it the FFR/10-year threshold). In a rising fed funds rate environment, the threshold is breached when the fed funds rate touches/crosses the lowest level of the 10-year Treasury yield in that cycle. When this occurs, the risk of a recession in the near future is significant.
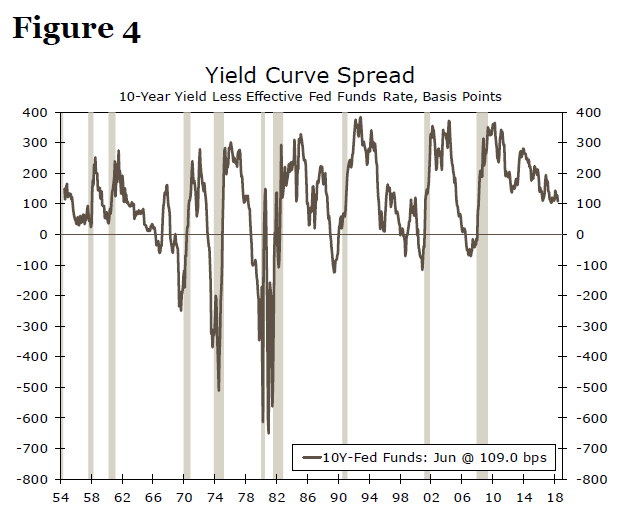
Our framework has successfully predicted all recessions since 1954, with an average lead time of 17 months. Furthermore, our framework predicted several recessions before the yield curve inversion point/monetary cycles approach and, therefore, serves as a more effective tool in predicting recessions. That is, with our framework, we do not have to wait for the yield curve to invert to predict a recession (Figure 4).
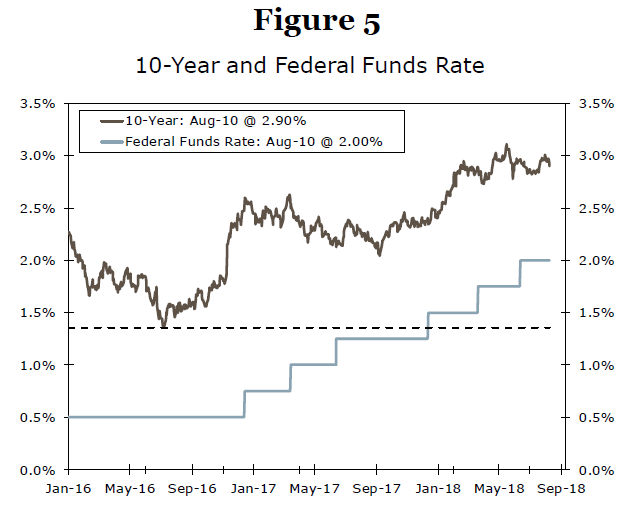
Why is our analysis important for decision makers? In the current monetary cycle, the lowest 10-year Treasury yield was 1.36 percent (hit on July 5, 2016) and the current fed funds rate is 2.00 percent (as of August 2018). Furthermore, the fed funds rate, for the first time in the current monetary cycle, hit 1.50 percent in December 2017 (with the December 2017 rate hike by the FOMC), and thereby crossed the lowest level of the 10-year Treasury (1.36 percent) and breached the FFR/10-year threshold (Figure 5). Historically, when the threshold is met, there is 69.2 percent chance (average probability) of a recession within the next 17 months (average lead time). Therefore, the risk of a recession during the next couple of years is elevated and decision makers should be watching the upcoming data for potential signs of a turning point.
Can the 2018 Tax Cuts and Tariff Announcements Affect the Threshold's Call?
With the FFR/10-year threshold conditions met in December 2017, and with an average lead time of 17 months between a breach of the threshold and a recession, it seems that clouds are gathering over the next couple of years. Are there any major factors which could either clear the clouds or bring in a storm? In this ever-changing world, many factors could affect the threshold call. Here, we review two major developments which have occurred in 2018.
The first major factor is the 2018 tax cuts. We believe the tax cuts would have a dual effect on the recession call. (A) The tax cuts lift after-tax personal income and that is likely to boost personal spending, at least in the short run. Similarly, corporations would enjoy higher after-tax profits. Therefore, the tax cuts may "push" a recession further into the future.
(B) On the other hand, the tax cuts could affect the pace of monetary policy (in our view, they already have) by putting the FOMC on a track of faster rates hikes. The FOMC has raised rates twice in 2018, with a very high possibility of two more interest rate hikes (total of four rates hikes in 2018), in addition to rolling back the Fed's balance sheet. However, the FOMC raised rates only once in 2016 and three times in 2017. The major reason for the FOMC's faster pace of rate hikes is that the FOMC may be uneasy about "over-heating" and/or inflationary pressure due to the 2018 tax cuts. The faster pace of rate hikes is putting upward pressure on borrowing costs, as interest rates are an important element of borrowing costs. Furthermore, with two more rates hikes, the fed funds rate will be at 2.50 by the end of 2018, and some analysts are suggesting the terminal (or equilibrium) fed funds rate is in the 2.00-3.00 percent range.7 That is, with two more rate hikes, the fed funds rate would be close to its peak. The peaking of the fed funds rate is another indication of an upcoming recession.8 Given the counteracting effects of (A) and (B), the cumulative effect of the tax cut on the framework's recession call is neutral.
The other major economic event of 2018 is the announcement and subsequent enactment of new tariffs, which have boosted fears of a global trade war. The U.S. has implemented tariffs on several countries' products, and most of those countries have announced/applied retaliatory tariffs on U.S. products. The potential effect of these tariffs (in addition to the global trade war fear) is a disruption of global supply chains, which has the potential to affect the overall U.S. economy. In other words, trade tensions may favor the threshold call.
In summary, our approach to predict the medium-term risk of a recession suggests an elevated chance of a recession in the next the couple of years. The 2018 tax cuts may not affect that call because of the dual effect of the tax cuts. The tariffs, by creating a fear of a trade war and by potentially disrupting global supply chains, may support the threshold's call. However, at present, U.S. economic fundamentals are very strong and our official call for 2019 is 2.9 percent GDP growth. We will be evaluating upcoming data to gauge signs of a turning point in the next couple of years. Therefore, we suggest decision makers carefully monitor the upcoming data in the rest of 2018 and 2019 to examine whether the "sky" is getting clearer or clouds are forming.
Concluding Remarks: No Worries for the Short Run, Be Cautious for the Medium Term
Our models are suggesting very low recession risks for the rest of 2018. In addition, the ordered Probit model is predicting above-trend growth for the next couple of quarters. Essentially, both approaches are suggesting that fundamentals are strong, at least in the near term. Our official call for 2019 is a healthy economy with 2.9 percent growth.
However, our medium-term model is suggesting a cautious outlook for the next couple of years. Potential challenges to the medium-term outlook include rising interest rates, which may push up borrowing costs for investors/consumers. The peaking of the fed funds rate, which is associated with recessions, is another risk. Furthermore, trade tensions are also creating challenges by boosting fears of a trade war. We will be evaluating the upcoming data and will publish a report if we notice significant developments either against or in favor of the threshold's call. Decision makers should also carefully monitor the upcoming data in the rest of 2018 and 2019 to gauge signs of changes in the momentum of the economy.
1 For more detail about the new methodology, see "Do We Need to Wait for a Yield Curve Inversion to Predict a Recession? No." (September 8, 2017). Available upon request.
2 Adrian, T and Estrella, A. (2009). Monetary Tightening Cycles and the Predictability of Economic Activity. NY FRB Staff Reports, No 397, October 2009.
3 "How Costly Would a Full-Blown Trade War Be?" (April 5, 2018). Available upon request.
4 For a detail discussion about Probit models, see our report "Recession Talks in the Spotlight: Should We Worry?" (February 24, 2016). Available upon request.
5 Ibid.
6 "Predicting the Probability of Recession and Strength of Recovery: An Ordered Probit Approach" (July 19, 2016). Available upon request.
7 Bullard, B. James. (2018). R-Star war: The Phantom Menace. Business Economics, Vol 53.
8 Adrian, T and Estrella, A. (2009). Monetary Tightening Cycles and the Predictability of Economic Activity. NY FRB Staff Reports, No 397, October 2009.