

Sample Category Title
Canadian July Employment Soars Higher
Highlights:
- Employment soared a much stronger-than-expected 54k building further onto the 32k gain in June. All of the unexpected strength could be attributed to the education component rising 37k in the month.
- The solid increase in employment contributed to the unemployment rate dropping back down to 5.8%.
- Wage growth moderated to 3.0% after overstated gains the previous two months averaging 3.7%.
Our Take:
Today’s July labour market report indicated that volatility in employment growth continues with hiring in July soaring 54k that built further onto the 32k gain in June. These gains more than offset minimal employment declines the previous two months. The July increase was much stronger than the 17k expected going into the report. However explaining all of the upward surprise was a 37k jump in the education component that had essentially remained unchanged over the first half of the year. This component in recent years has seen increased volatility over the July through September period reflecting difficulties seasonally adjusting shifting hiring practices by educational institutions over the summer holiday period. Our expectation is that the July spike will likely be reversed over the subsequent two months. Smoothing out the volatility, employment has grown on average 5k per month to date this year which does represent a marked slowing from the 36k average gain achieved in 2017. However, the resulting unemployment rate on average this year of 5.8% is already moderately below the 6.0% to 6.5% full employment level. A more robust pace of hiring would raise the risk of both pushing the Canadian economy further into excess demand and contributing to greater upward inflationary pressures. To keep employment growth moderate going forward, our expectation is that the Bank of Canada will continue to withdraw still relatively stimulative monetary conditions. Today’s report raises the probability of a 25-basis point hike in the overnight rate to 1.75% possibly occurring as early as the next policy meeting in September. However, with inflation currently still close to the Bank of Canada’s 2.0% target, our expectation is that a gradual pace of tightening will be maintained with the next hike occurring at the subsequent policy meeting in October.
Core CPI Hits Fresh Cycle High
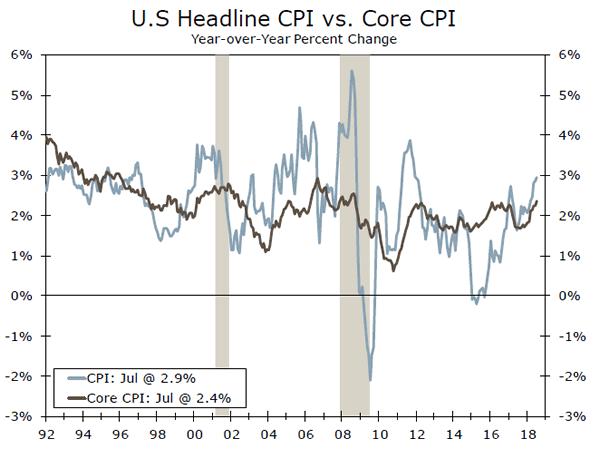
Consumer price inflation edged up 0.2 percent despite a pullback in energy prices. Core inflation is up 2.4 percent over the past year and should keep the Fed on track to raise rates two more times this year.
Broad Gains in July
Consumer price inflation picked up a bit in July, with the CPI rising o.2 percent after advancing 0.1 percent in June. That kept the 12-month change in inflation at 2.9 percent, the fastest rate in six years.
Energy has been a key driver of the increase in inflation over the past year, but over the past two months prices have headed in the other direction. Lower gasoline and electricity prices sent energy costs down 0.5 percent last month.
Other major categories posted gains in July, however, including food. Grocery store prices notched another increase last month, but fierce competition and generally lower commodity prices over the past year have kept inflation quite tame. Prices for food at home are up only 0.4 percent over the past year compared to a 2.8 percent increase for food away from home, as restaurants contend with rising labor costs.
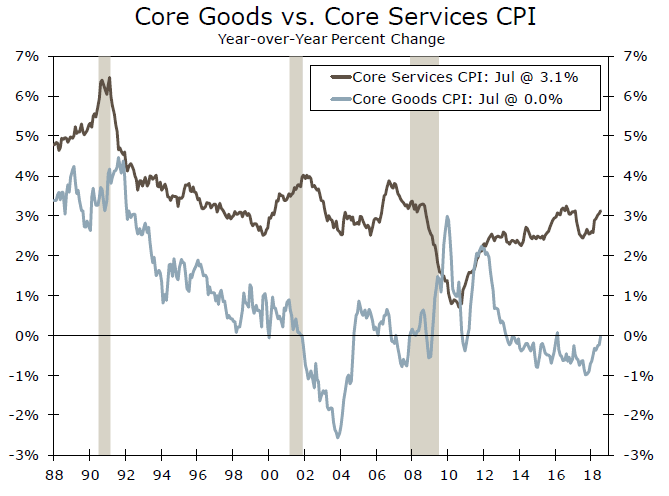
Outside of energy and food, prices continued their steady ascent. Core inflation increased a "strong" 0.2 percent (0.24 percent before rounding). Services continue to lead the way, with prices rising 0.3 percent. While housing costs continue to underpin the strength, a 2.7 percent jump in airfare—driven in part by higher fuel prices—led to a pickup in transportation services.
Core goods prices rose 0.1 percent, for the first gain in five months. Higher prices for new and used autos were a big help, up 0.3 percent and 1.3 percent, respectively. Prices for apparel and medical care goods both declined on the month.
Real Earnings Take a Hit, But Should Recover Soon
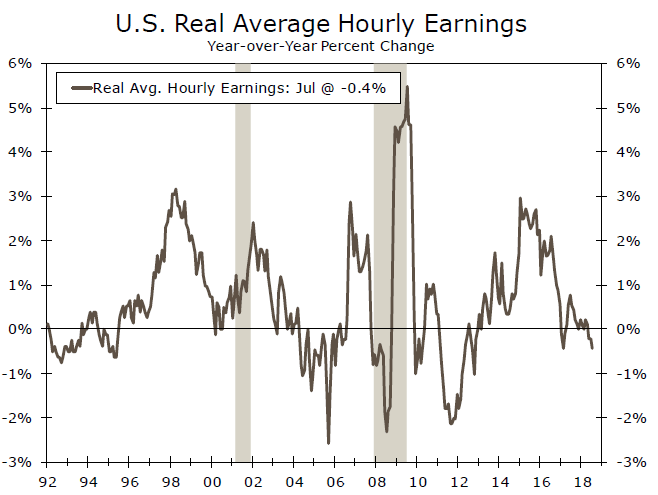
The rise in inflation over the past year has sent real wages back into negative territory and is one reason we do not expect real consumer spending to maintain the breakneck pace of the second quarter. Real earnings should improve ahead, however. Energy's lift to inflation is expected to moderate over the next few months, leading to headline inflation falling back to 2.4 percent in the fourth quarter. Meanwhile, wage growth should continue to strengthen given the tight state of the labor market.
Fed No Longer Having to Sweat Inflation
While headline inflation should ease in the coming months amid a pullback in oil prices, core inflation will likely remain near its current 12-month rate of 2.4 percent. Over the past three months, the core index is increasing at a 2.3 percent annualized rate. Higher input costs and greater willingness among firms to raise prices point to the firmer trend continuing into 2019. The current pace of core CPI remains on par with PCE inflation running at the Fed's 2 percent target. That should keep the Fed on track to raise rates in September and most likely again in December.
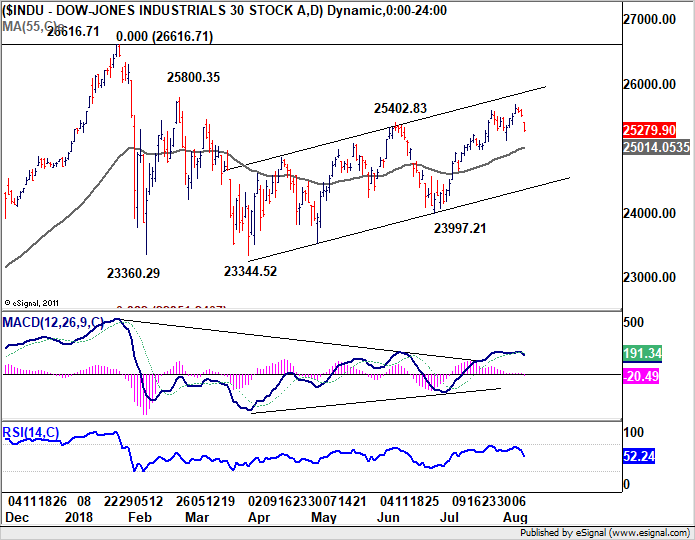
DOW dives as Trump fires another shot of economic attack on Turkey
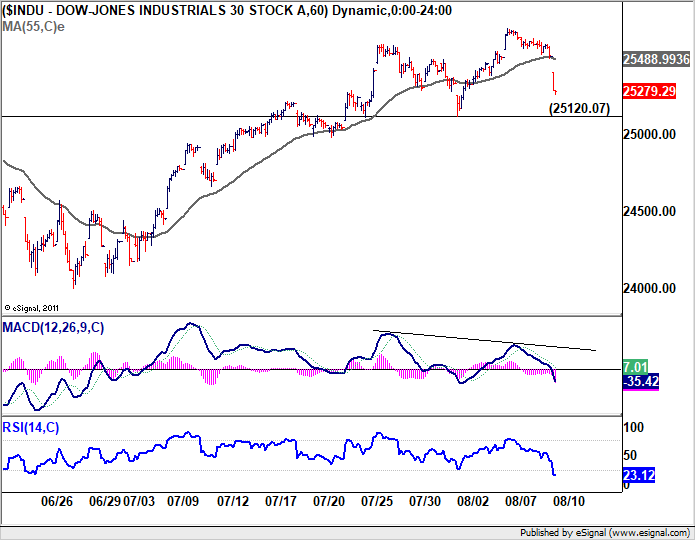
US stocks open broadly lower on Turkish crisis. Selling accelerates after Trump double down the tariffs on Turkish steel and aluminum. So, does it justify Erdogan's claim that they're under "economic attack"?
https://twitter.com/realDonaldTrump/status/1027899286586109955
At this time of writing, DOW is down -0.9% or -2340 points. Focus in on 25120.07 support. As long as it holds, recent bullish run from 23997.21 is still on course for 25800.35 resistance. But a firm break there should indicate near term reversal.
USD/JPY Mid-Day Outlook
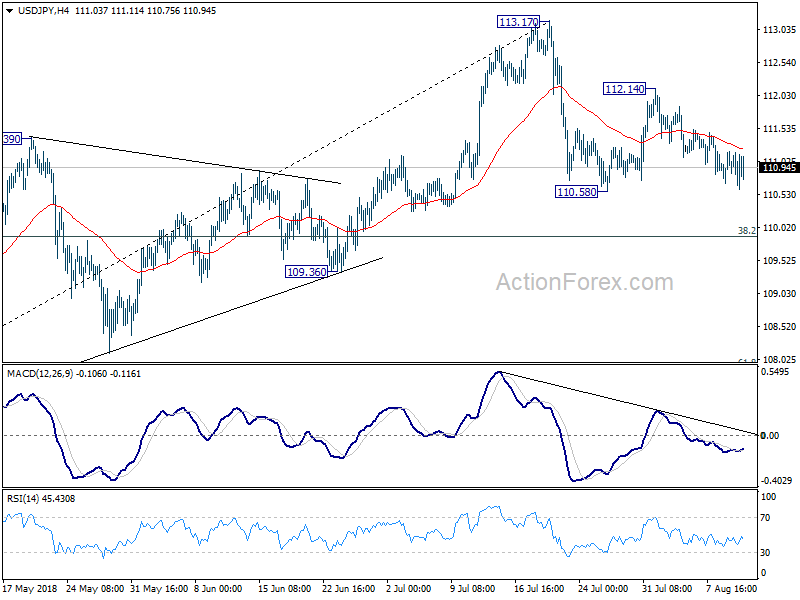
Daily Pivots: (S1) 110.80; (P) 110.99; (R1) 111.28; More...
Intraday bias in USD/JPY stays neutral and outlook is unchanged. The corrective fall from 113.17 is possibly not completed yet. Break of 110.58 will bring deeper decline. Nonetheless, in that case, we'd expect strong support from 38.2% retracement of 104.62 to 113.17 at 109.90 to bring rebound. On the upside, above 112.14 will target a test on 113.17 high.
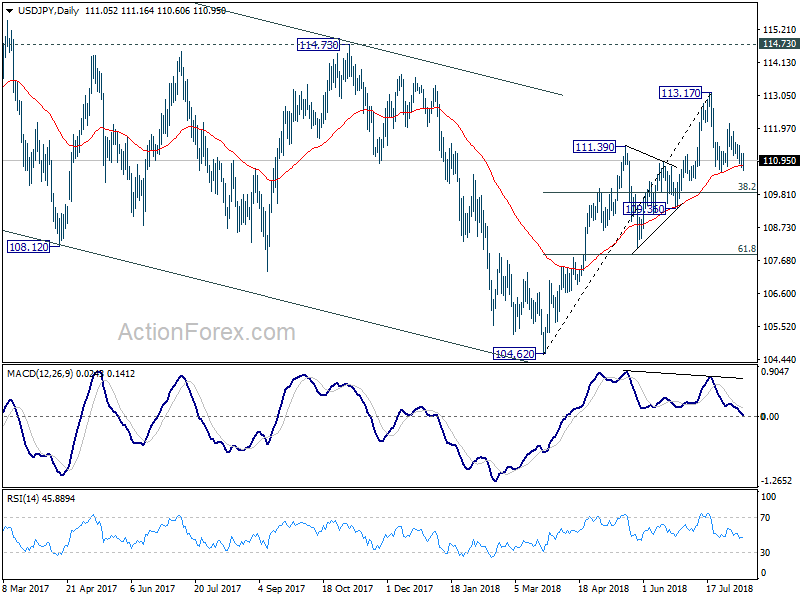
In the bigger picture, corrective fall from 118.65 (2016 high) should have completed with three waves down to 104.62. Decisive break of 114.73 resistance will likely resume whole rally from 98.97 (2016 low) to 100% projection of 98.97 to 118.65 from 104.62 at 124.30, which is reasonably close to 125.85 (2015 high). This will stay as the preferred case as long as 109.36 support holds.
USD/CHF Mid-Day Outlook
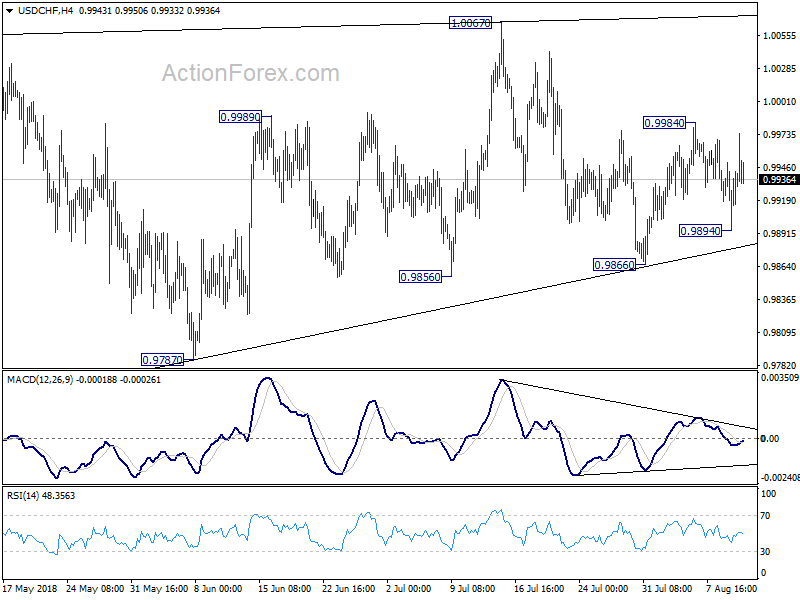
Daily Pivots: (S1) 0.9904; (P) 0.9927; (R1) 0.9961; More...
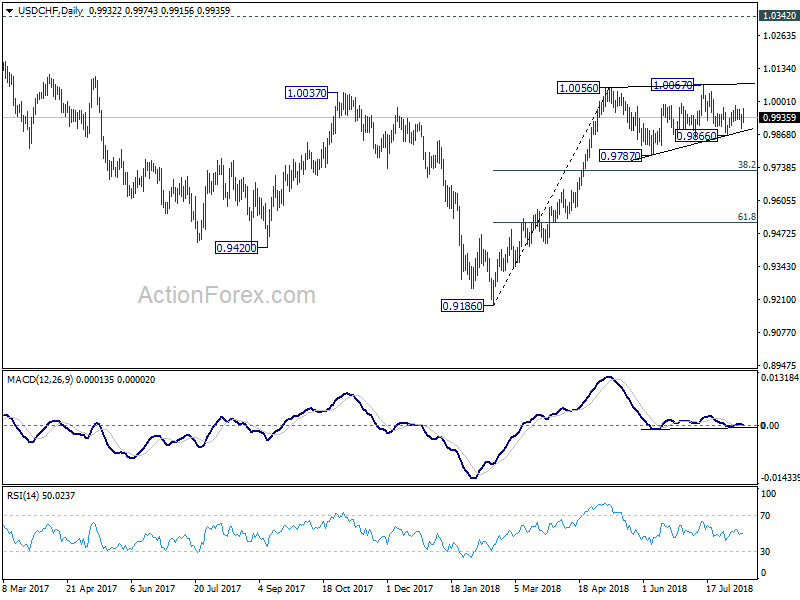
Intraday bias in USD/CHF remains neutral for the moment. On the upside, above 0.9984 will resume the rebound from 0.9866 to retest 1.0067 high. Decisive break there will resume whole rally from 0.9186. On the downside, below 0.9894 might extend the consolidation pattern from 1.0056 with another decline. But downside should be contained by 38.2% retracement of 0.9186 to 1.0056 at 0.9724 to bring rebound.
In the bigger picture, current development suggests that the consolidation pattern from 1.0056 is extending with another leg. As long as 38.2% retracement of 0.9186 to 1.0056 at 0.9724 holds, we'd expect rise from 0.9186 to resume at a later stage to retest 1.0342 key resistance (2016 high). However, sustained break of 0.9724 fibonacci level will bring deeper fall, as another declining leg in the long term range pattern.
GBP/USD Mid-Day Outlook
Daily Pivots: (S1) 1.2793; (P) 1.2852; (R1) 1.2884; More...
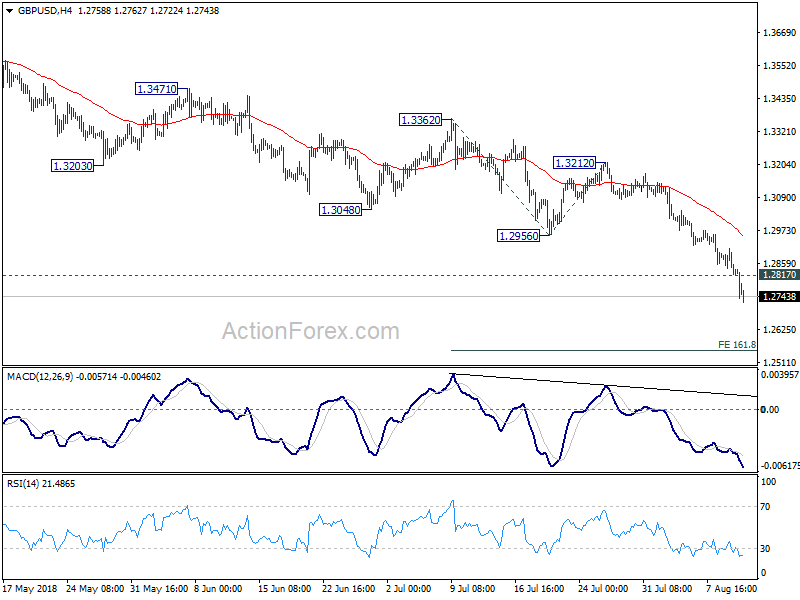
GBP/USD's fall is still in progress and reaches as low as 1.2722 so far. Intraday bias remains on the downside for 161.8% projection of 1.3362 to 1.2956 from 1.3212 at 1.2555 next. On the upside, above 1.2817 minor resistance will turn intraday bias neutral and bring consolidations. But recovery should be limited by 1.2956 support turned resistance to bring fall resumption.
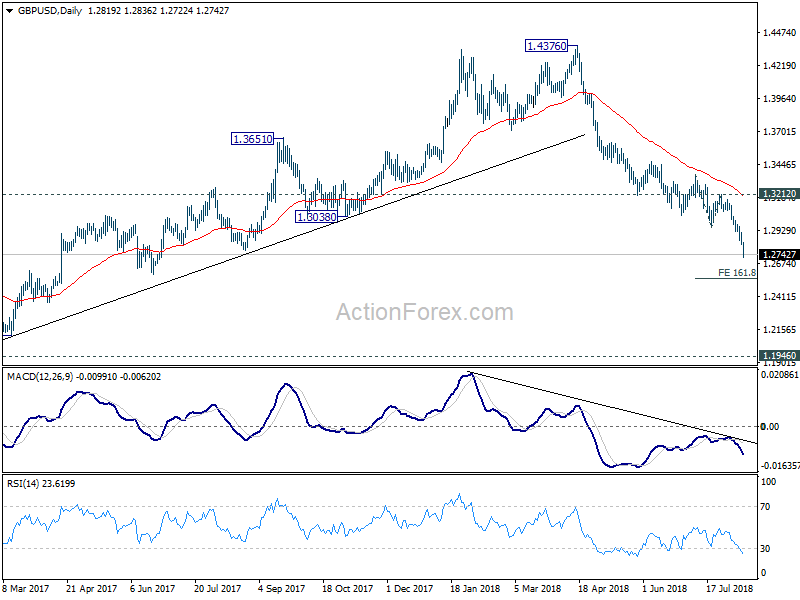
In the bigger picture, whole medium term rebound from 1.1946 (2016 low) should have completed at 1.4376 already, after rejection from 55 month EMA (now at 1.4141). Fall from 1.4376 has met 61.8% retracement of 1.1946 (2016 low) to 1.4376 at 1.2874 already. Decisive break of 1.2874 will raise the chance of long term down trend resumption through 1.1946 low. On the upside, break of 1.3212 resistance is needed to be the first indication of medium term bottoming. Otherwise, outlook will remain bearish even in case of strong rebound.
Canada Starts the Summer With More (Part-Time) Jobs
The Canadian economy added 54.1k net jobs in July. With only a small gain in the labour force, the unemployment rate fell two ticks, to 5.8%.
The details of the report were again mixed. Part-time employment led the rise for a third straight month, adding 82.0k net positions. Full-time employment saw a small pull-back (-28.0k). By type, it was largely the public sector that hired on net in July (+49.6k), as private employers added a net 5.2k employees. Rounding it out was a decline of 0.7k in self-employment.
The service sector led the way, adding 90.5k positions on net, with notable gains in educational services (36.5k) and health care (30.7k). In contrast, 36.5k net positions were shed among goods producers, including manufacturers (-18.4k) and the construction sector (-12.3k).
The action was again concentrated in Ontario, where 60.6k net jobs were added. B.C. added 11.2k, while the remaining provinces turned in weak or negative performances.
With more Canadians employed, aggregate hours rose a respectable 0.5% month-on-month (1.3% year-on-year). It was a less positive story for wages. Average hourly earnings for permanent employees were up 3.0% year-on-year, decelerating for a second month. Wage growth above 3% was reported in less than half of major industries – the first time this year.
Dialing the lens back a notch, July saw trend (6 month moving average) job growth move back into positive territory, at 20.8k. On a year-on-year basis, job growth ticked up to 1.3%, in line with the gradual deceleration that began around mid-2017.
Key Implications
That could have been better, could have been worse. A solid headline number masked less than optimal details: all part-time hiring, and by and large public sector, driven by universities. On the plus side, the number of unemployed fell and more Canadians were drawn to the labour force – both signs of a healthy economy. A respectable gain in aggregate hours worked also bodes well for output growth.
It is definitely not time to ring the alarm given the noise of this data, but wage developments bear watching. We're still bouncing around the 3% mark – solid by historic standards, so let's hope the bit of deceleration in June and July doesn't become a trend.
We're still a ways away from the next Bank of Canada rate decision, but with this first glimpse of third quarter activity kicking things off more or less on the right foot, the conditions remain right for further rate increases. As discussed in our latest Dollars and Sense, it looks like we're set to see another quarter-point hike this October.
US: Core Inflation Hits its Highest Level in Close to a Decade in July
Consumer prices rose 0.2% in July in line with consensus expectations. Core CPI (excluding food and energy) also rose by 0.2%, the fastest gain since January.
From a year ago, headline inflation was unchanged at 2.9%, while the core rate edged up to 2.4% (from 2.3% in June), hitting its highest level since September 2008.
Energy prices fell 0.5% (month-on-month), declining for a second straight month. Food prices were up a modest 0.1%.
Core goods prices rose for the first time in five months, up 0.1% (month-on-month) while core services accelerated to 0.3% (from 0.2%).
Key Implications
Inflation has yet to show major signs of acceleration, but July marked a step in this direction. With the gain in prices, the Fed's preferred core PCE metric is likely to hit 2.0% on a year-on-year basis in the month.
We have learned to temper our expectations for inflation, but all of the pieces are in place for price growth to move higher. The labor market is tight, with more job openings than people to fill them, domestic demand is being buoyed by tax cuts and spending, and tariffs will soon raise the price of imported consumer goods.
With both inflation and employment at target, the economic data are supportive of the Fed's expected path for interest rate increases, with two more likely before the year comes to a close. As we discussed in our recent Dollars and Sense, faster inflation could be key to pushing longer-term bond yields higher and preventing the yield curve from inverting as the Fed continues to push short-term rates higher.
EUR/USD Mid-Day Outlook
Daily Pivots: (S1) 1.1495; (P) 1.1558 (R1) 1.1590; More.....
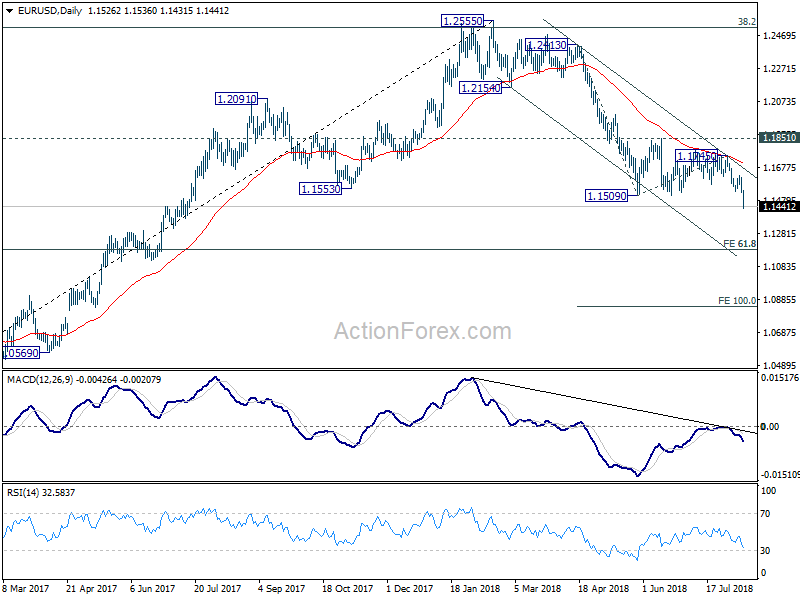
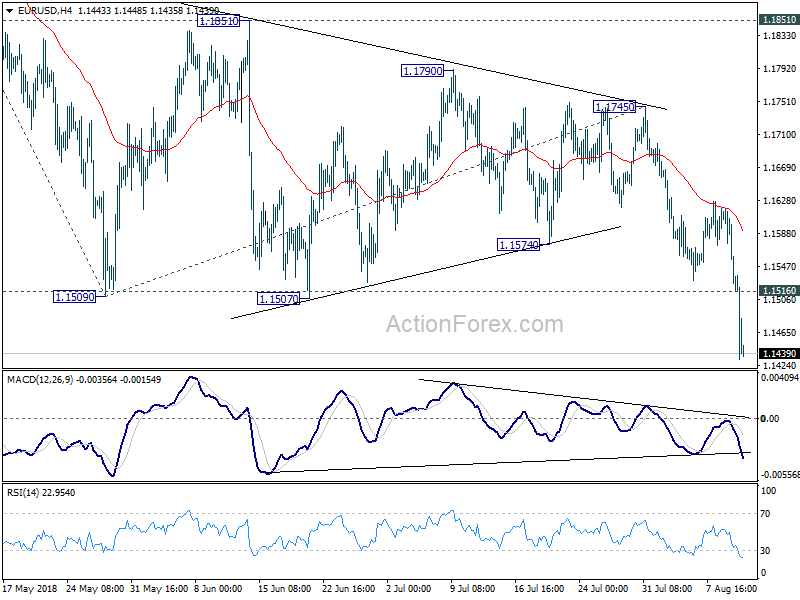
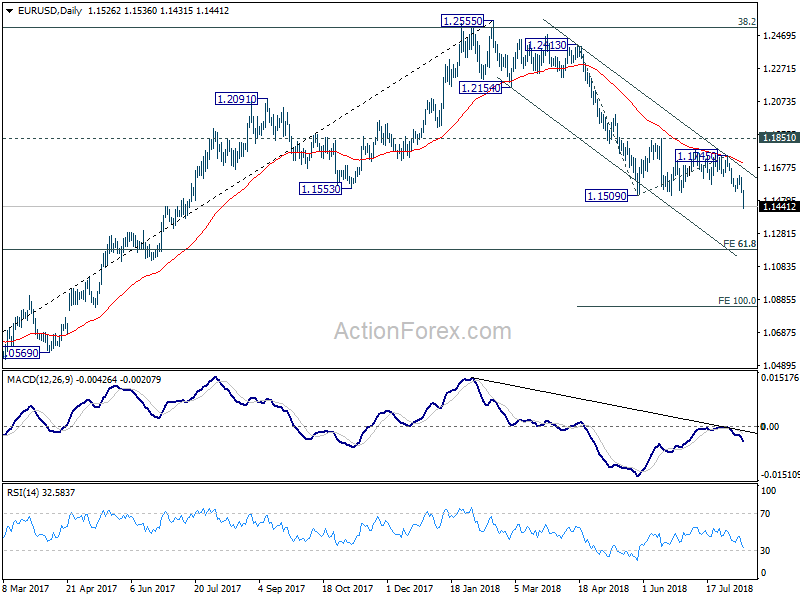
Intraday bias in EUR/USD remains on the downside as the larger down rend from 1.2555 resumes today. Further decline should be seen to 61.8% projection of 1.2413 to 1.1509 from 1.1745 at 1.1186. Note that it's a cluster level with 61.8% retracement of 1.0339 to 1.2555 at 1.1186. Hence, we'll tentatively look for short term bottoming around 1.1186. On the upside, above 1.1516 minor resistance will turn bias neutral and bring consolidations first, before staging another decline.
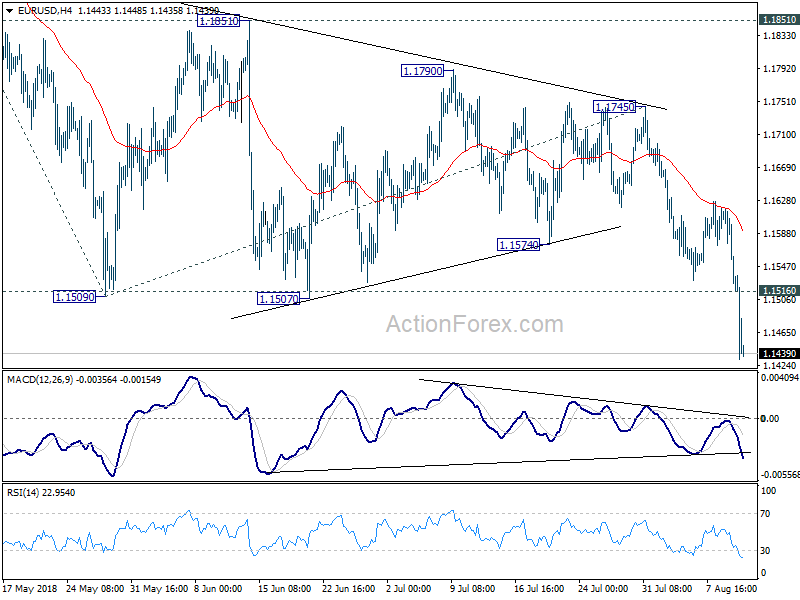
In the bigger picture, the down trend from 1.2555 medium term is in progress for 61.8% retracement of 1.0339 to 1.2555 at 1.1186. Note again that EUR/USD was rejected by 38.2% retracement of 1.6039 (2008 high) to 1.0339 (2017 low) at 1.2516. That carries some long term bearish implications. Sustained break of 1.1186 could pave the way back to retest 1.0339 low. For now, even in case of rebound, we won't consider the fall from 1.2555 as finished as long as 1.1851 resistance holds.
Dollar, Yen and Swiss Franc Surge as Turkish Crisis Prompts Flight to Safety
Dollar, Yen and Swiss Franc are trading as the strongest ones today as supported by solid safe haven flow. The free fall in Turkish Lira raised concerns of contagion to Eurozone financial system. Such worries sends the Euro broadly lower, even though Australian Dollar performs even worse. Crisis speech of Turkish President Erdogan doesn't ease the worries a little bit. Euro remains generally weak and is vulnerable to deeper fall. Adding to that, Dollar is also firm after stronger than expected core inflation reading. Canadian Dollar is supported by stellar job data. Sterling, however, gets not support on a mixed batch of data.
In other markets, European indices are trading in deep red today with DAX down -1.78% at the time of writing, CAC down -1.29% and FTSE down -0.71%. Earlier today, major Asian indices closed lower, except China. Nikkei closed down -1.33%, Hong Kong HSI down -0.84%, Singapore Strait Times down -1.26%. But Shanghai SSE closed up 0.03% at 2795.31, even though it still could get 2800 in pocket. Despite a strong Dollar, Gold is still bounded in sideway trading around 1210. WTI crude oil is back above 67.
Technically, USD/CHF and USD/JPY are both bounded in tight range for the moment. It's so far uncertain which one of USD, JPY and CHF will win the race for the near term. Similarly, USD/CAD is also staying in tight range below 1.3119 temporary top. But the bullish outlook in USD/CAD is relatively clearer than USD/JPY and USD/CHF. Elsewhere in the forex markets, the stories are already very clearly written in the charts. It's just a matter whether the fast moving pairs will take a breath before weekly close. The more interesting development could be in treasury yield. 10 year yield is pressing 2.9 handle as bonds are boosted by flight to safety
Turkish President Erdogan asks citizens to buy Lira to response to economic attack
Turkish President Tayyip Erdogan delivers a crisis speech the Lira extends recent free fall on US sanctions. Erdogan urges again the Turks to reach for their foreign exchange savings, and exchange dollar and gold for Lira. He said this is the most effective response to the west. And he named the economic attack against Turkey is due to "small differences of opinion" with certain powers". He condemned that such attacks damaged their relationship with Turkey to a point where it's impossible to repair. In short, Erdogan showed no sign of backing down.
Suggested reading on Turkey: Erdogan is to Blame For Turkish Lira's Free Fall
Euro in deep worry of Turkish contagion
The free fall in Turkish Lira is seen as a factors that heavily weighing on Euro today. It's reported that ECB officials are increasingly worried about contagion from Turkey, due to the deep tie with Eurozone financial system.
According to Bank for International Settlements data, Spanish banks are are owed USD 83.3B by Turkish borrowers; French lenders are owed USD 38.4B; and banks in Italy are owed USD 17B. Meanwhile, the Financial Times noted that Spain's BBVA, Italy's UniCredit, and France's BNP Paribas could be particularly impacted by the ongoing depreciation of the lira.
It's seen that a complete banking crisis in Turkey will inevitably have huge impact on Eurozone banks, and even trigger credit crunch. Though, such a worst case scenario is seen as unlikely so far.
UK GDP grew 0.4% qoq in Q2, but June missed expectations
UK GDP grew 0.4% qoq in Q2, doubled that of Q1's 0.2% qoq and met expectations. Year-over-year, GDP grew 1.3% yoy in Q2, also matched expectation. Nonetheless, June GDP grew only 0.1% mom, below expectation of 0.2% mom, notably slower than May's 0.3% mom. Total business investment rose 0.5% qoq in Q2, much stronger than expectation of 0.2% qoq and an impressive rebound from Q1's -0.4% qoq.
Industrial production rose 0.4% mom, 1.1% yoy in June versus expectation of 0.2% mom, 1.9% yoy. Manufacturing production rose 0.4% mom, 1.5% yoy versus expectation of 0.3% mom, 1.9% yoy. Visible trade deficit narrowed to GBP -11.4B versus expectation of -11.9B.
Japan's consumption-led GDP growth beat expectation
Japan GDP grew 0.5% qoq, 1.9% annualized in Q2. That's way stronger than expectation of 0.3% qoq, 1.4% annualized. It's also a strong rebound from prior quarter's -0.2% qoq, -0.6% annualized contraction. Q1 was an unexpected interruption in the best run in the economy since 1980s. In Q2, GDP deflator rose 0.1% yoy, also beat expectation of -0.2% yoy fall.
Private consumption, which accounts for 60% of the economy, grew an impressive 0.7%. The solid growth could be an indication of finally a changing "social mood" in the country. And people are more willing to spend based on the expectation that wages will eventually rise. Getting out of such "social mood" is important for Japan to beat the persistent trend of sluggish low inflation. Such development should be very welcomed by BoJ Meanwhile, Capital expenditure rose 1.3%, strongest since Q4 2016.
Also from Japan, Domestic CGPI rose 3.1% yoy in July versus expectation of 2.9% yoy. Tertiary industry index, however, dropped -0.5% mom in June versus expectation of -0.2% mom.
RBA SoMP reiterates no urgency for rate hike, economic projections largely unchanged
The RBA Statement on Monetary Policy revealed nothing new give then Governor Philip Lowe had delivered an update in a speech earlier this week. In the SoMP, RBA, reiterated that "higher interest rates are likely to be appropriate at some point, if the economy continues to evolve as expected." That is, the next move is "up not down". But, Given the gradual nature of the improvement, however, the Board does not see a strong case to adjust the cash rate in the near term.
RBA's new economic forecasts appear to be largely unchanged from the May SoMP.
- Four-quarter GDP growth is projected to be at 3.25% in Q4 2018, 3.25% in Q2 2019 (revised down from 3.50%), 3.25% in Q4 2019, 3.00% in Q2 2020 and 3.00% in Q4 2020 (new).
- Unemployment rate is projected to be at 5.5% in Q4 2018, 5.25% in Q2 2019, 5.25% in Q4 2019, 5.25% in Q2 2020 and 5.00% in Q4 2020 (new).
- Headline CPI is projected to be at 1.75% in Q4 2018 (revised down from 2.25%), 2.0% in Q2 2019 (revised down from 2.25%), 2.25% in Q4 2019, 2.25% in Q2 2020 and 2.25% in Q4 2020 (new).
- Underlying inflation is projected to be at 1.75% in Q4 2018 (revised down from 2.00%), 2.00% in Q2 2019, 2.00% in Q4 2019, 2.25% in Q2 2020, 2.25% in Q2 2020 (new).
Also released down under, New Zealand BusinessNZ manufacturing PMI dropped to 51.2 in July, down from 52.8.
EUR/USD Mid-Day Outlook
Daily Pivots: (S1) 1.1495; (P) 1.1558 (R1) 1.1590; More.....
Intraday bias in EUR/USD remains on the downside as the larger down rend from 1.2555 resumes today. Further decline should be seen to 61.8% projection of 1.2413 to 1.1509 from 1.1745 at 1.1186. Note that it's a cluster level with 61.8% retracement of 1.0339 to 1.2555 at 1.1186. Hence, we'll tentatively look for short term bottoming around 1.1186. On the upside, above 1.1516 minor resistance will turn bias neutral and bring consolidations first, before staging another decline.
In the bigger picture, the down trend from 1.2555 medium term is in progress for 61.8% retracement of 1.0339 to 1.2555 at 1.1186. Note again that EUR/USD was rejected by 38.2% retracement of 1.6039 (2008 high) to 1.0339 (2017 low) at 1.2516. That carries some long term bearish implications. Sustained break of 1.1186 could pave the way back to retest 1.0339 low. For now, even in case of rebound, we won't consider the fall from 1.2555 as finished as long as 1.1851 resistance holds.
Economic Indicators Update
| GMT | Ccy | Events | Actual | Forecast | Previous | Revised |
|---|---|---|---|---|---|---|
| 22:30 | NZD | BusinessNZ Manufacturing PMI Jul | 51.2 | 52.8 | ||
| 23:50 | JPY | Domestic CGPI Y/Y Jul | 3.10% | 2.90% | 2.80% | |
| 23:50 | JPY | GDP Q/Q Q2 P | 0.50% | 0.30% | -0.20% | |
| 23:50 | JPY | GDP Deflator Y/Y Q2 P | 0.10% | -0.20% | 0.50% | |
| 01:30 | AUD | RBA Monetary Policy Statement | ||||
| 04:30 | JPY | Tertiary Industry Index M/M Jun | -0.50% | -0.20% | 0.10% | |
| 08:30 | GBP | Visible Trade Balance (GBP) Jun | -11.4B | -11.9B | -12.4B | -12.5B |
| 08:30 | GBP | Industrial Production M/M Jun | 0.40% | 0.20% | -0.40% | -0.20% |
| 08:30 | GBP | Industrial Production Y/Y Jun | 1.10% | 1.90% | 0.80% | 1.20% |
| 08:30 | GBP | Manufacturing Production M/M Jun | 0.40% | 0.30% | 0.40% | 0.60% |
| 08:30 | GBP | Manufacturing Production Y/Y Jun | 1.50% | 1.90% | 1.10% | 1.50% |
| 08:30 | GBP | Construction Output M/M Jun | 1.40% | -0.50% | 2.90% | |
| 08:30 | GBP | GDP M/M Jun | 0.10% | 0.20% | 0.30% | |
| 08:30 | GBP | GDP Q/Q Q2 P | 0.40% | 0.40% | 0.20% | |
| 08:30 | GBP | Index of Services 3M/3M Jun | 0.50% | 0.60% | 0.40% | |
| 08:30 | GBP | Total Business Investment Q/Q Q2 P | 0.50% | 0.20% | -0.40% | |
| 12:30 | CAD | Net Change in Employment Jul | 54.1K | 24.0K | 31.8K | |
| 12:30 | CAD | Unemployment Rate Jul | 5.80% | 5.80% | 6.00% | |
| 12:30 | USD | CPI M/M Jul | 0.20% | 0.20% | 0.10% | |
| 12:30 | USD | CPI Y/Y Jul | 2.90% | 3.00% | 2.90% | |
| 12:30 | USD | CPI Core M/M Jul | 0.20% | 0.20% | 0.20% | |
| 12:30 | USD | CPI Core Y/Y Jul | 2.40% | 2.30% | 2.30% |