Sample Category Title
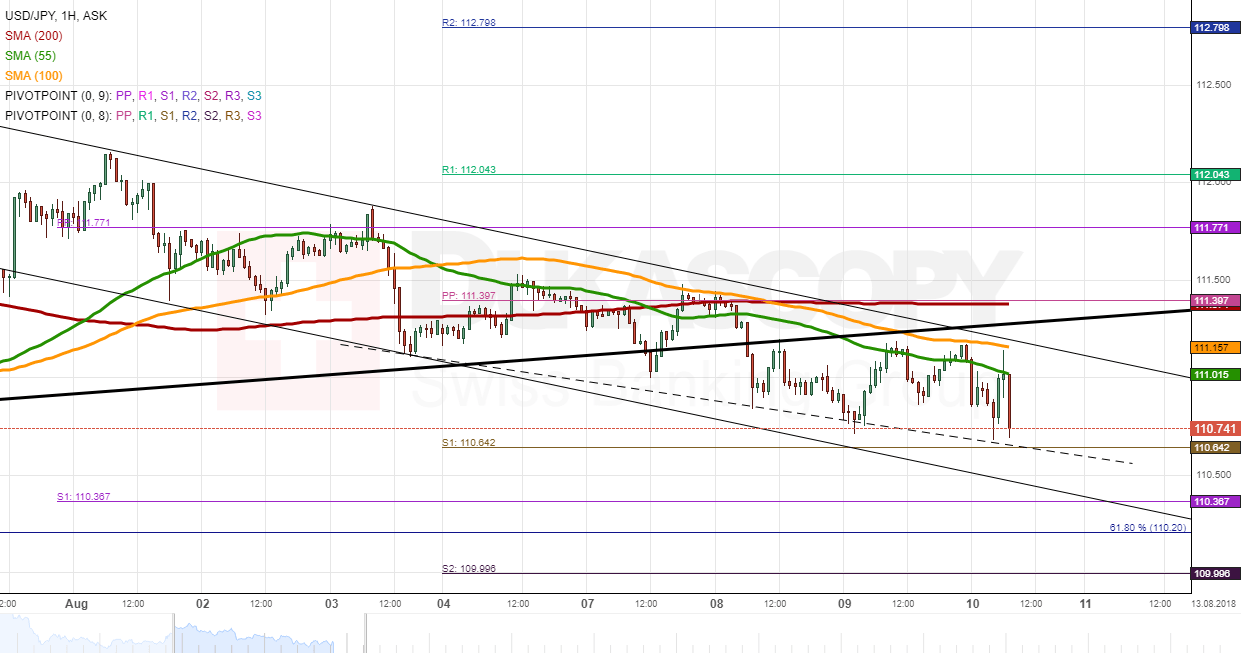
USDJPY Still Intraday Bearish Below 111.00
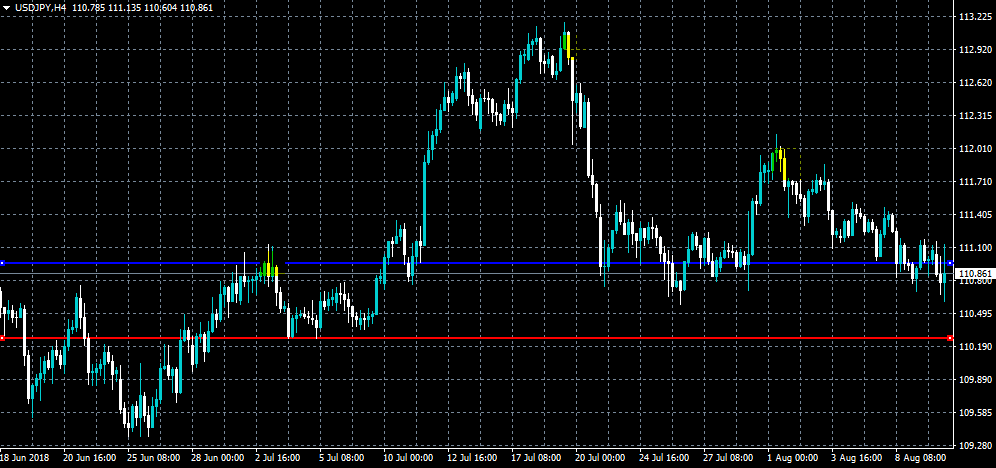
The US dollar remains under heavy selling pressure against the Japanese yen, as worsening political relations between the United States and Turkey have sent financial markets into risk-off mode. Selling pressure is expected to remain on the USDJPY pair while price trades below the 111.00 level, traders should also a potential bearish head and shoulders pattern forming across the higher time frames.
The USDJPY pair is bearish while trading below the 111.00 level, key support is found at the 110.55 and 110.10 levels.
If the USDJPY pair trades above the 111.00 level, buyers will likely test towards the 111.20 and 111.37 resistance levels.
EURUSD Neckline Support Broken
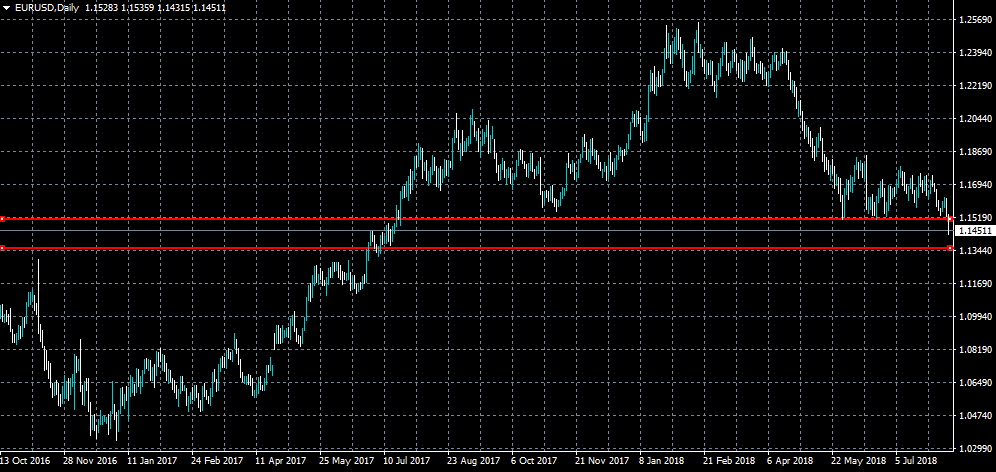
The euro has tumbled below the 1.1500 level against the US dollar, triggering a heavy selling as price broke through the former yearly-low, at 1.1507. The EURUSD pair is heavily bearish while trading below the neckline of the large head and shoulders pattern across the daily time frame. Traders now await the release of key CPI inflation data from the United States economy.
The EURUSD pair is strongly bearish while trading below the 1.1507 level, key support is now found at the 1.1410 and 1.1350 levels.
If the EURUSD pair moves above the 1.1507 level, key resistance is found at the 1.1530 and 1.1553 levels.
The Analytical Overview Of The Main Currency Pairs
The EUR/USD currency pair
Technical indicators of the currency pair:
Prev Open: 1.16098
Open: 1.15260
% chg. over the last day: -0.75
Day's range: 1.14564 – 1.14719
52 wk range: 1.0571 – 1.2557
There are aggressive sales on the EUR/USD currency pair. During yesterday's and today's trading sessions, quotes have decreased by more than 150 points. At the moment, the key support and resistance levels are 1.14400 and 1.15000, respectively. We recommend opening positions from these marks. In the near future, technical correction is not ruled out.
The news feed on 2018.08.10:
Core consumer price index in the US at 15:30 (GMT+3:00).
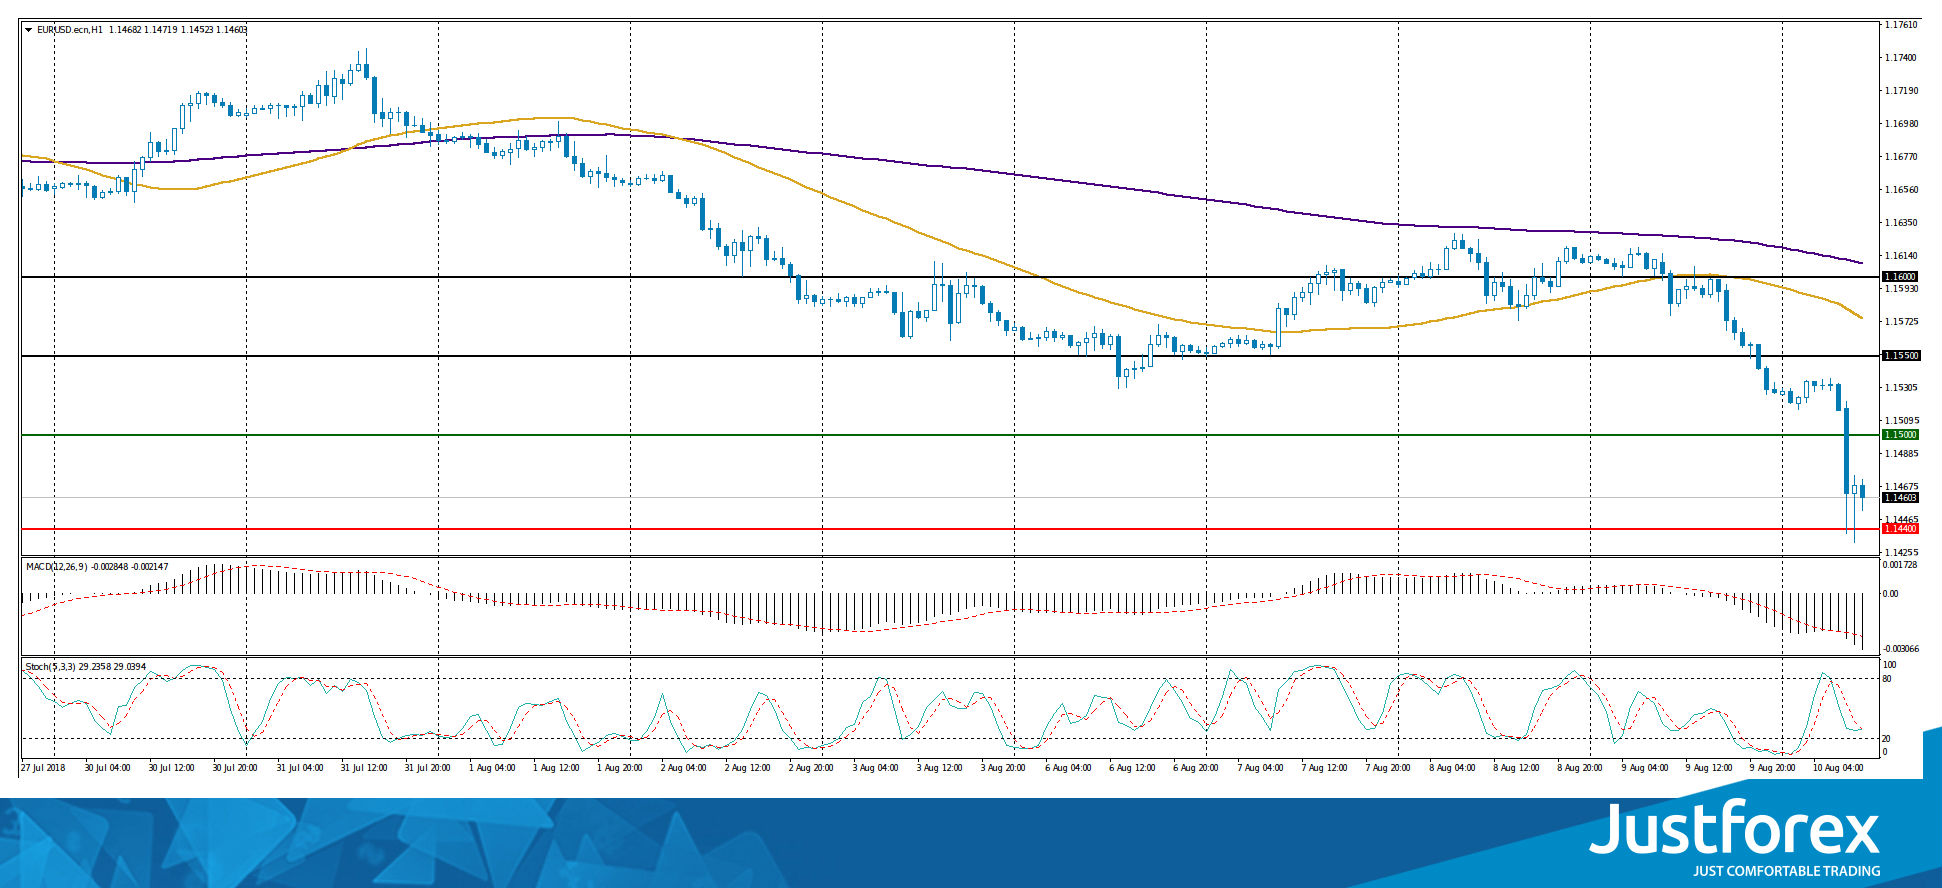
Indicators point to the power of sellers: the price has fixed below 50 MA and 200 MA.
The MACD histogram is located in the negative zone and below the signal line, which gives a strong signal to sell EUR/USD.
Stochastic Oscillator is in the neutral zone, the %K line is crossing the %D line. There are no accurate signals.
Trading recommendations
Support levels: 1.14400, 1.14000
Resistance levels: 1.15000, 1.15500, 1.16000
If the price fixes above the round level of 1.15000, the EUR/USD quotes are expected to correct. The movement is tending to 1.15500-1.15700.
Alternative option. If the price fixes below the support level of 1.14400, it is necessary to consider sales of EUR/USD. The movement is tending to 1.14000-1.13800.
The GBP/USD currency pair
Technical indicators of the currency pair:
Prev Open: 1.28790
Open: 1.28240
% chg. over the last day: -0.41
Day's range: 1.27727 – 1.27921
52 wk range: 1.2361 – 1.4345
The bearish sentiment prevails on the GBP/USD currency pair. During yesterday's and today's trading sessions, quotes have decreased by more than 100 points. Financial market participants expect statistics on the UK GDP. At the moment, the local support and resistance levels are 1.27400 and 1.28000, respectively. In the near future, technical correction is not ruled out.
The news feed on 2018.08.10:
Data on the UK GDP at 11:30 (GMT+3:00);
Manufacturing production in the UK at 11:30 (GMT+3:00).
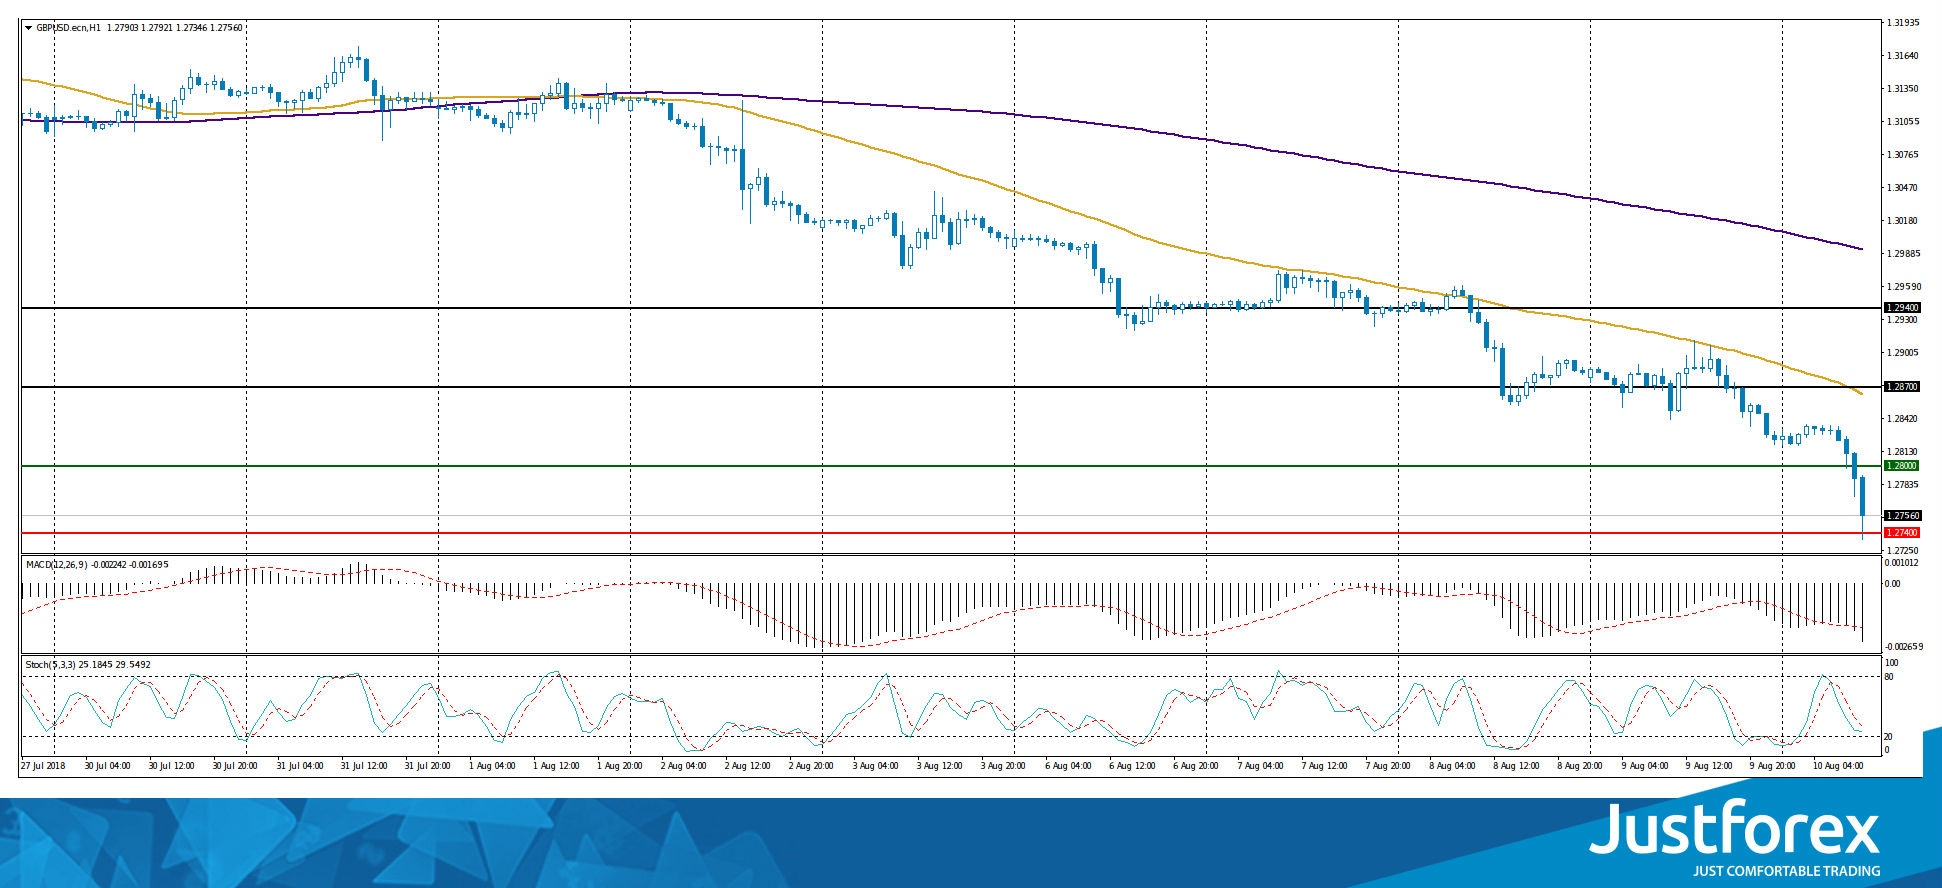
Indicators point to the power of sellers: the price has fixed below 50 MA and 200 MA.
The MACD histogram is in the negative zone and below the signal line, which gives a strong signal to sell GBP/USD.
Stochastic Oscillator is located in the neutral zone, the %K line is below the %D line, which also indicates the bearish sentiment.
Trading recommendations
Support levels: 1.27400, 1.27000
Resistance levels: 1.28000, 1.28700, 1.29400
If the price fixes below the level of 1.27400, the GBP/USD quotes are expected to fall. The movement is tending to 1.27000-1.26800.
Alternative option. If the price fixes above the round level of 1.28000, correction movement is expected. The movement is tending to 1.28500-1.28700.
The USD/CAD currency pair
Technical indicators of the currency pair:
Prev Open: 1.30481
Open: 1.30494
% chg. over the last day: +0.18
Day's range: 1.30432 – 1.30496
52 wk range: 1.2059 – 1.3795
There is the bullish sentiment on the USD/CAD currency pair. During yesterday's and today's trading sessions, quotes have risen by more than 80 points. At the moment, the key support and resistance levels are 1.30700 and 1.31000, respectively. The trading instrument has the potential for further growth.
At 15:30 (GMT+3:00) a report on the labor market will be published in Canada.
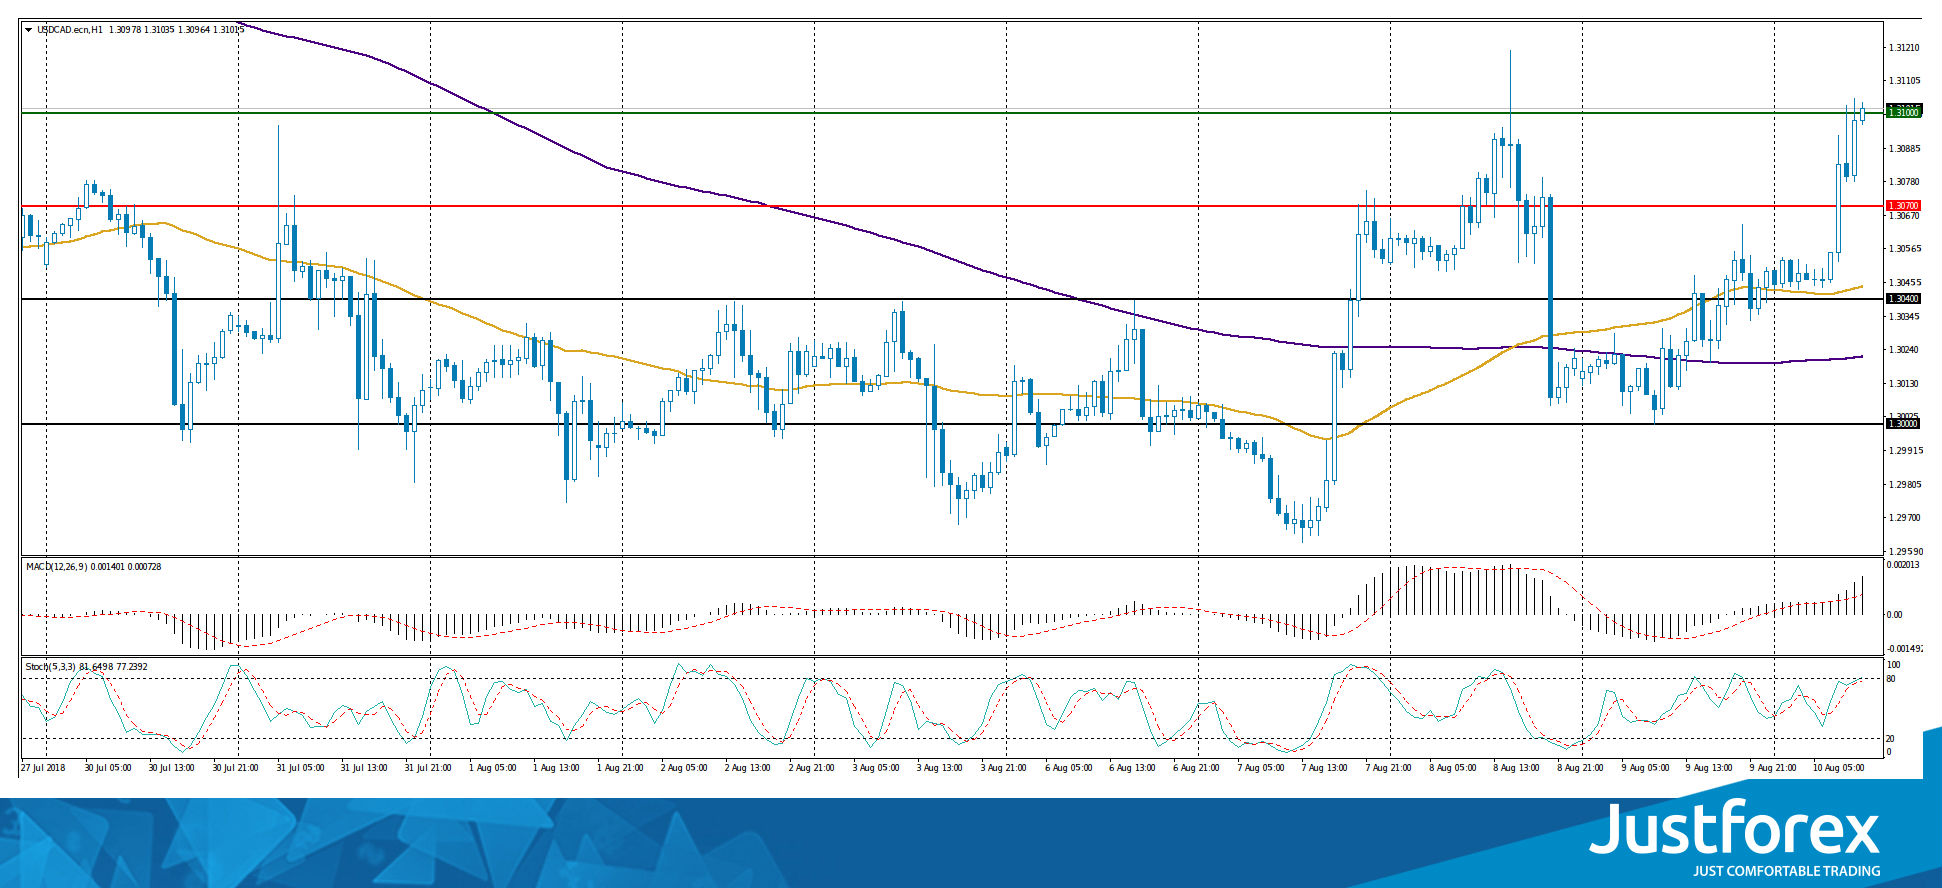
Indicators point to the power of buyers: the price has fixed above 50 MA and 200 MA.
The MACD histogram is in the positive zone and above the signal line, which signals to buy USD/CAD.
Stochastic Oscillator is located in the neutral zone, the %K line is crossing the %D line. There are no signals at the moment.
Trading recommendations
Support levels: 1.30700, 1.30400, 1.30000
Resistance levels: 1.31000, 1.31500
If the price fixes above the key resistance of 1.31000, the USD/CAD quotes are expected to grow. The target movement level is 1.31500-1.31700.
Alternative option. If the price fixes below 1.30700, it is necessary to consider sales of USD/CAD. The movement is tending to 1.30400-1.30200.
The USD/JPY currency pair
Technical indicators of the currency pair:
Prev Open: 110.967
Open: 111.005
% chg. over the last day: +0.10
Day`s range: 110.616 – 111.011
52 wk range: 104.56 – 114.74
There is a variety of trends on the USD/JPY currency pair. At the moment, the trading instrument has started declining. The key support and resistance levels are 110.600 and 111.000, respectively. The positions should be opened from these marks. We recommend paying attention to the dynamics of the US government bonds yield.
Today, positive data on Japan GDP have been published.
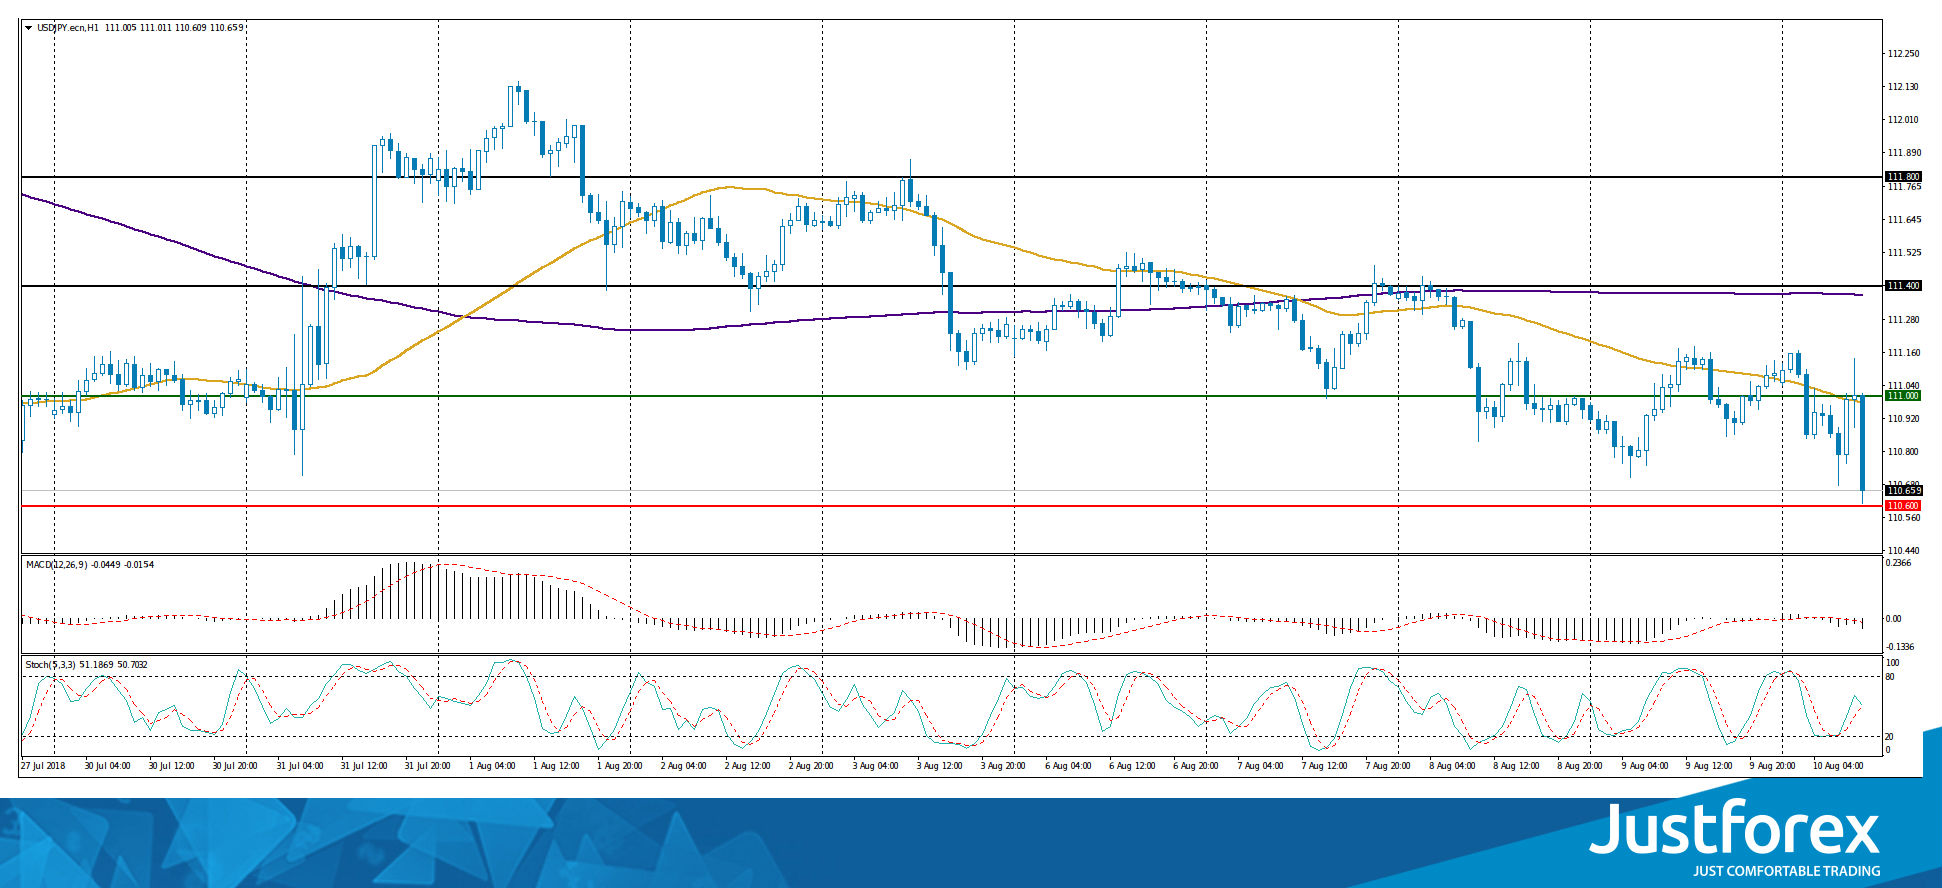
The price has fixed below 50 MA and 200 MA, which indicates the power of sellers.
The MACD histogram is in the negative zone and below the signal line, which gives a strong signal to sell USD/JPY.
Stochastic Oscillator is located in the neutral zone, the %K line is crossing the %D line. There are no accurate signals.
Trading recommendations
Support levels: 110.600, 110.200
Resistance levels: 111.000, 111.400, 111.800
If the price fixes below the level of 110.600, it is necessary to look for entry points to the market to open short positions. The movement is tending to 110.200-110.000.
An alternative is the USD/JPY quotes growth to 111.400-111.600.
GBPJPY Remains Bearish After Dramatic Slump, Records 11-Month Low
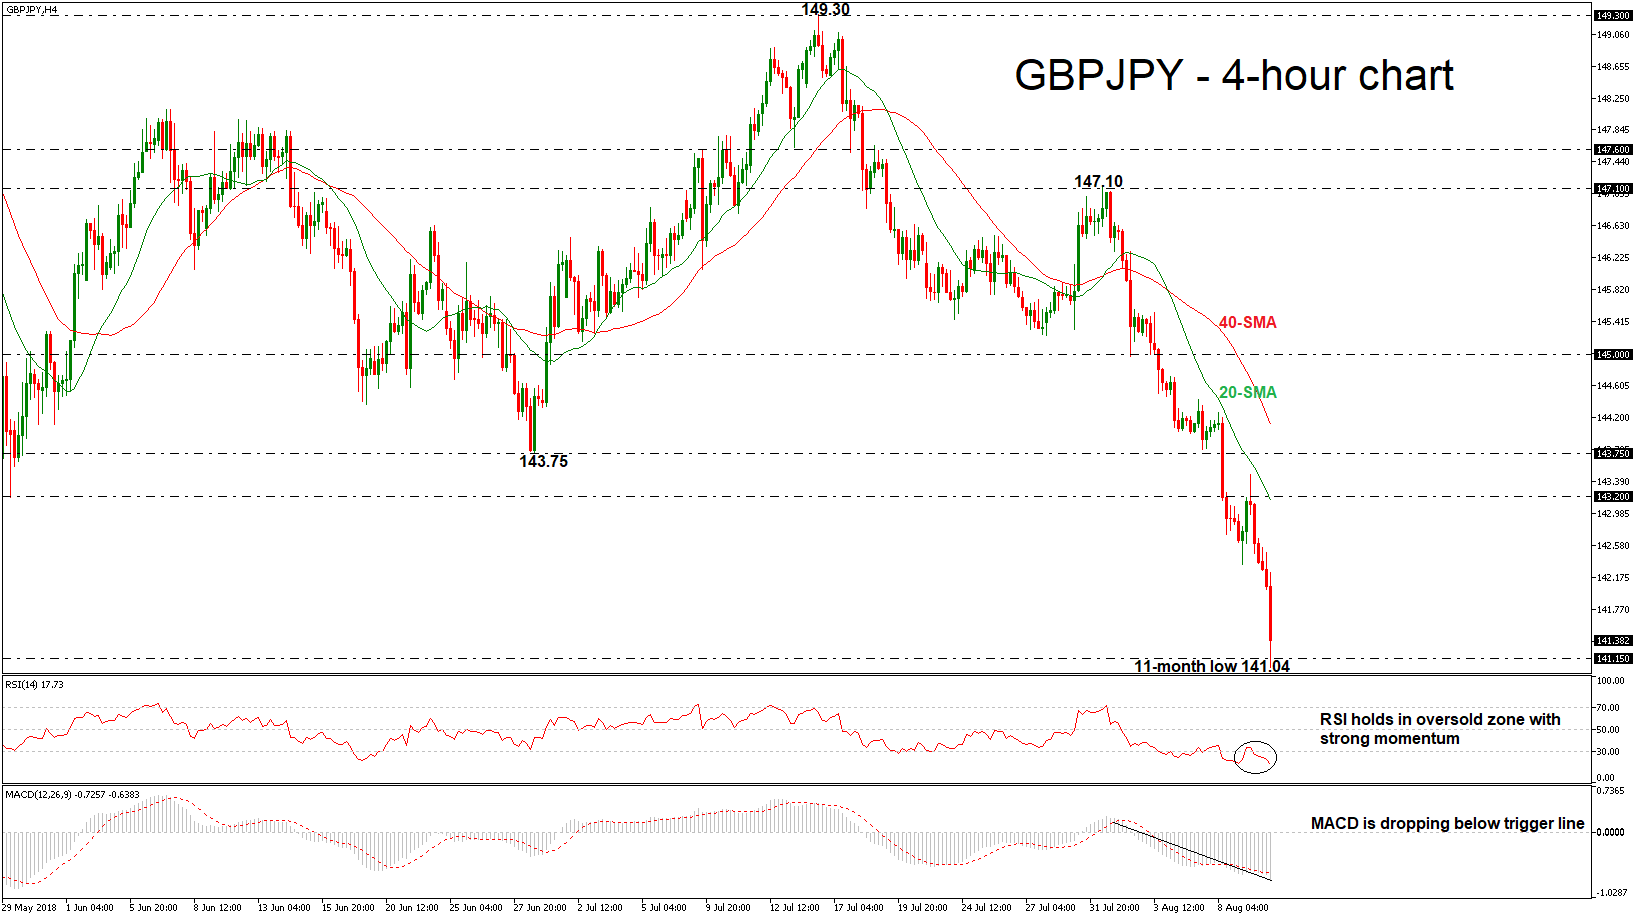
GBPJPY is recording a stunning bearish run this week, touching a fresh eleven-month low of 141.04 on Friday. The aggressive selling interest drove the pair below the 20- and 40-simple moving averages (SMAs) and the 143.20 key level, while the technical indicators suggest that the market could ease more in the short-term.
In the 4-hour chart, the RSI indicator detects increasing negative momentum in the oversold zone and the MACD oscillator has dived below its red trigger line and stands far away from the zero line, both hinting that the next move in prices could be to the downside rather than to the upside.
Should the market extend losses and have a closing day below the 141.15 support, which was last recorded on September 2017, that could see declines towards the 139.30 hurdle, taken from the trough on August 24.
On the other side, if the pair bounces up, immediate resistance could be met at the 143.20 barrier, which stands near the 20-simple moving average (SMA) in the near term. Slightly higher, the 143.75 level could be a strong obstacle for the bulls.
To sum up, looking at the longer timeframe, GBPJPY is set to complete the fourth consecutive negative week after the bounce off the 149.30 resistance hurdle.
Euro pressured on fear of Turkish contagion
The free fall in Turkish Lira is seen as a factors that heavily weighing on Euro today. It's reported that ECB officials are increasingly worried about contagion from Turkey, due to the deep tie with Eurozone financial system.
According to Bank for International Settlements data, Spanish banks are are owed USD 83.3B by Turkish borrowers; French lenders are owed USD 38.4B; and banks in Italy are owed USD 17B. Meanwhile, the Financial Times noted that Spain's BBVA, Italy's UniCredit, and France's BNP Paribas could be particularly impacted by the ongoing depreciation of the lira.
It's seen that a complete banking crisis in Turkey will inevitably have huge impact on Eurozone banks, and even trigger credit crunch. Though, such a worst case scenario is seen as unlikely so far.
While the impact on Euro is significant, European stock indices are also trading broadly lower. At the time of writing, DAX is down -1.54%, CAC down -1.11%, FTSE down -0.62%. It's not that much a disaster so far.
Suggested reading on TRY: Erdogan is to Blame For Turkish Lira's Free Fall
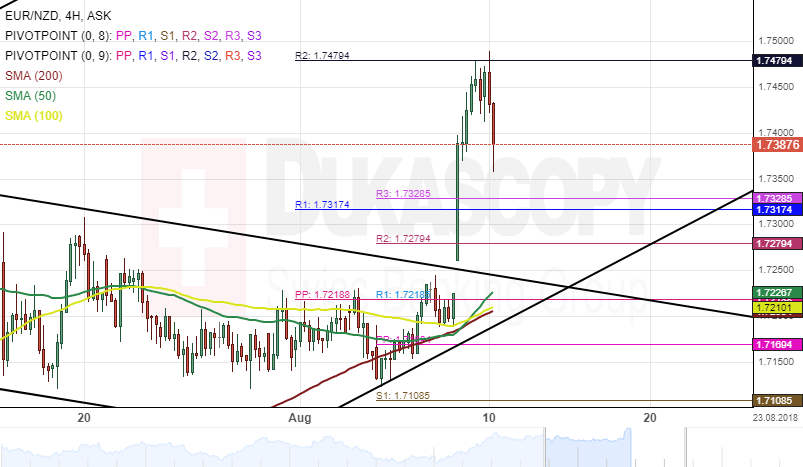
EUR/NZD 4H Chart: Trades With High Volatility
Upside risks dominated the common European currency against the New Zealand Dollar since mid-June. During the past one month, the currency pair has increased its trading range by 5.46%.
The EUR/NZD exchange rate broke a junior descending channel during the end of trading session on Wednesday. Furthermore, the pair tested a significant resistance level set by the monthly pivot point at 1.7479.
Technical indicators on both the smaller and the larger time frames suggest that the bullish sentiment is likely to continue during the following trading sessions. In the meantime, it is expected that the rate makes a brief retracement down within this session.
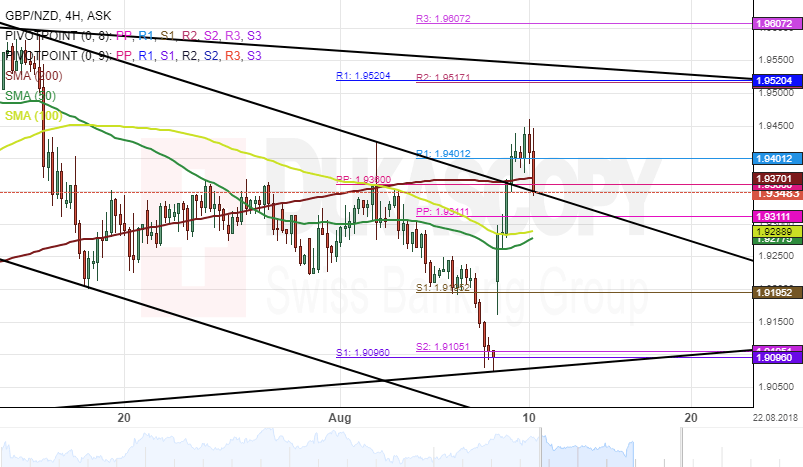
GBP/NZD 4H Chart: Potential Bullish Momentum
The British Pound has depreciated substantially against the New Zealand Dollar during the past month. This bearish sentiment has pressured the exchange rate down to a seven-week low level.
After piercing a support cluster formed by the combination of the weekly and the monthly PPs near the 1.9105 mark, bulls took control of the market, and as a result, the currency exchange rate broke out through the upper boundary of a descending channel pattern.
Given that the 55-, 100-, and 200-hour SMAs are located below the price, it is likely that this bullish momentum continues during the following trading sessions.
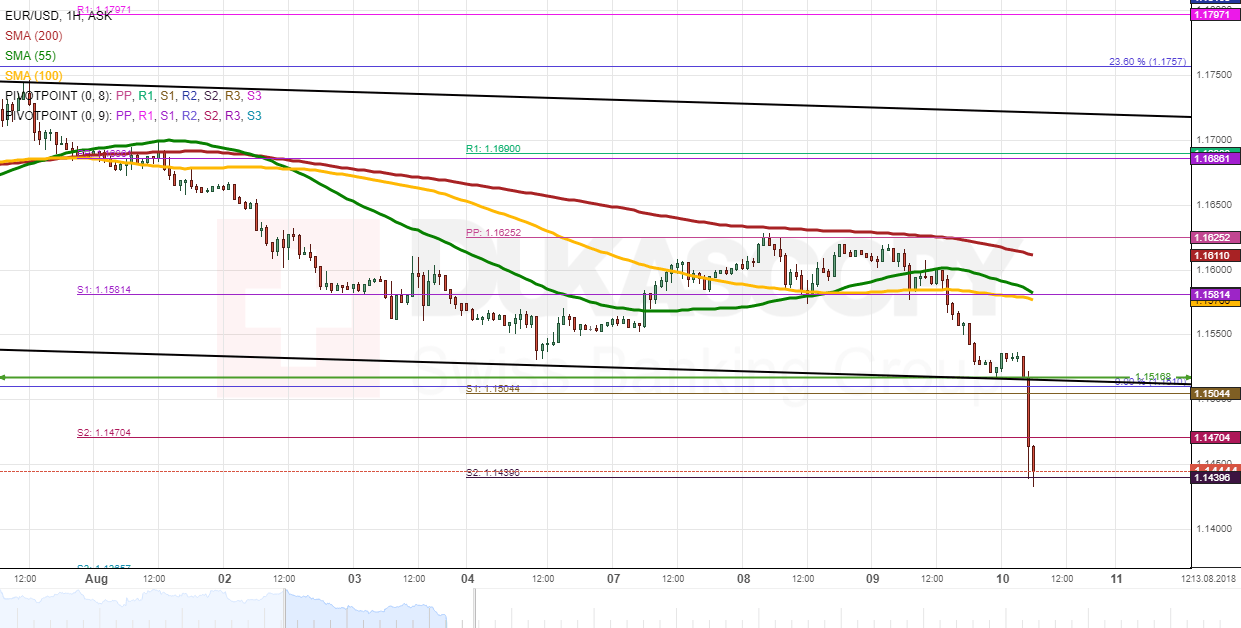
EURUSD Analysis: Plunges Due To Outside Pressure
The Euro failed to overcome the strong resistance of the 200-hour SMA and the weekly PP at 1.1625 on Thursday morning. This increased the bearish pressure which in turn pushed the rate down to the senior channel and a one-year low at 1.1520.
Even this significant support level was helpless early on Friday when investors started to short the Euro in the wake of ECB comments on EU banks' exposure to the weak Turkish Lira. The pair plunged 0.65% within three hours. Two support levels that could halt this plunge are the weekly S2 or the monthly S3 at 1.1440 and 1.1366, accordingly.
Given that the pair is strongly oversold now, bulls may try to take over the market later in the day; however, it should be noted that the above fundamentals are still likely to continue pressuring the rate lower.
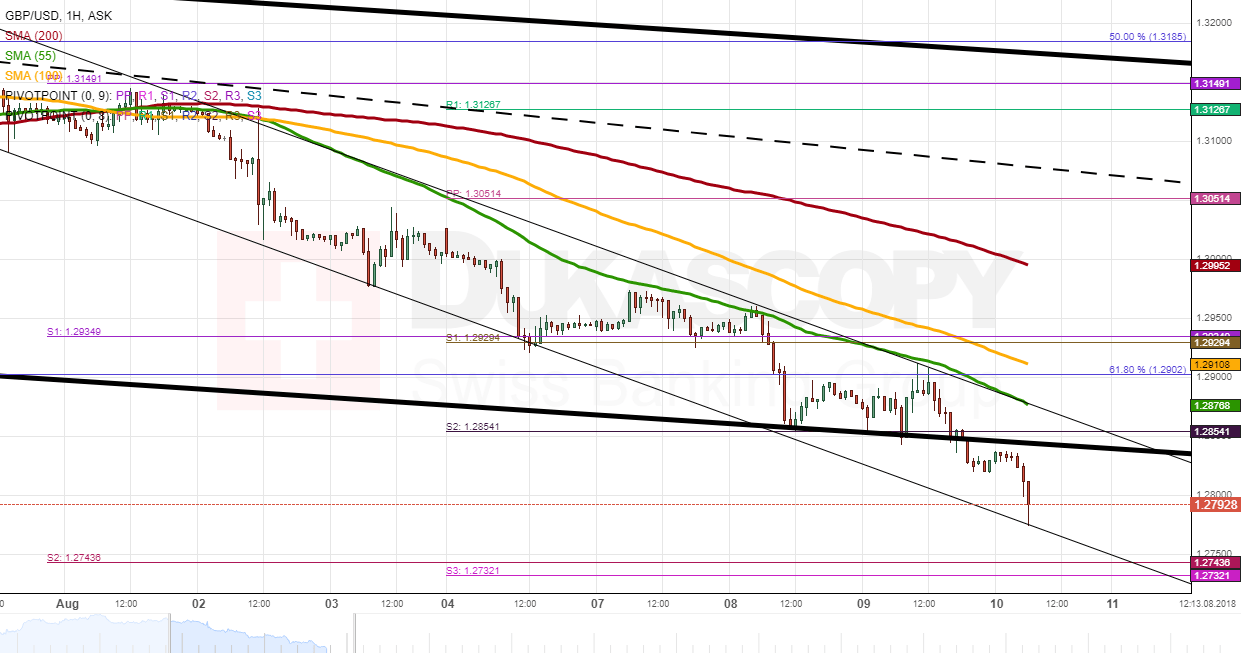
GBPUSD Analysis: Falls Below Senior Pattern
The Sterling has been unable to pick up momentum against the US Dollar, thus in total losing 2.75% since the beginning of August.
On Thursday, GBP/USD was stable during the first part of the day limited by the weekly S2 at 1.2854. This was followed by a change in sentiment mid-session when the rate breached the senior channel and fell down to the psychological 1.28 mark—the pair's lowest position since August 2017.
The rate is clearly oversold which should in turn increase upside risks in the nearest time. If the 1.28 level does not hold the rate, it is likely that the current decline ends only near the monthly S2 and the weekly S3 at 1.2735. From the upside, the Sterling remains restricted by the 55– and 100-hour SMAs near 1.29.
USDJPY Analysis: Cannot Pick Up Momentum
USD/JPY has been consolidating for the second consecutive day, as neither bulls nor bears have been able to leave the current range. Support was provided by the 110.80 mark, while the 55– and 100-hour SMAs still remain an unbreakable resistance level for the pair.
If looking at the most junior channel, the US Dollar has diminished its trading range within this pattern. This suggests that the rate could soon follow the gradually-recovering technical indicators. However, 111.40 still remains a very strong resistance area, as the 55-, 100– and 200-period SMAs on both the 1H and 4H time-frames are located there.
It is unlikely that bulls gather the necessary strength to dash through the given barrier today. Bearish gains should be capped near the monthly S1 at 110.37.