Sample Category Title
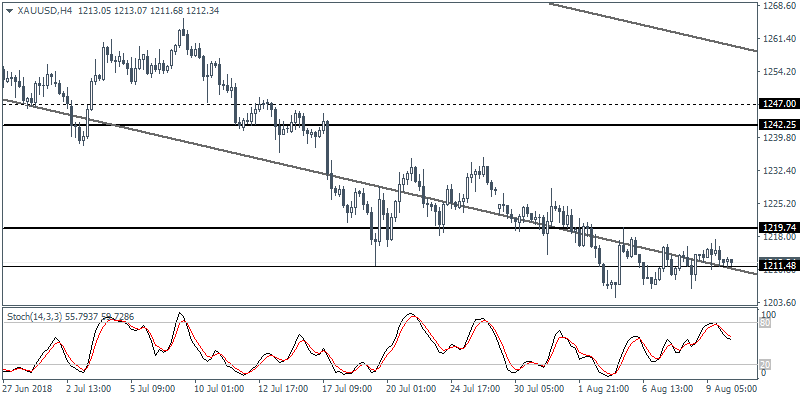
EUR/CHF Look For 1.1445
Pivot (invalidation): 1.1485
Our preference Short positions below 1.1485 with targets at 1.1445 & 1.1420 in extension.
Alternative scenario Above 1.1485 look for further upside with 1.1510 & 1.1535 as targets.
Comment A break below 1.1445 would trigger a drop towards 1.1420.
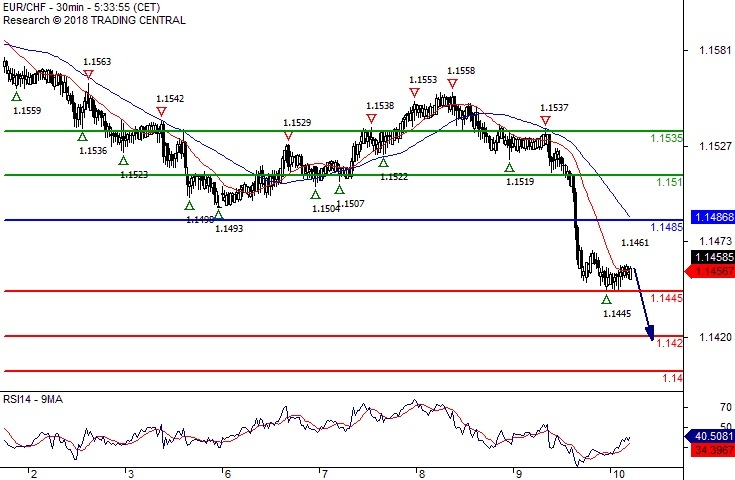
EUR/GBP The Downside Prevails
Pivot (invalidation): 0.9005
Our preference Short positions below 0.9005 with targets at 0.8965 & 0.8945 in extension.
Alternative scenario Above 0.9005 look for further upside with 0.9030 & 0.9045 as targets.
Comment The break below 0.9005 is a negative signal that has opened a path to 0.8965.
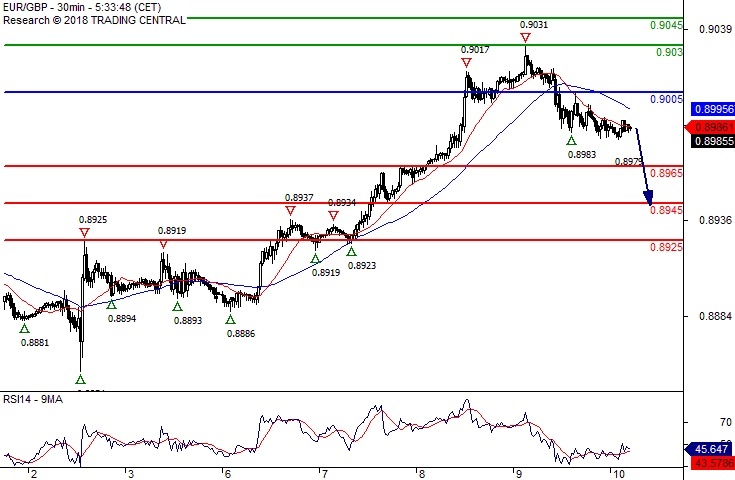
Bitcoin/Dollar Bullish Bias Above 6360
Pivot (invalidation): 6360
Our preference Long positions above 6360 with targets at 6630 & 6835 in extension.
Alternative scenario Below 6360 look for further downside with 6170 & 5985 as targets.
Comment The break above 6360 is a positive signal that has opened a path to 6630.
USDCAD Creates Upside Rally, Could Strengthen Further In Short Term
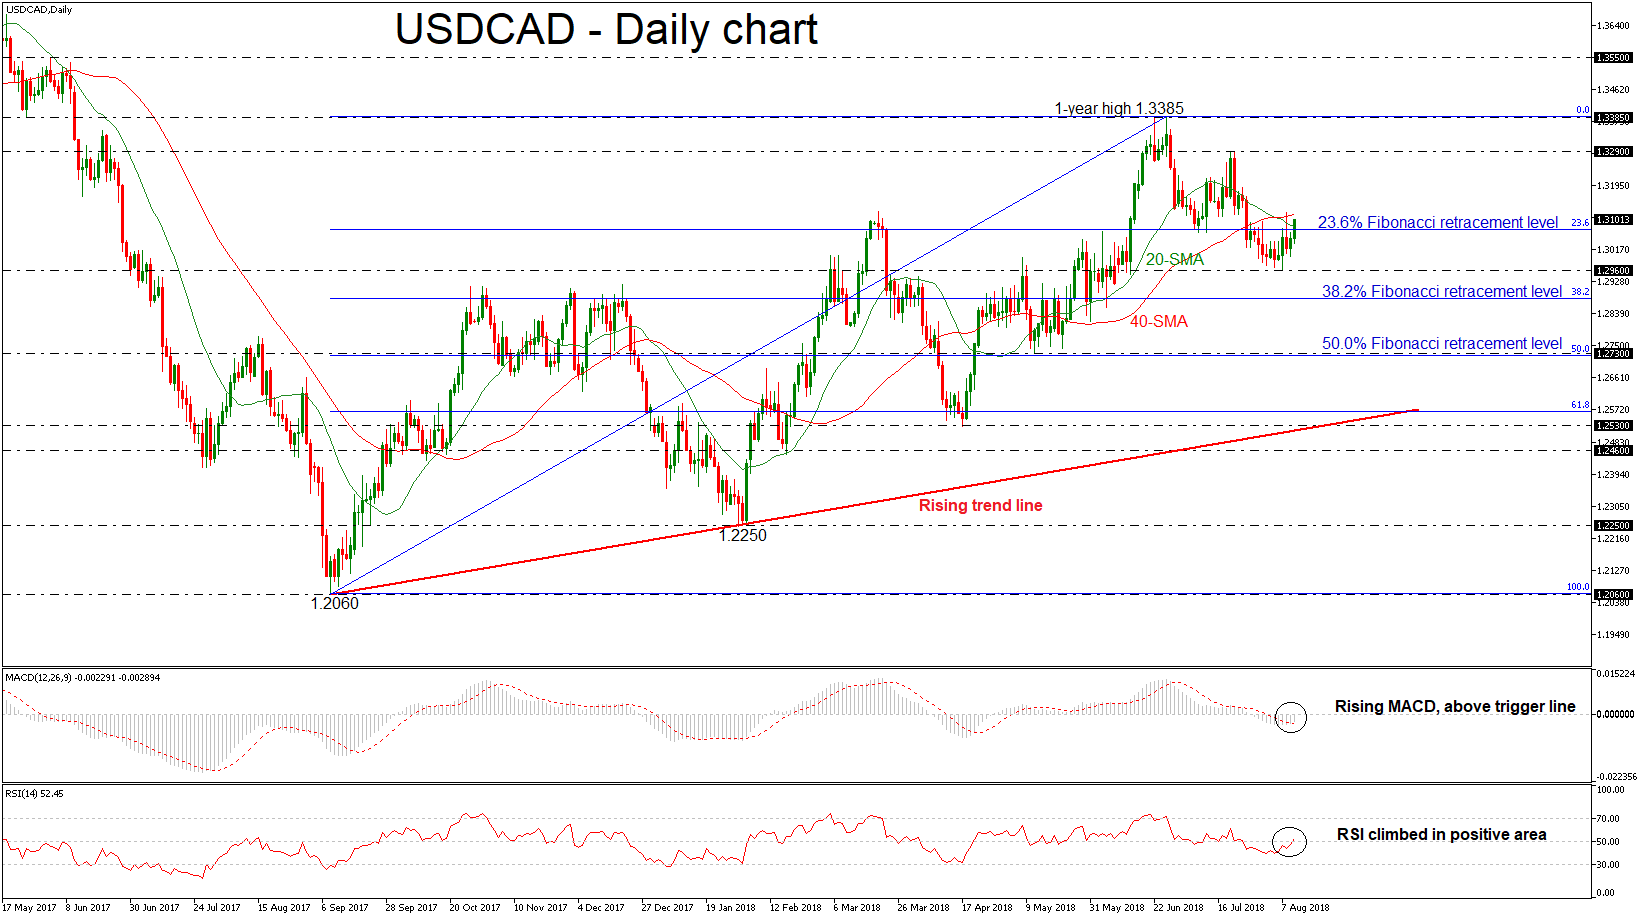
USDCAD started a rally to the upside after it formed a seven-week bottom at 1.2960 on Tuesday. The price crossed above the 20-day simple moving average (SMA) and the 23.6% Fibonacci retracement level of the upleg from 1.2060 to 1.3385, around 1.3072. The technical indicators are confirming the scenario for possible further upside pressure.
Looking at the daily timeframe, the RSI and the MACD have both strengthened, with the former rising sharply and jumping above the 50 level. The latter is heading above its red trigger line but remains below its zero line.
On the upside, the zone within the 1.3072 and 1.3117, outlined by the 23.6% Fibonacci and the 40-SMA could provide immediate resistance. Beyond this area, resistance could then run towards the 1.3290 price level, taken from the peak on July 19. A bullish rally above this hurdle could open the way for the one-year high of 1.3385.
In case of bearish extensions, traders could look for support at the 1.2690 low. Failure to hold above this level could open the door for the 38.2% Fibonacci region near 1.2880. Even lower, the area near the 50.0% Fibonacci, which stands near the 1.2730 barrier, could be another target for the bears.
Having a look at the bigger picture, dollar/loonie has been trading within an ascending movement since September 2017 and in the short-term is ready to edge higher after the bearish correction in the previous weeks.
AUD/USD Daily Outlook
Daily Pivots: (S1) 0.7347; (P) 0.7400; (R1) 0.7427; More...
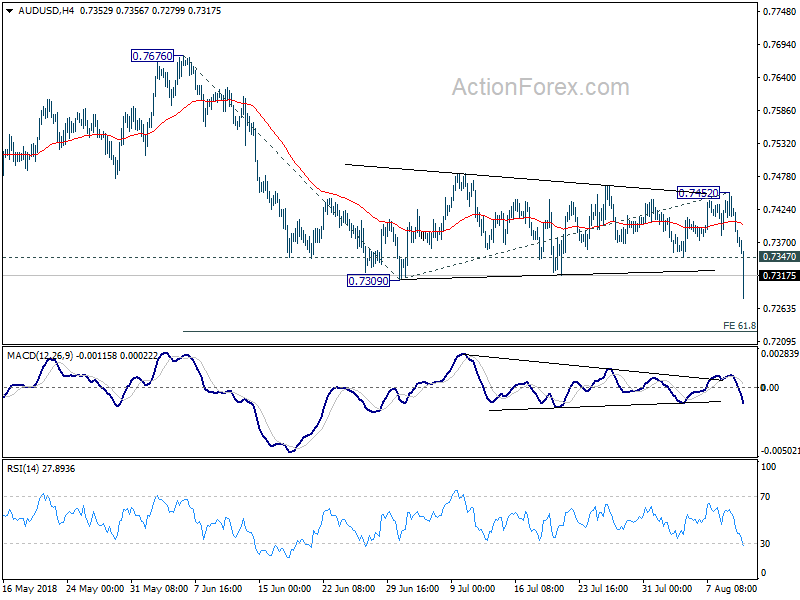
AUD/USD drops to as low as 0.7279 so far today. The break of 0.7309 confirms resumption of whole decline from 0.8135. Intraday bias is back on the downside. Current fall should target 61.8% projection of 0.7676 to 0.7309 from 0.7452 at 0.7225 first. Break will target 100% projection at 0.7085 next. On the upside, above 0.7347 minor resistance will turn intraday bias neutral first. But outlook will stay bearish as long as 0.7452 resistance holds.
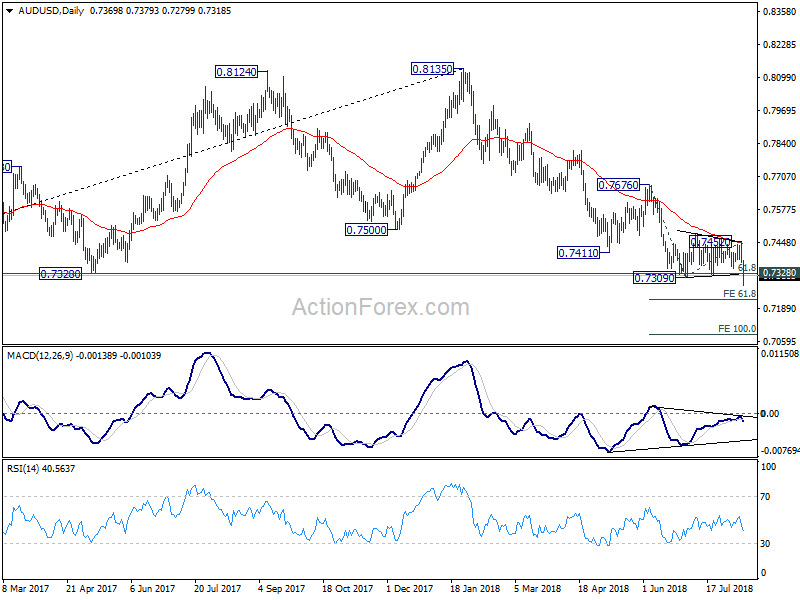
In the bigger picture, medium term rebound from 0.6826 is seen as a corrective move that should be completed at 0.8135. Deeper decline would be seen back to retest 0.6826 low. The break of 0.7328 cluster support (61.8% retracement of 0.6826 to 0.8135 at 0.7326) affirms this bearish view. On the upside, break of 0.7452 resistance might indicate medium term bottoming. But we'll continue to favor the bearish view as long as 0.7676 resistance holds.
GBPUSD Bears Targeting Below 1.2800
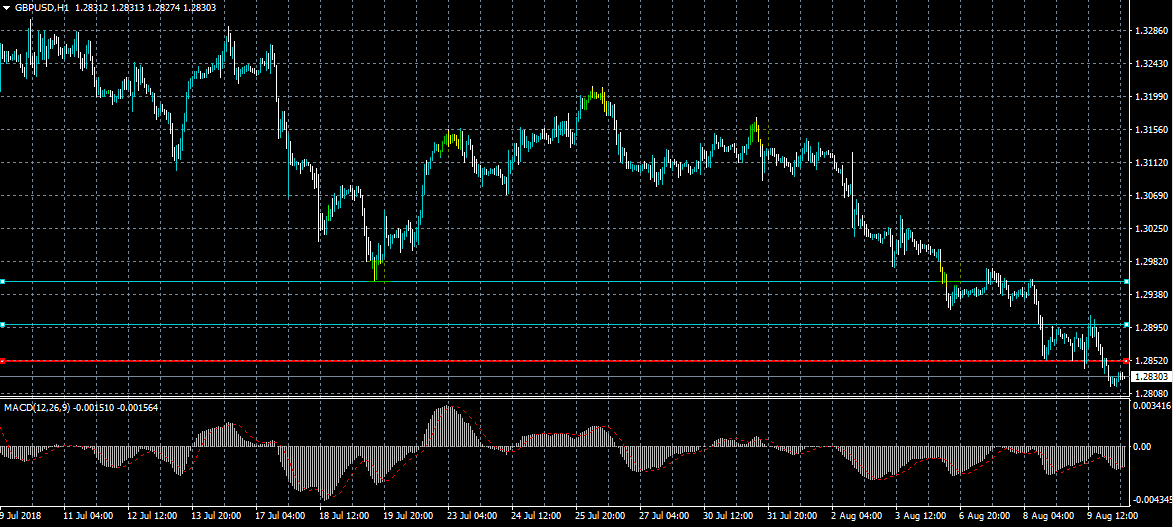
The British pound is edging closer to the 1.2800 level against the US dollar on Friday, as the bearish head and shoulders pattern nears completion. GBPUSD weakness can also be attributed to strength in greenback, with the US dollar index moving towards the highest levels of 2018. Sellers will continue to target the 1.2770 region, while buyers need to stabilize price above the 1.2850 level.
The GBPUSD pair is strongly intraday bearish while trading below the 1.2850 level, key support is found at the 1.2740 and 1.2770 levels.
If the GBPUSD pair moves above the 1.2850 resistance level, key intraday resistance is then found at the 1.2900 and 1.2930 levels.
EURUSD Strongly Bearish Below 1.1553 Level
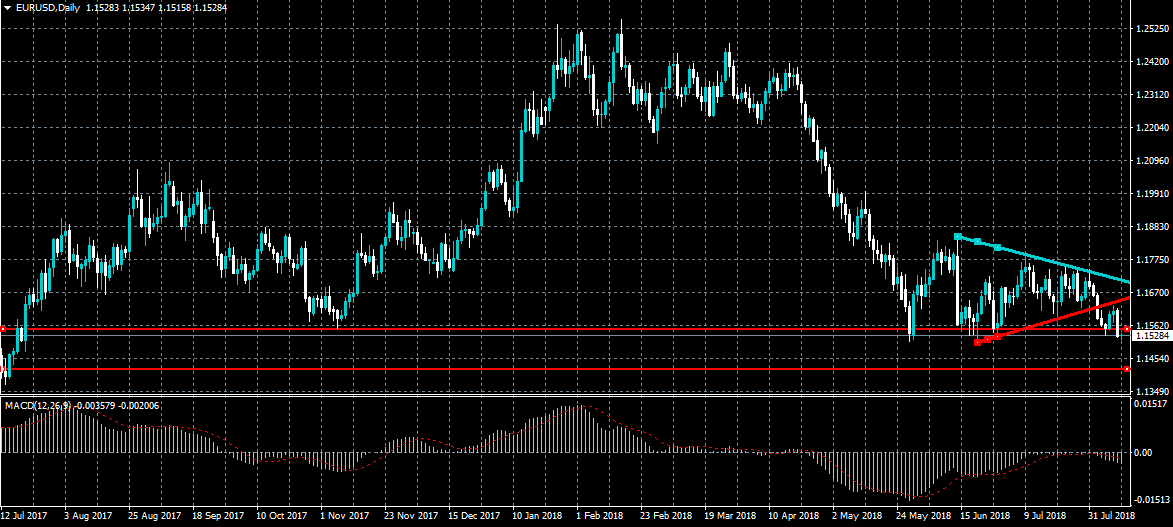
The euro currency has weakened considerably against the US dollar on Friday, with the price falling back towards the 1.1500 support level after the greenback found strong buying demand. The recent corrective-move towards the 1.1600 level appears over and further intraday weakness seems likely while the EURUSD pair trades below the 1.1553 level. The MACD indicator on the daily time frame also suggests further downside appears likely.
The EURUSD pair is intraday bearish while trading below the 1.1553 level, key support is now found at the 1.1507 and 1.1430 levels.
If the EURUSD pair moves above the 1.1553 level key resistance is found at the 1.1580 and 1.1600 levels.
Global Data Flows On Friday
A steady stream of economic data will dominate the headlines on Friday, with the United Kingdom and the United States set to produce high-profile releases.
Action begins at 06:45 GMT with a pair of French reports on industrial output and nonfarm payrolls. France's industrial production likely rose 0.5% for June. Nonfarm payrolls are projected to climb 0.3% in the second quarter.
The Italian government will report on the national goods trade balance at 08:00 GMT. Rome's trade surplus is projected to narrow slightly.
At 08:30 GMT, the UK's Office for National Statistics will report on second-quarter GDP, trade, manufacturing production and industrial production. Gross domestic product – the value of all goods and services produced in the economy – is forecast to rise 0.4% in Q2 and 1.3% annually.
London's total trade deficit with the rest of the world likely narrowed to £2.5 billion in June from £2.79 billion. Meanwhile, industrial production is forecast to rise 0.4% in June. Manufacturing output is also pegged at 1% growth.
Shifting gears to the United States, the Department of Labor will produce the monthly consumer price index (CPI) at 12:30 GMT. CPI is forecast to rise 0.2% in July and 3% annually. Excluding food and energy, so-called core inflation is expected to gain 2.3% year-over-year.
North of the border, the Canadian government will produce monthly employment numbers at 12:30 GMT. Canada's economy likely added 17,000 jobs for July compared with a net gain of 31,800 in June. The jobless rate is forecast to edge down to 5.9% from 6%.
USD/CAD
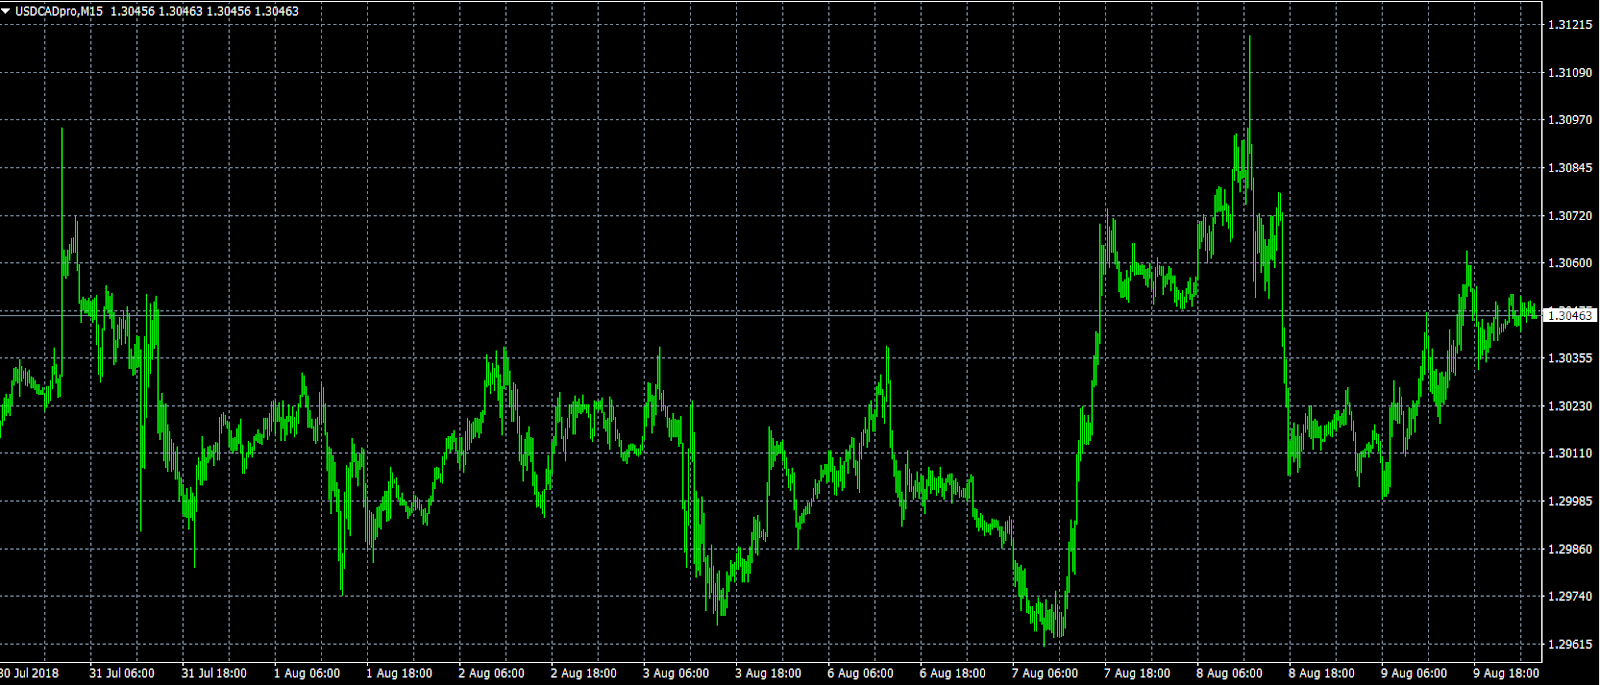
The North American pair has experienced tepid trading conditions over the past two days, as prices continue to claw back from Wednesday's sharp decline. The USD/CAD exchange rate is currently trading at 1.3048, with the bulls eyeing a return to the 1.3100 level, which is consistent with the high from Wednesday. Volatility in the commodity markets could make this pair an attractive bet for those expecting further depreciation in the loonie.
GBP/USD
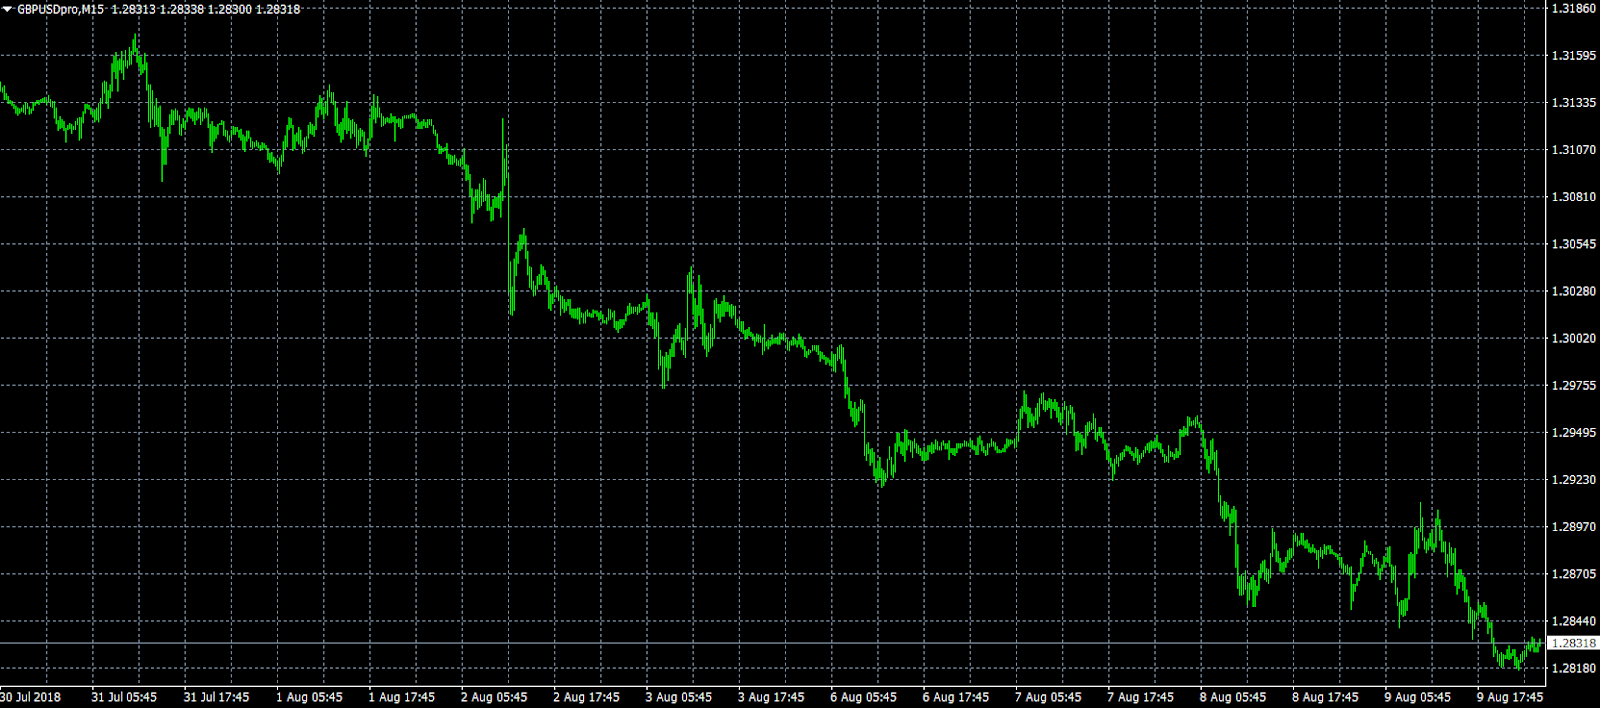
Cable was unable to break free from the downtrend on Thursday, as prices continued to hover near yearly lows. At the time of writing, the GBP/USD exchange rate was trading at 1.2832, where it was little changed compared with yesterday. Although cable is oversold, the fundamental picture shows a further decline is possible. The trend remains bearish, with the next support level located at 1.2774, the low from 24 August 2017.
EUR/USD
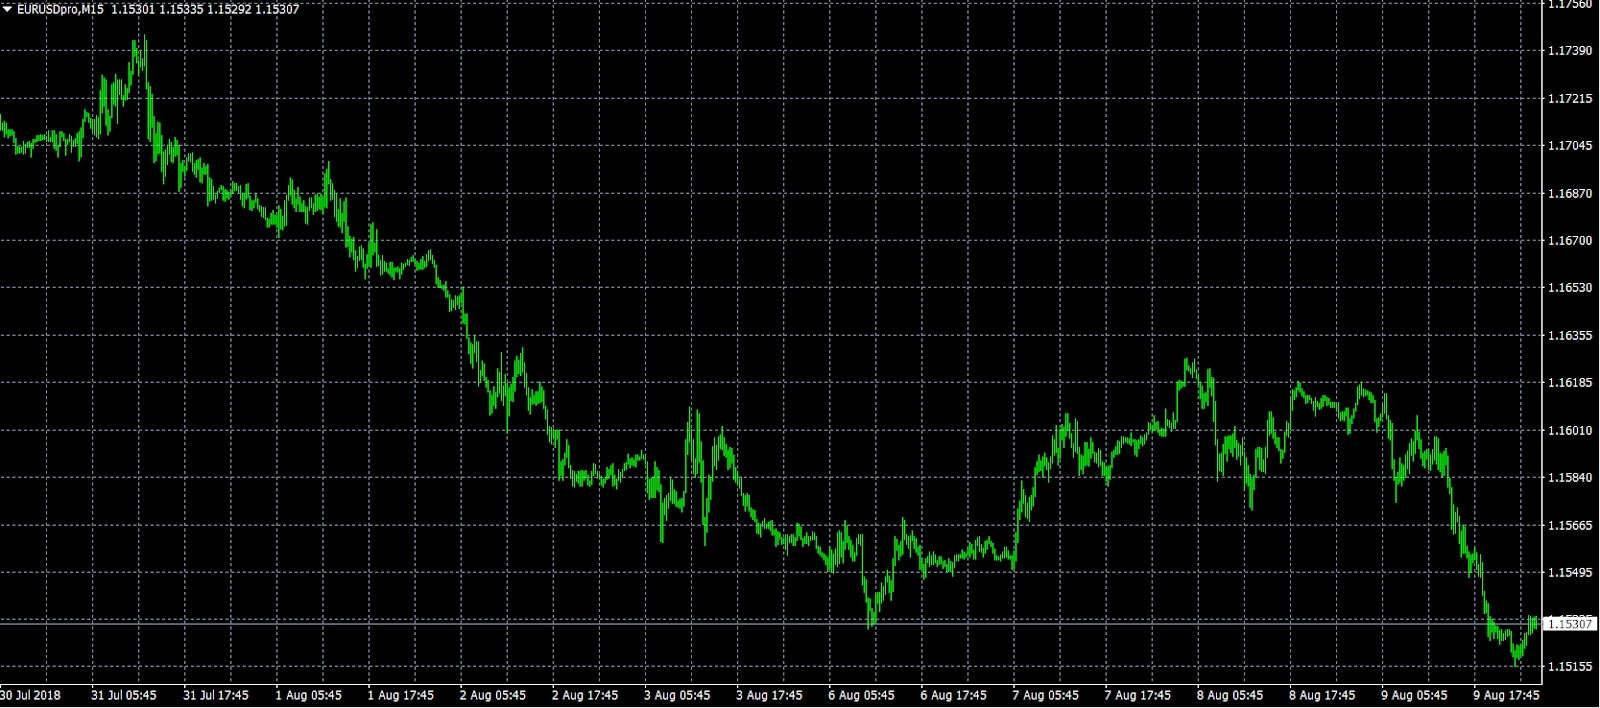
Europe's common currency swung lower on Thursday, reaching its lowest level since 30 May. The EUR/USD exchange rate now sits at 1.1531, where it is testing immediate support. On the opposite side of the spectrum, the pair is likely to face immediate resistance at 1.1580, followed by 1.1600.
USD/CAD Daily Outlook
Daily Pivots: (S1) 1.3012; (P) 1.3038; (R1) 1.3076; More...
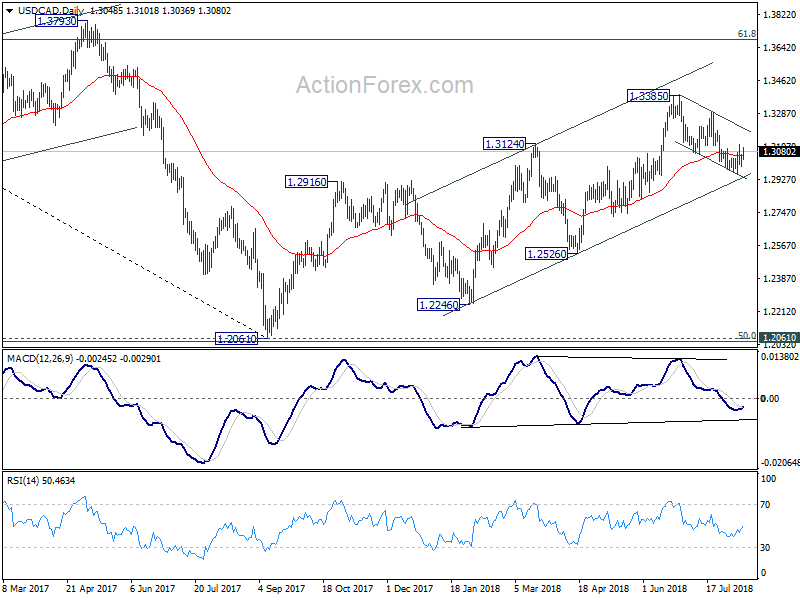
Intraday bias in USD/CAD remains neutral for the moment. At this point, we're we're holding on to the view that correction from 1.3385 could have completed with three waves down to 1.2961. Thus, another rise is expected. On the upside, above 1.3119 will target 1.3289 resistance. Decisive break there will confirm an target 1.3385 and above. In case of another fall, we'd continue to expect strong support from rising channel line (now at 1.2941) to contain downside to bring rebound.
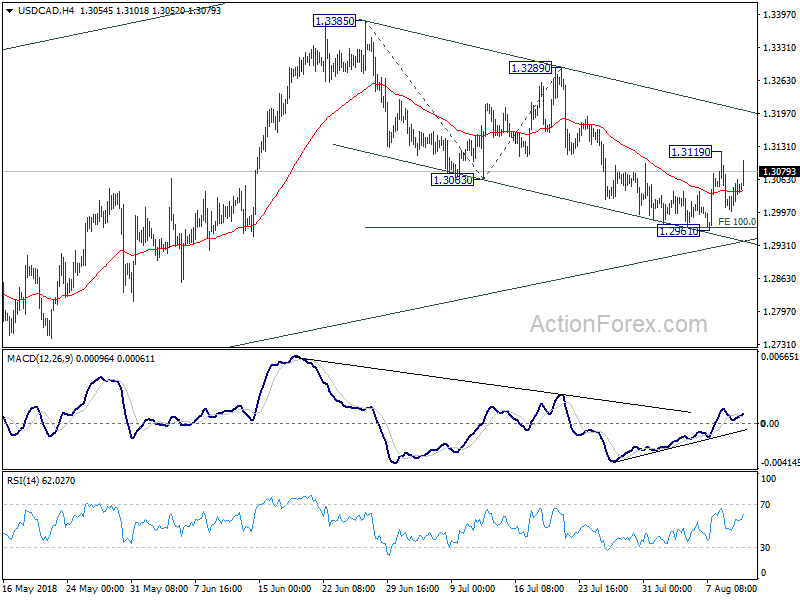
In the bigger picture, as long as channel support (now at 1.2941) holds, we're holding to the bullish view. That is, fall from 1.4689 (2015 high) has completed at 1.2061, ahead of 50% retracement of 0.9406 (2011 low) to 1.4689 (2015 high) at 1.2048. Further rally should be seen for 61.8% retracement of 1.4689 to 1.2061 at 1.3685 and above. However, sustained break of the channel support will argue that rise from 1.2061 has completed and will bring deeper fall to 1.2526 support to confirm.
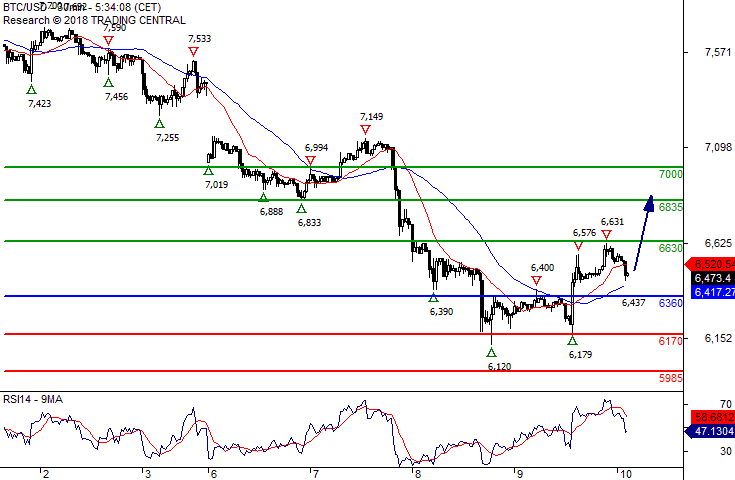
XAUUSD Intraday Technical Analysis
XAUUSD (1212.34): Gold prices have settled into a tighter rage, for the most part, this week. The sideways price action is expected to continue until a clear breakout emerges. With prices stalling near previous lows of 1204, the bias remains mixed. Gold is seen trading within the 1219 and 1211 range for the moment. Any retracement off the current lows could see a medium-term correction toward 1267 level which will mark a 38.2% retracement.