Sample Category Title
USDJPY Intraday Technical Analysis
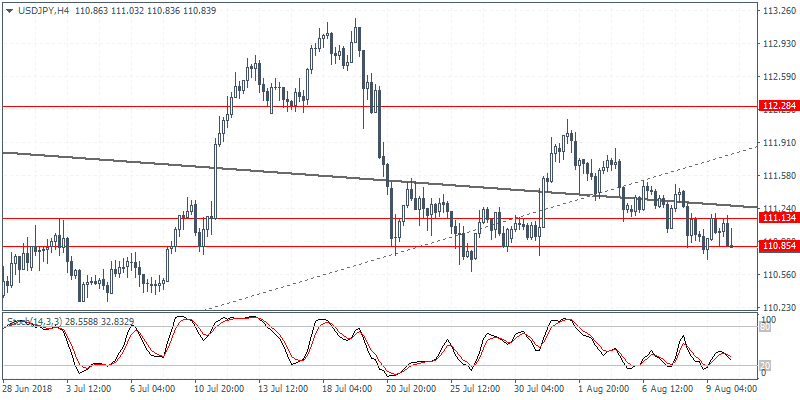
USDJPY (110.83): The U.S. Dollar continued to extend gradual declines against the Japanese Yen. However, price action remains very sluggish. On the 4-hour chart, the currency pair was seen finding comfortable support near the 111.13 - 110.85 region. Consolidation continues within this area of support as a potential upside breakout could emerge. However, in the unlikely event that the support level is broken, USDJPY could be seen extending declines at a faster pace. Price action was seen testing the 50day EMA which has managed to offer dynamic support.
EURUSD Intraday Technical Analysis
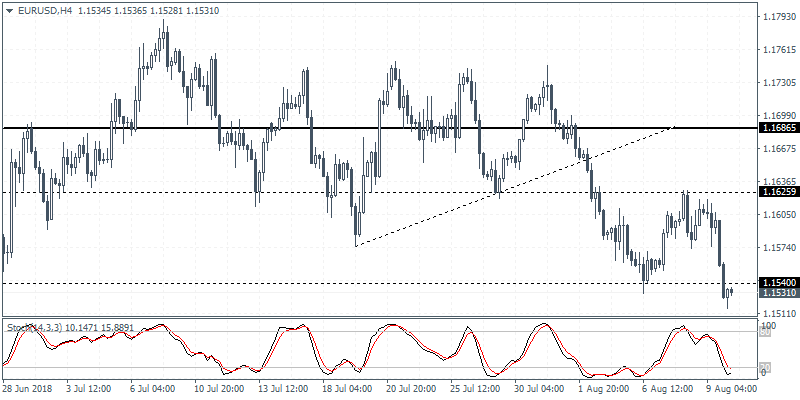
EURUSD (1.1531): The Euro currency was seen losing to the U.S. Dollar as the sideways range continues its grip. The EURUSD was seen erasing most of the gains logged from Tuesday and Wednesday. The declines coincided as price action briefly touched the short term resistance level at 1.1626. A new short-term range between 1.1626 and 1.1540 is being established. With the failure to make any progress beyond 1.1730 resistance level, the Common Currency is at risk of a potential downside breakout below 1.1540.
Canada Unemployment Rate Forecast To Fall To 5.9%
The markets were trading mixed with the U.S. Dollar managing to hold firm by market close. The markets were influenced by headline reports about China imposing a new round of tariffs of $16 billion.
Reports about the ongoing tussle between the U.S. and the sanctions imposed on Iran continued. The U.S. was also seen preparing for a fresh round of sanctions on Russia with speculation that it could also hit the crude oil market.
Economic data was clearly dominated by the broader themes in the market. The U.S. Producer Price Index for July showed a flat print for the month. Core PPI rose just 0.1% on the month, falling below estimates of a 0.2% increase.
Earlier today, Japan released its preliminary first-quarter GDP report. Data showed that Japan's economy grew 0.4% on the quarter. This brought the annual GDP growth rate to 1.9%.
Later in the day, the UK's Office for National Statistics will be releasing the preliminary GDP report for the second quarter. Economists forecast that the UK's economic output doubled, rising 0.4% on the quarter. Later, the Manufacturing and Industrial Production alongside Construction Output reports will be coming out.
A busy afternoon will see the release of Canada's employment change for the month while the U.S. will be releasing its inflation numbers for July.
USD/JPY Daily Outlook
Daily Pivots: (S1) 110.80; (P) 110.99; (R1) 111.28; More...
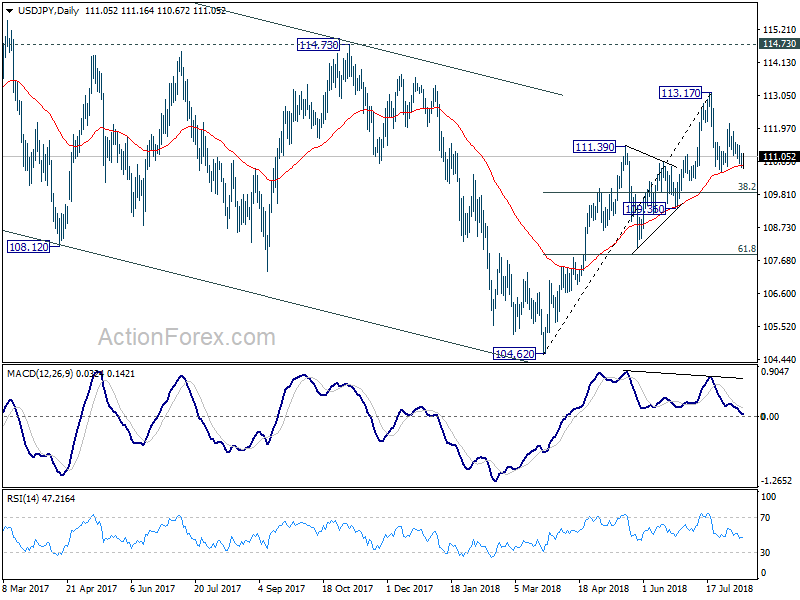
USD/JPY is staying in range of 110.58/112.14. Intraday bias remains neutral first. As noted before, the corrective fall from 113.17 is possibly not completed yet. Break of 110.58 will bring deeper decline. Nonetheless, in that case, we'd expect strong support from 38.2% retracement of 104.62 to 113.17 at 109.90 to bring rebound. On the upside, above 112.14 will target a test on 113.17 high.
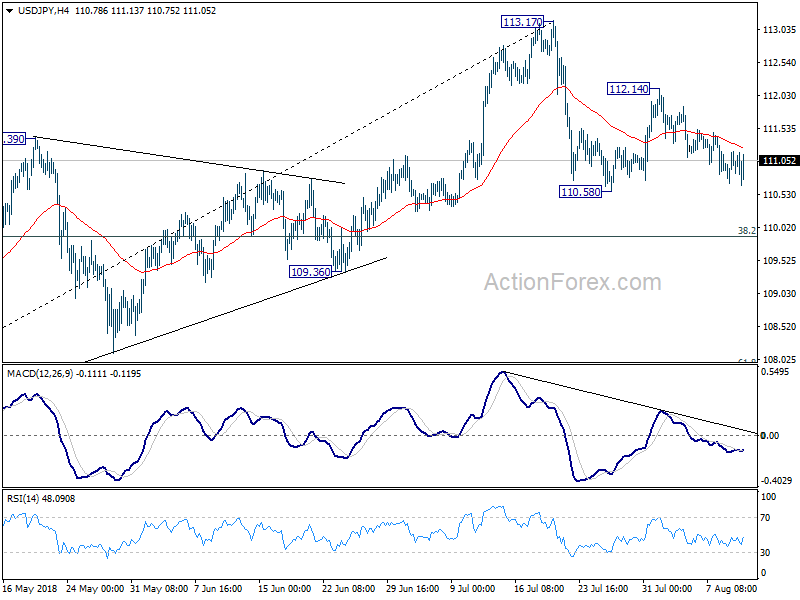
In the bigger picture, corrective fall from 118.65 (2016 high) should have completed with three waves down to 104.62. Decisive break of 114.73 resistance will likely resume whole rally from 98.97 (2016 low) to 100% projection of 98.97 to 118.65 from 104.62 at 124.30, which is reasonably close to 125.85 (2015 high). This will stay as the preferred case as long as 109.36 support holds.
USD/CHF Daily Outlook
Daily Pivots: (S1) 0.9904; (P) 0.9927; (R1) 0.9961; More...
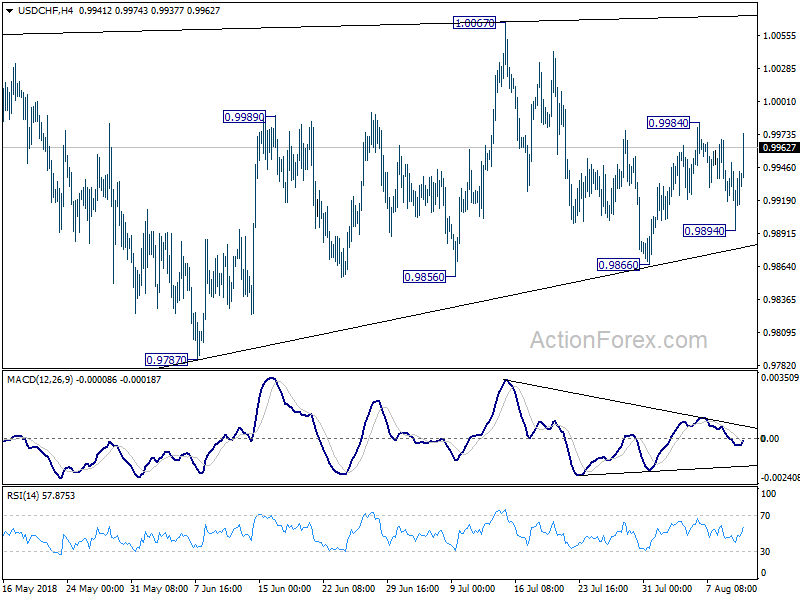
USD/CHF rebounds strongly after dipping to 0.9894. Intraday bias is turned neutral first. On the upside, above 0.9984 will resume the rebound from 0.9866 to retest 1.0067 high. Decisive break there will resume whole rally from 0.9186. On the downside, below 0.9894 might extend the consolidation pattern from 1.0056 with another decline. But downside should be contained by 38.2% retracement of 0.9186 to 1.0056 at 0.9724 to bring rebound.
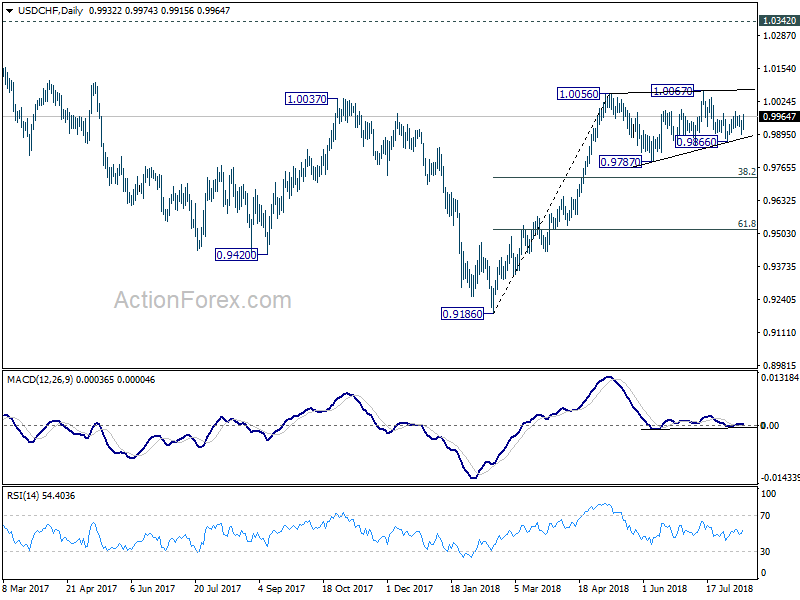
In the bigger picture, current development suggests that the consolidation pattern from 1.0056 is extending with another leg. As long as 38.2% retracement of 0.9186 to 1.0056 at 0.9724 holds, we'd expect rise from 0.9186 to resume at a later stage to retest 1.0342 key resistance (2016 high). However, sustained break of 0.9724 fibonacci level will bring deeper fall, as another declining leg in the long term range pattern.
GBP/USD Daily Outlook
Daily Pivots: (S1) 1.2793; (P) 1.2852; (R1) 1.2884; More...
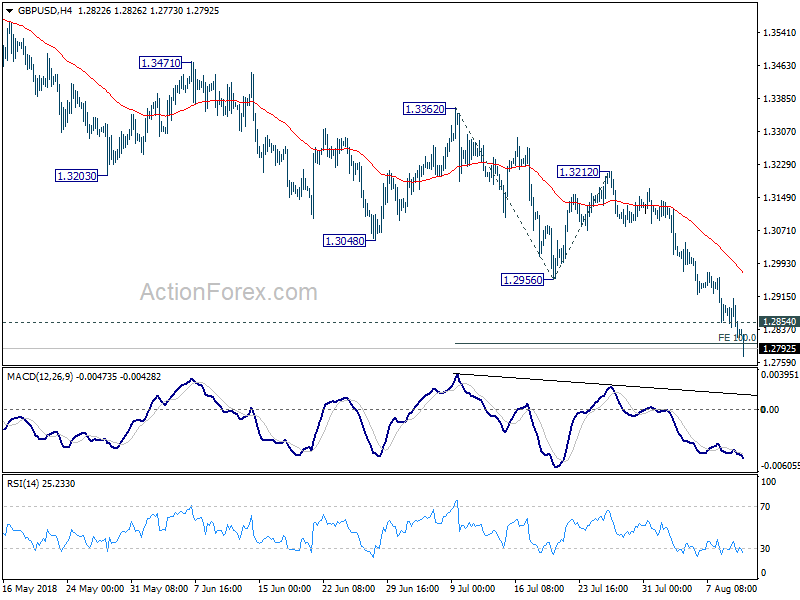
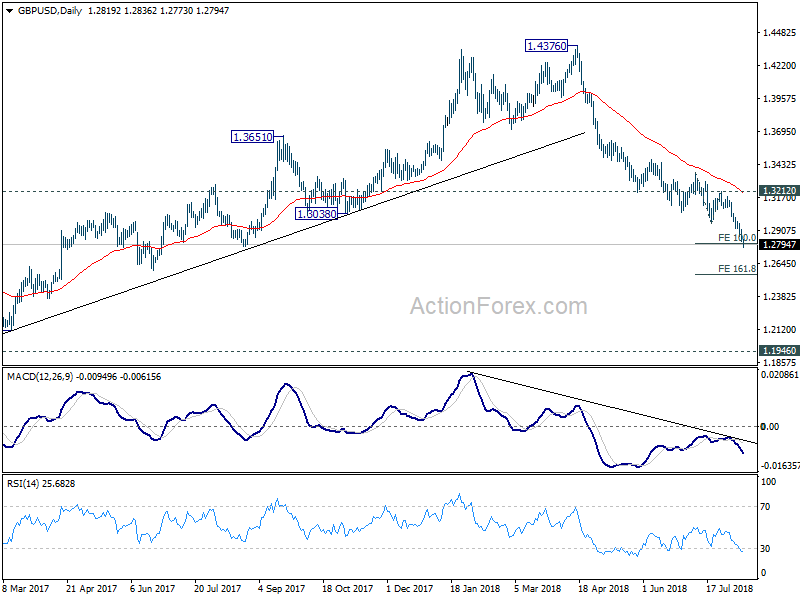
GBP/USD's decline extends to as low as 1.2773 so far. 100% projection of 1.3362 to 1.2956 from 1.3212 at 1.2806 is already met. Intraday bias stays on the downside for 161.8% projection at 1.2555 next. On the upside, above 1.2854 minor resistance will turn bias neutral and bring consolidations. But upside should be limited by 1.2956 support turned resistance to bring fall resumption.
In the bigger picture, whole medium term rebound from 1.1946 (2016 low) should have completed at 1.4376 already, after rejection from 55 month EMA (now at 1.4141). Fall from 1.4376 has met 61.8% retracement of 1.1946 (2016 low) to 1.4376 at 1.2874 already. Decisive break of 1.2874 will raise the chance of long term down trend resumption through 1.1946 low. On the upside, break of 1.3212 resistance is needed to be the first indication of medium term bottoming. Otherwise, outlook will remain bearish even in case of strong rebound.
US Dollar Stronger Amid Gains Versus The Lira
General Trend:
- Asian equity markets trade generally lower
- Shanghai Composite moves between gains and losses in early trading, Property index outperforms
- South Korean chipmakers track the earlier declines in the US chip sector
- Australian building materials firm James Hardie declined over 7%, Q1 profits below ests
- New Zealand’s Fonterra cuts its FY milk price forecast
- New Zealand bond yields continue to decline following recent RBNZ statement
- Little initial reaction seen to the RBA’s Quarterly Monetary Policy Statement
- Japan GDP rebounds in Q2
Headlines/Economic Data
Australia/New Zealand
- ASX 200 opened flat
- ASX 200 Telecom index +0.8%, Consumer Discretionary +0.4%, Financials +0.3%; Energy -1.3%, REIT -0.9%, Utilities -0.8%, Resources -0.6%
- (AU) RBA QUARTERLY STATEMENT ON MONETARY POLICY: REITERATES DOES NOT SEE STRONG CASE TO ADJUST CASH RATE IN NEAR TERM
- (AU) Australia sells A$1.0B v A$1.0B indicated in Nov 2022 bonds, avg yield 2.1839%, bid to cover 4.7x
- (NZ) New Zealand July Manufacturing PMI: 51.2 v 52.8 prior
- (NZ) New Zealand July Total Card Spending M/M: 0.5% v 0.4% prior; Retail Card Spending M/M: 0.7% v 0.5%e
- (NZ) New Zealand sells NZ$250M v NZ250M indicated in April 2029 bonds, bid to cover 3.5x
China/Hong Kong
- Shanghai Composite opened -0.1%, Hang Seng flat
- Hang Seng Energy index -1.2%, Materials -1.1%, Services -1.1%, Info Tech -1.1%, Financials -0.5%; Property/Construction +0.6%, Telecom +0.5%
- (CN) China PBoC Open Market Operation (OMO): Skips OMO (16th straight session)
- (CN) China PBoC sets yuan reference rate at 6.8395 v 6.8317 prior
- (CN) ICBC and Agricultural Bank of China said to increase the discount on first home mortgages to 10% - Chinese Press-(CN) Banks in China said to increase lending to certain government projects - Chinese Press
- Hong Kong Dollar (HKD) trades at the 7.8500 level, weakest level of currency's trading band versus the US dollar
Japan
- Nikkei 225 opened flat
- TOPIX Real Estate index -1.8%, Marine Transportation -1.3%, Electric Appliances -1%, Iron & Steel -0.9%, Info & Communications -0.9%, Retail Trade -0.5%
- (JP) Nikkei 225 Aug options said to settle at ~22,655
- (JP) JAPAN Q2 PRELIM GDP Q/Q: 0.5% V 0.3%E; ANNUALIZED Q/Q: 1.9% V 1.4%E
- (JP) Japan Jul PPI M/M: 0.5% v 0.2%e; Y/Y:3.1 % v 2.9%e (highest since Dec 2017)
- (JP) Japan Fin Min Aso: US and China trade friction may impact domestic growth
- (JP) Japan Econ Min Motegi: US and Japan trade talks to continue for 2nd day on Friday
Korea
- Kospi opened -0.4%
- (KR) South Korea Fin Min: Global trade spat, rising oil prices and Fed rate hikes are weighing on the domestic economy
Other
- (PH) Philippines Central Bank (BSP) Chief Espenilla: Reiterates CPI triggered by supply shocks; Will not close the door to further action, prepared to act again as early as next meeting
- (SG) Singapore Jun Retail Sales M/M: 1.2% v 0.1% prior; Y/Y: 2.0% v 1.2%e
North America
- US equity markets ended mixed: Dow -0.3%, S&P500 -0.1%, Nasdaq flat, Russell 2000 +0.2%
- S&P500 Energy -0.9%; Telecom +0.6%, Materials +0.5%
- (US) Weekly Fed Balance Sheet Total Assets for week ending Aug 8th: $4.30T, -$14.9B w/w, -$210.4B y/y; Reserve Bank Credit: $4.22T, -$14.8B w/w, -$210.8B y/y
- (BR) S&P affirms Brazil sovereign rating at BB-; Outlook remains Stable
Europe
- (UK) BOE's McCafferty (hawk, last month on MPC): expect wage growth near 4% in 2019 - press interview
Levels as of 01:30ET
- Nikkei 225 -0.9%, ASX 200 -0.1%, Hang Seng -0.8%; Shanghai Composite -0.3%; Kospi -1%
- Equity Futures: S&P500 -0.3%; Nasdaq100 -0.4%, Dax -0.2%; FTSE100 -0.2%
- EUR 1.1537-1.1438 ; JPY 111.19-110.67 ; AUD 0.7382-0.7324 ;NZD 0.6623-0.6587
- Aug Gold flat at $1,219/oz; Sept Crude Oil flat at $66.81/brl; Sept Copper +0.1% at $2.768/lb
USD/JPY Bearish Breakout After Pullback In Downtrend Channel
The USD/JPY bearish channel is staying within the support and resistance trend lines, which probably makes it a wave C (pink). However, price will need to break below the bottom of wave A (pink) before any bearish continuation can be confirmed. The support trend line is a key decision zone, and offers a spot to trade a bullish bounce or bearish break. A bullish bounce makes an expanded wave B likely, whereas a bearish break confirms the wave C pattern (pink).
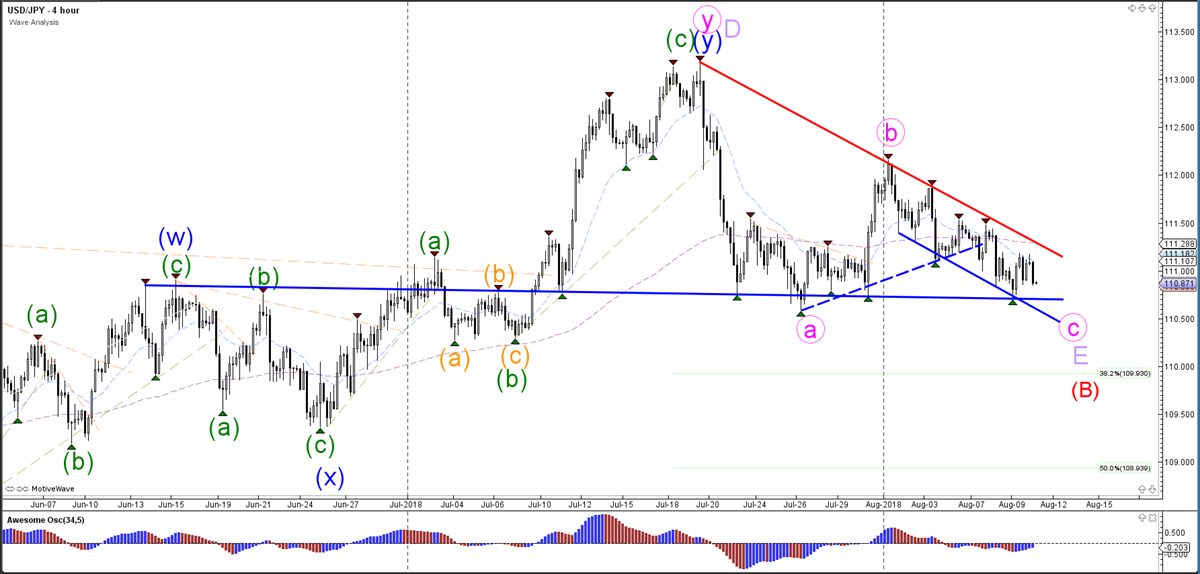
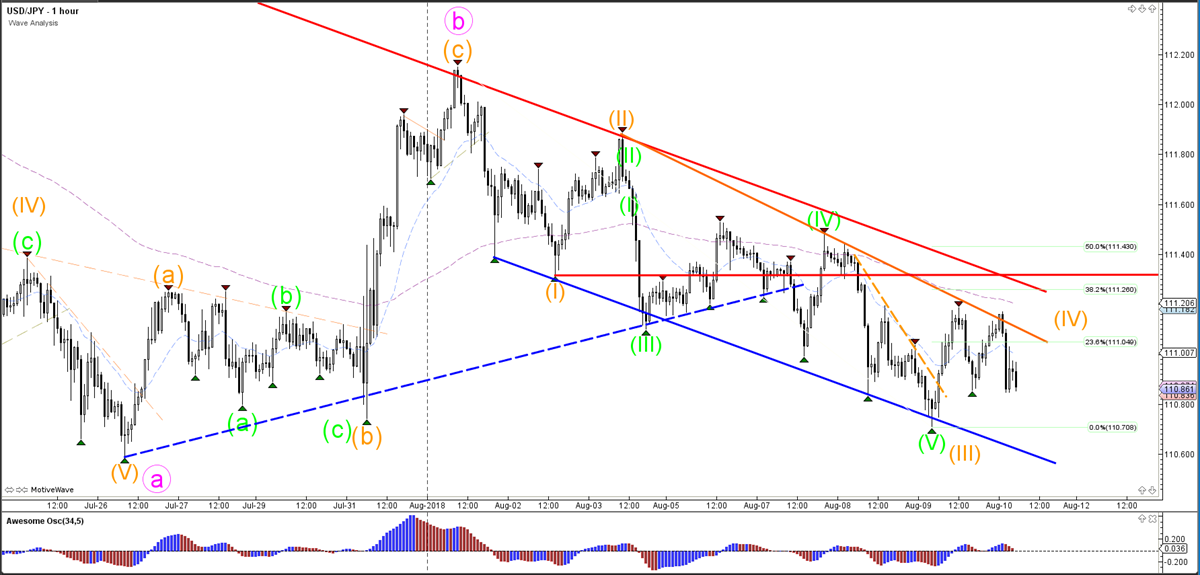
The USD/JPY is moving choppily within the downtrend channel, but price could be in a 4th wave (orange) if price manages to stay below the bottom of wave 1 (red line) and the 38.2% Fibonacci retracement level. Price has now broken below the support trend line (dotted green). A break above resistance could indicate that a bearish wave pattern is failing and could start a larger bullish correction.
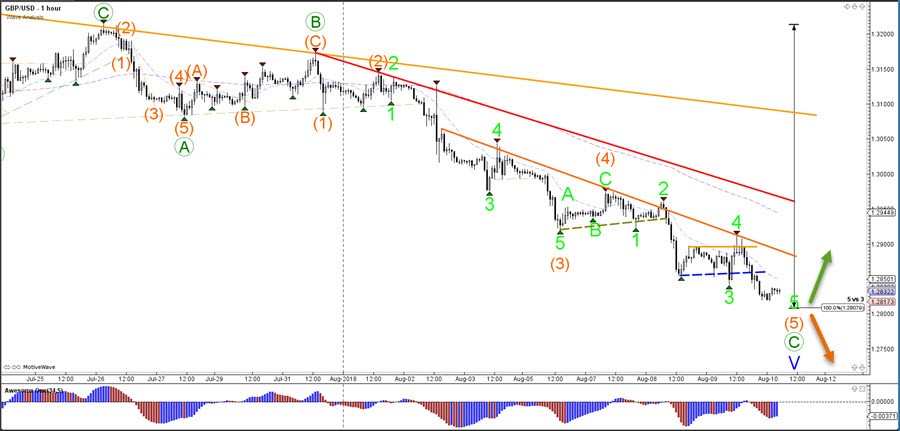
GBP/USD Confirms 3rd Wave With Break Below 1.28
The GBP/USDis approaching the 100% Fibonacci target which is a key bounce or break spot. A bearish breakout could indicate an impulsive wave 3 whereas a bounce could start a larger wave 2 correction.
The GBP/USD is currently in an ending diagonal 5th wave (blue), unless price manages to break below the 100% Fibonacci target. In that case, price is accelerating the downtrend via an impulsive wave 3 and the GBP/USD could be starting a larger downtrend. A bullish bounce could indicate the end of a wave 1 (pink).
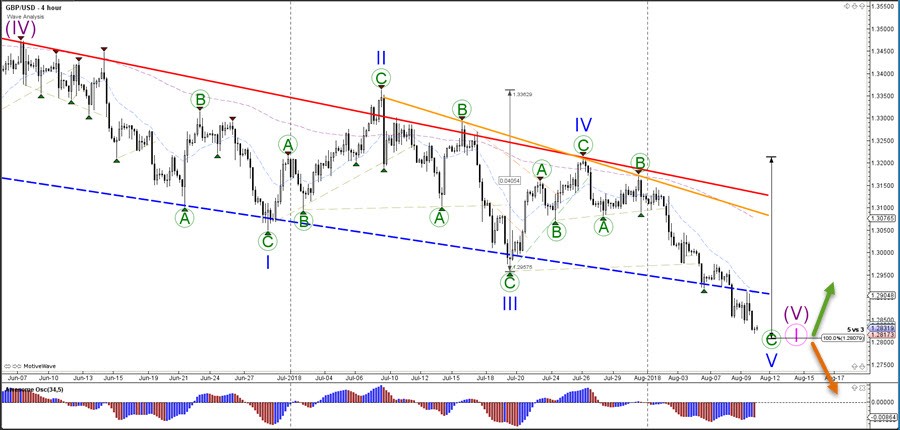
The GBP/USD broke the bear flag and is building a new low as part of potential wave 5 (green). A bearish breakout would change the wave pattern, because a wave 3 is expectedin that case.
Elliott Wave Analysis: EURJPY Nearing 3 Wave Bounce?
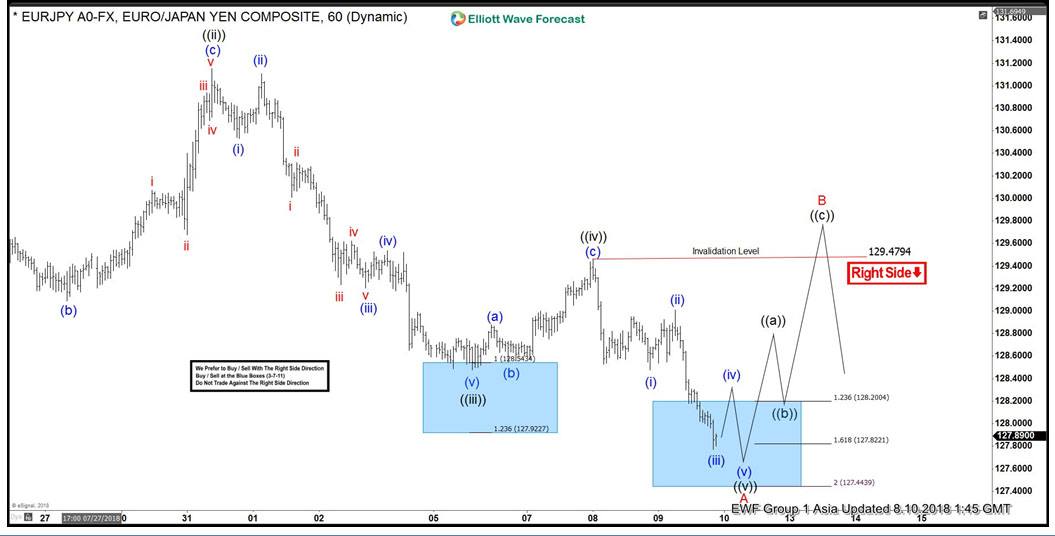
EURJPY short-term Elliott wave analysis suggests that the decline from 7/17/2018 peak (131.97) is unfolding as 5 leading diagonal structure in Minor wave A of a possible zigzag correction. The initial decline to 129.39 low ended Minute wave ((i)). Then Minute wave ((ii)) bounce ended at 131.13 as a Flat. Down from there, Minute wave ((iii)) ended at 128.49. The lesser degree cycle of Minute wave ((iii)) also unfolded in 5 waves structure where Minutte wave (i) ended at 130.54. Minutte wave (ii) ended at 131.09, Minutte wave (iii) ended at 129.19 low. Minutte wave (iv) ended at 129.52 low and Minutte wave (v) of ((iii)) ended at 128.49 low.
Up from there, the bounce to 129.47 high ended wave ((iv)) as a Flat correction. Below from there, Minute wave ((v)) is taking place at the moment in another 5 waves structure looking to extend lower 1 more time approximately towards 127.44 200% inverse extension area of Minute wave ((iv)) before ending the Minor wave A lower. In case of further downside extension area, the pair can see 127.29-126.78 100%-123.6% Fibonacci extension area of ((v))=((i)) target area as well before ending Minor wave A lower. Afterwards, the pair is expected to do a bounce in Minor wave B in 3, 7 or 11 swings before pair turns lower again. We don’t like buying the pair.
EURJPY 1 Hour Elliott Wave Chart