

Sample Category Title
An update on EUR/JPY short
Here is an update on our EUR/JPY short (sold at 128.60) position as noted in prior comment.
EUR/JPY dives through 128.49 to as low as 128.19 so far, indicating resumption of fall from 131.97. We maintain the view that corrective rebound from 124.61 has completed with three waves up to 131.97. Fall from 131.97 should target 127.13 support first. And break will confirm our view and target a test on 124.61 low next.
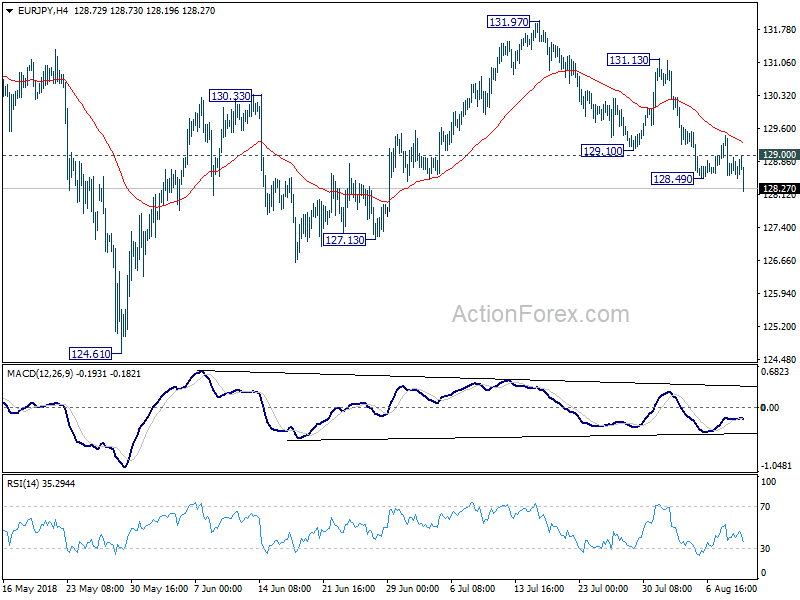
Based on this view, we'll hold EUR/JPY short, and lower the stop to 129.05, slightly above 129.00 minor resistance. While 127.13 is the first target, we're actually expecting at least a test on 124.61. And, whether the larger fall from 137.49 will extend through 124.08 key support remains to be assessed.
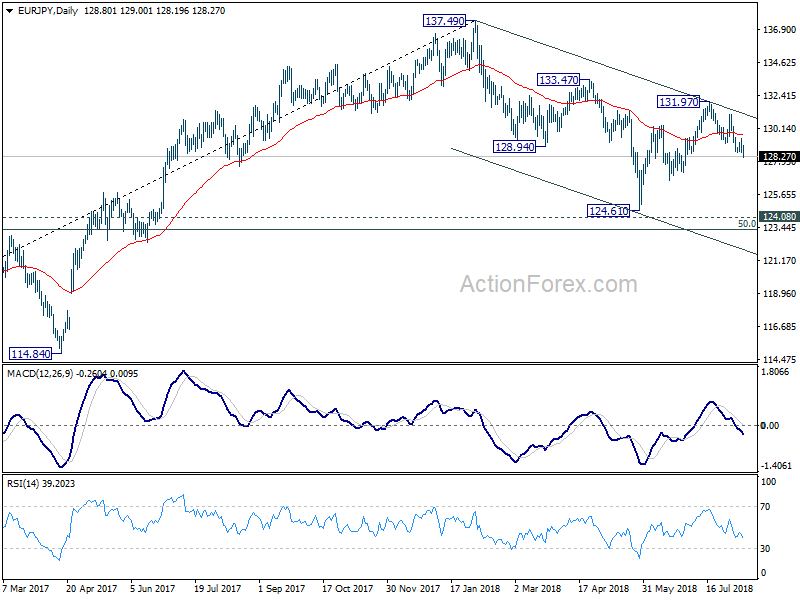
USDCHF: Weakens, Retains Downside Pressure
USDCHF: The pair looks to weaken following decline during early trading on Thursday. On the downside, support lies at the 0.9900 level. A turn below here will open the door for more weakness towards the 0.9850 level and then the 0.9800 level. On the upside, resistance resides at the 0.9950 level where a break will clear the way for more strength to occur towards the 1.0000 level. Further out, resistance comes in at the 1.0050 level. Above here if seen will turn attention to 1.0100. All in all, USDCHF faces further downside pressure.
London Gas Oil Futures Trade Near Ascending Trend Line; Outlook Still Bullish
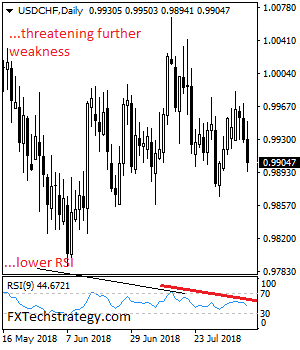
London Gas Oil futures have reversed back up again after finding support near the long-term ascending trend line. After the pullback on the 704.13 resistance level, the price came under pressure and started a downside rollercoaster. However, the weak picture in the short-term is further support by the technical indicators. But the technical indicators now support that the market could develop sideways in the short-term as the RSI holds near its neutral threshold of 50 and the MACD lies pretty close to zero and its red signal line.
In the wake of negative pressures, the market could meet support at the 23.6% Fibonacci of the upleg from 401.88 to 704.13, around 633.10. This level stands below the uptrend line and should the market cross below that level too, downside corrections could increase momentum. Next level for investors to have in mind is the 600.00 strong psychological barrier.
On the other side, an extension to the upside could retest the 20- and the 40-day simple moving averages before it meets 666.50, taken from the latest highs. However, a stronger barrier could be found at the 683.00 hurdle, where the price topped on July 10.
Having a look at the bigger picture, the price has been trading within an ascending movement since June 2017, testing the line several times in the past. Should the price continue to move along the line, bullish outlook could stay in play.
Swiss government recommends to purse business ties with Iran despite US sanctions, CHF jumps
The Swiss government announced today that they recommend business to continue to pursue ties despite US sanctions.
Fabian Maienfisch of the State Secretariat for Economic Affairs said that "U.S. decisions on sanctions do not affect the legal situation in Switzerland with regard to Iran." He added that "Switzerland regrets that the sanctions situation in relation to Iran is again deteriorating."
He added that while the government cannot dictate responses from businesses, it "recommends that companies pursue their commercial relations with Iran and inform themselves about the situation".
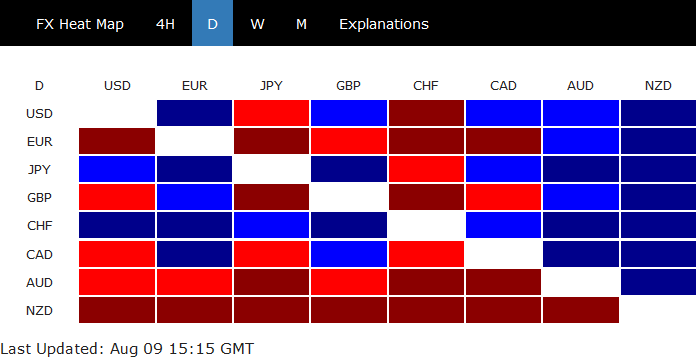
The news could be the drive behind Swiss Franc's sudden surge in early US session. CHF is now trading as the strongest one for today.
UK GDP Next on the Horizon for the Battered Pound
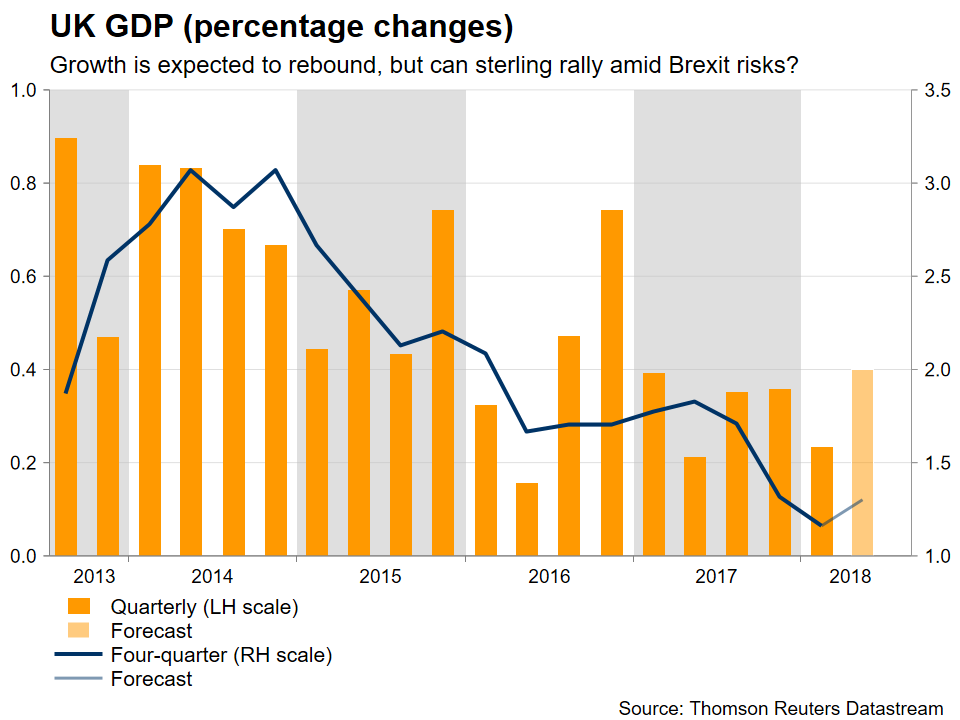
The UK preliminary GDP data for Q2 are due out on Friday, at 0830 GMT. Projections point to an acceleration in growth, which would be in line with the BoE’s latest forecasts. While a strong print could help the battered pound recover a little on the news, any sustained rally in the currency remains unlikely given the heightened uncertainty currently surrounding the Brexit negotiations.
In the quarter ending in June, UK GDP is expected to have risen by 0.4% in quarterly terms, an acceleration from a lackluster 0.2% previously. Besides the headline GDP figure, the UK will also release preliminary numbers on business investment Q2, as well as industrial production and trade balance data for June. Most attention could fall on investment, which is expected to have risen by 0.3% on a quarterly basis, after falling by 0.4% in Q1. This number is closely watched as a gauge of whether Brexit uncertainties are beginning to filter into the real economy, by keeping businesses cautious to invest.
The forecast for a 0.4% quarter-on-quarter GDP print is supported by the nation’s Markit services PMI for June, where the firm’s chief business economist noted: “the survey data indicate that the economy likely grew by 0.4% in the second quarter”. Separately, the NIESR monthly GDP tracker – a model for forecasting UK GDP – also estimates Q2 growth at the same pace.
While a strong number could confirm the UK economy remains solid and hence support the pound somewhat on the news, one remains skeptical of envisioning any sustained rally in the currency, for now. The BoE clearly signaled last week it is in no hurry to raise interest rates again. Markets understood the message and correspondingly, pushed back the anticipated timing of the next 25bps rate increase to November 2019, according to UK OIS.
Meanwhile, the EU-UK negotiations are at a very uncertain juncture. The EU implicitly rejected key parts of the UK’s latest Brexit plan recently, and speculation for a no-deal Brexit is picking up steam. While it’s true that the pound could explode higher on any signs of an agreement, we are not quite there yet, and it remains doubtful whether progress can be achieved at a pace quick enough to allow for a smooth exit by March next year. Therefore, the uncertain outlook for politics could continue to limit any potential data-driven rallies in the pound, at least until – and if – a Brexit deal is seen as being near its conclusion.
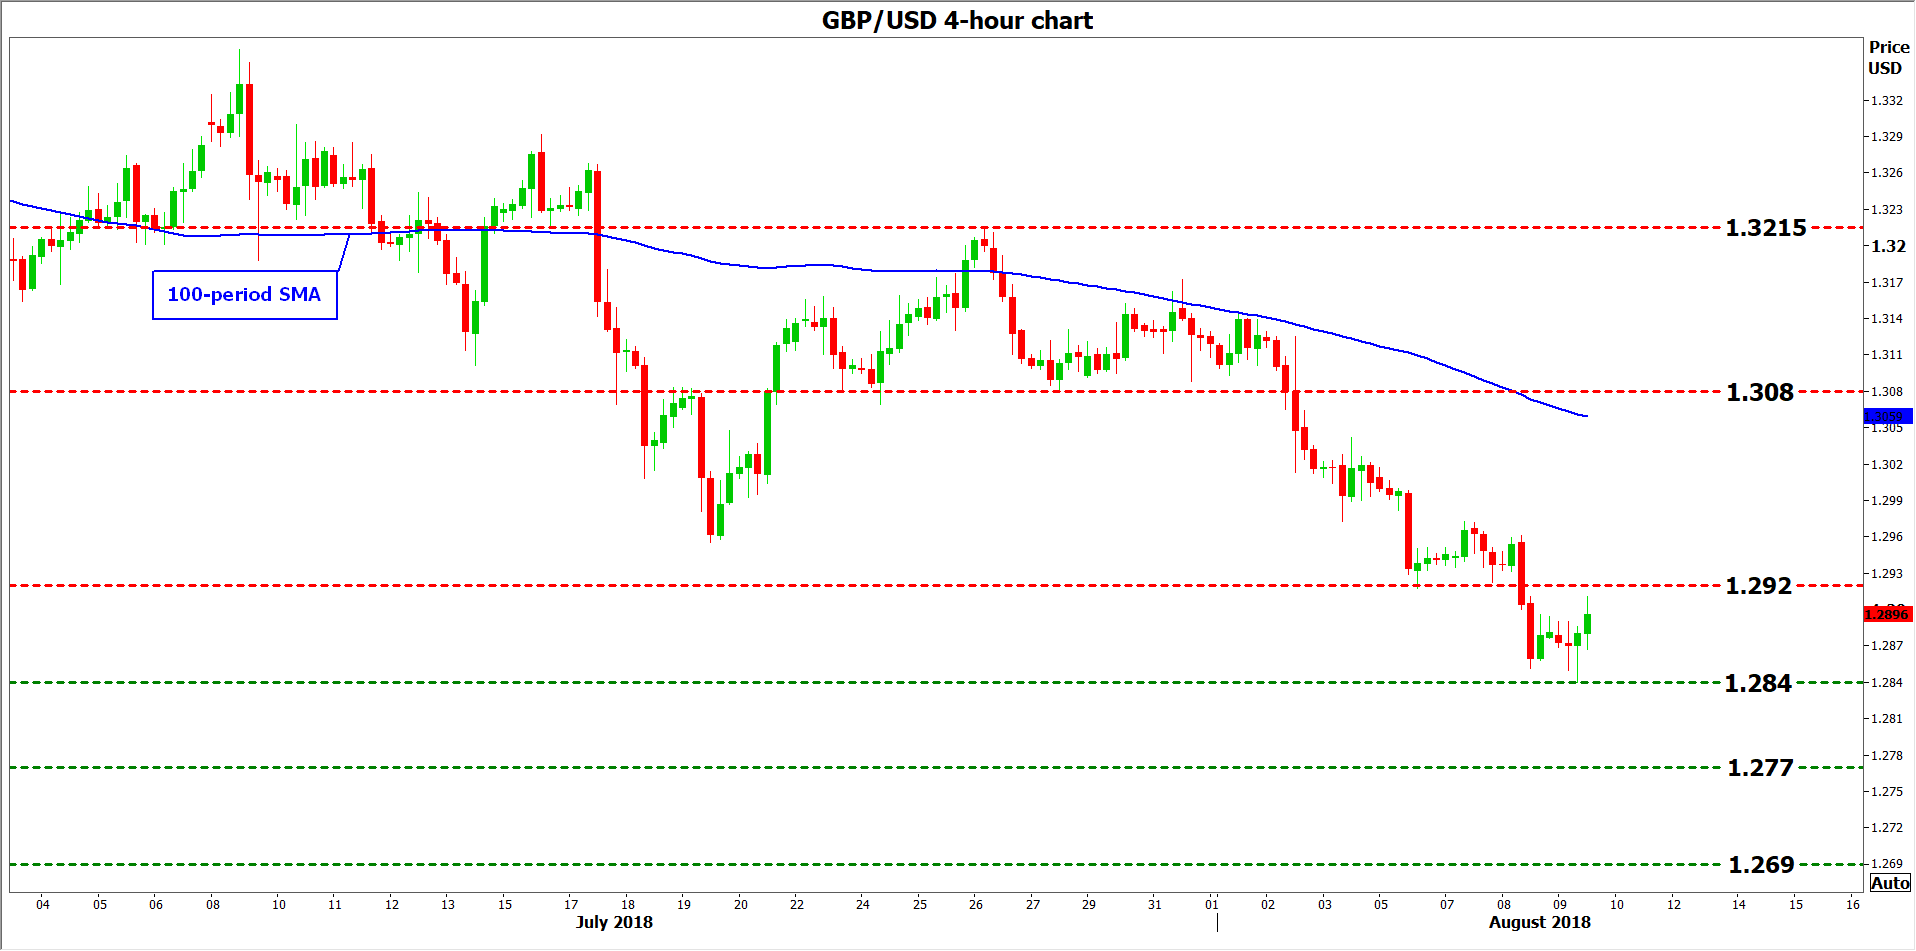
Taking a technical look at sterling/dollar, immediate support to declines may be found near the 11-month low of 1.2840, recorded on August 9. A downside break may open the way for the 1.2770 territory, defined by the lows of 24 August 2017, before the attention turns to the 1.2690 handle, marked by the inside swing low of 15 June 2017.
On the flipside, in case of advances, preliminary resistance may come around the August 6 low, at 1.2920. Even higher, the bulls could stall near the 1.3080 zone, identified by the swing low of July 27. Thereafter, the focus would increasingly turn to the 1.3215 hurdle, defined by the peaks of July 26.
An update on GBP/CHF short
An update on our GBP/CHF short position, sold at 1.2971 (prior post here). 61.8% projection of 1.3854 to 1.3049 from 1.3265 at 1.2768 first target is met. But there is no sign of bottoming yet, in spite of oversold condition. We'll stay short but lowers the stop to 1.2820 (slightly above 1.2816 minor resistance) to lock in some profits.
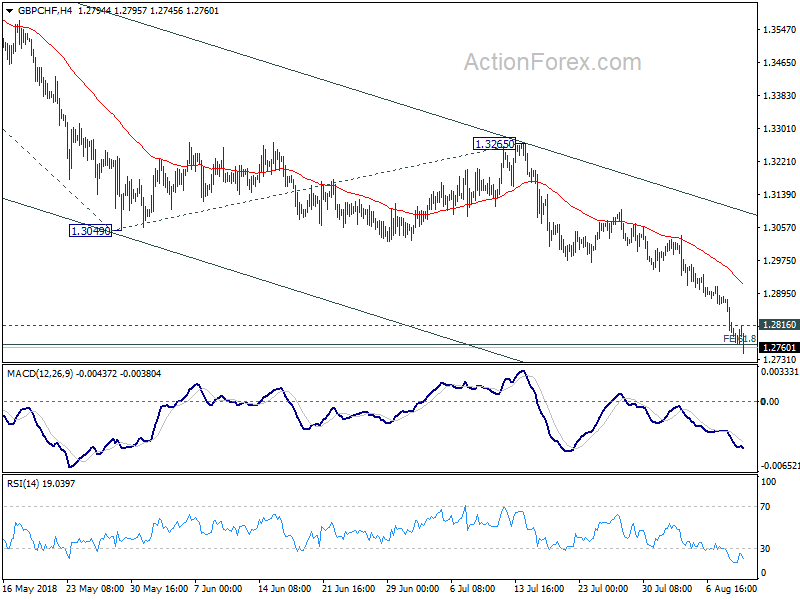
Theoretically, if the decline from 1.3854 is an impulsive move, the current 1.2768 projection level should be taken out with ease, without hesitation. That is, GBP/CHF should either power lower, or reverse from here. So, tightening the stop will give it no mercy should there be a rebound.
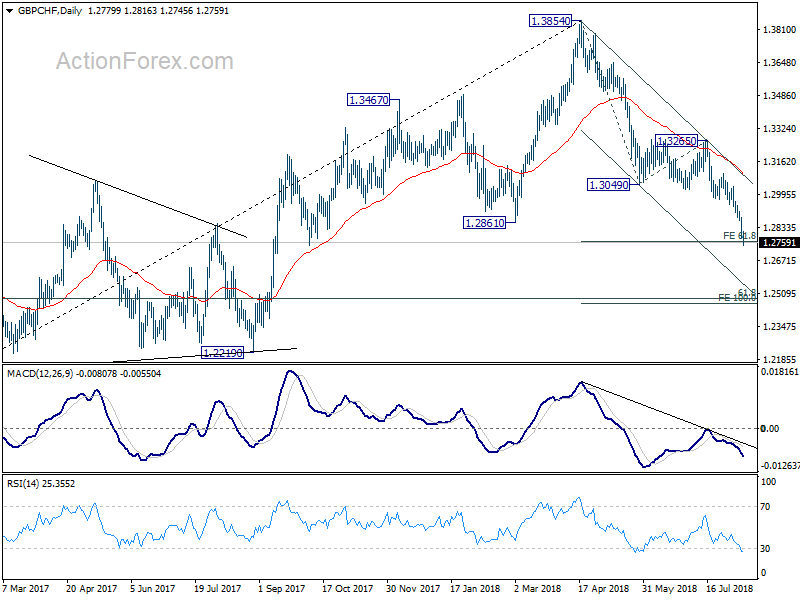
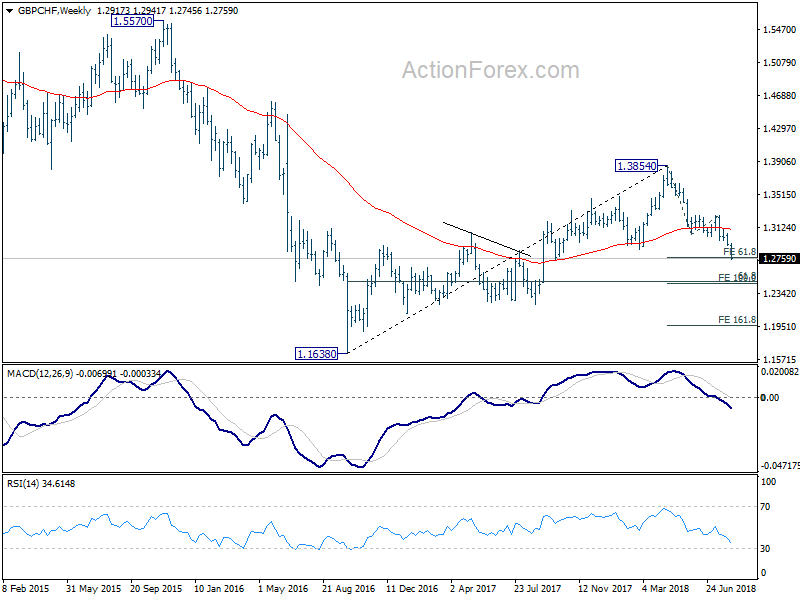
Next target is 100% projection at 1.2460. Note that this projection level is close to 61.8% retracement of 1.1638 to 1.3854 at 1.2485. Hence, we'll take all profit and exit if 1.2500 is met (slightly above 1.2460 and 1.2485).
EUR/CHF Mid-Day Outlook
Daily Pivots: (S1) 1.1519; (P) 1.1539; (R1) 1.1551; More...
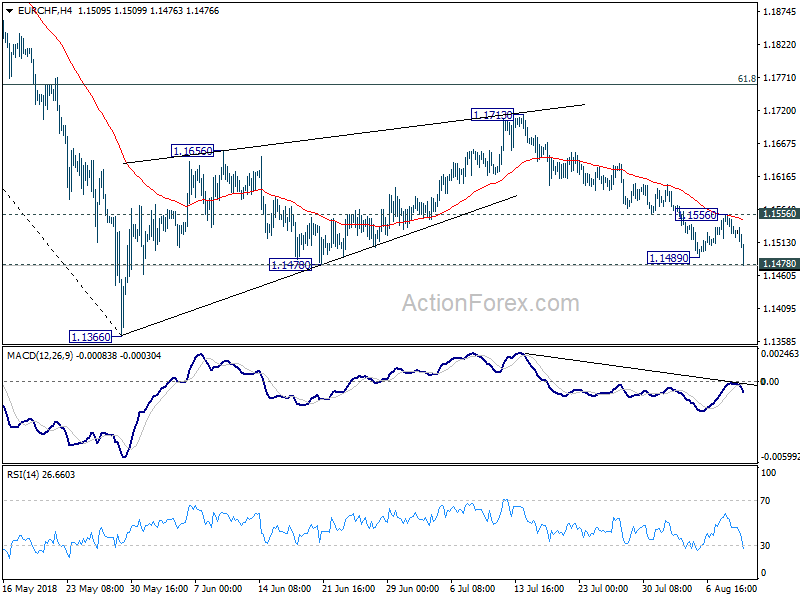
EUR/CHF's decline from 1.1713 resumes by taking out 1.1489/ after brief recovery. Intraday bias is back on the downside. Decisive break of 1.1478 support will confirm our bearish view. That is corrective rebound from 1.1366 has completed at 1.1713. And, larger fall from 1.2004 is resuming. In that case, retest of 1.1366 should be seen next. On the upside, break of 1.1556 resistance is needed to indicate short term bottoming. Otherwise, outlook will remain cautiously bearish in case of recovery.
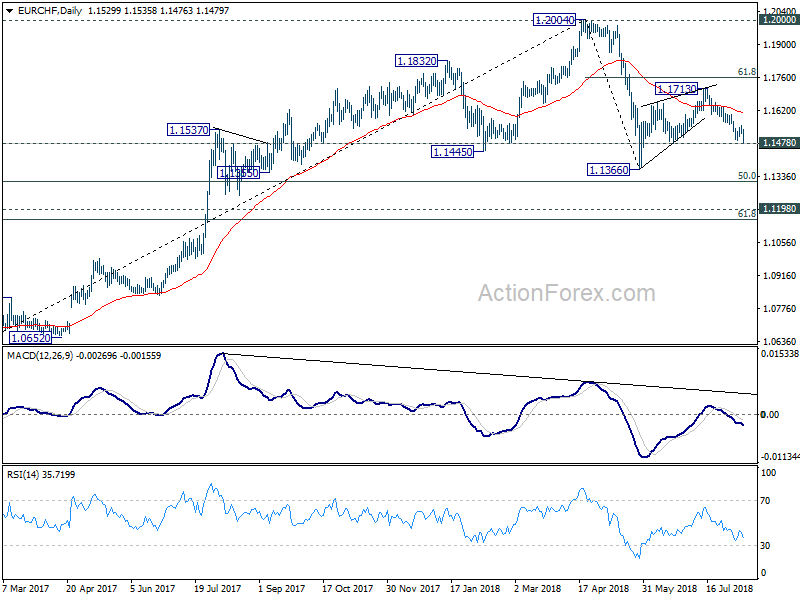
In the bigger picture, 1.2004 is seen as a medium term top with bearish divergence condition in daily and weekly MACD. 1.2000 is also an important resistance level. Hence, the corrective pattern from 1.2004 is expected to extend for a while before completion. We're not anticipating a break of 1.2004 in near term. Another decline cannot be ruled out yet. But in that case, strong support should be seen at 1.1198 (2016 high), 61.8% retracement of 1.0629 to 1.2004 at 1.1154 to contain downside.
USD/CHF Mid-Day Outlook
Daily Pivots: (S1) 0.9916; (P) 0.9943; (R1) 0.9959; More...
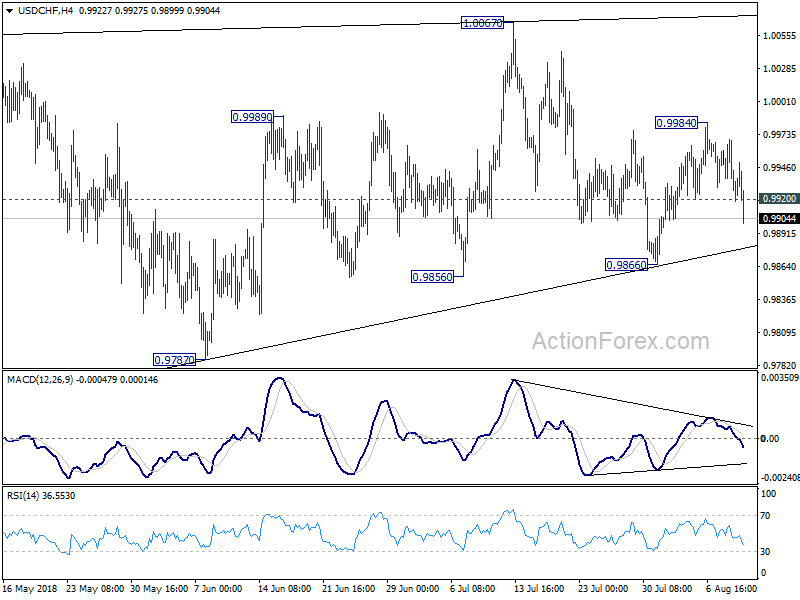
USD/CHF's sharp fall and solid break of 0.9920 support suggests that rebound from 0.9866 has completed at 0.9984. And the fall from 1.0067 is possibly resuming. Intraday bias is turned back to the downside for 0.9866 support first. Meanwhile, not that price actions from 1.0056 are seen as developing into a consolidation pattern. Hence, even in case of deep fall, downside should be contained by 38.2% retracement of 0.9186 to 1.0056 at 0.9724 to bring rebound.
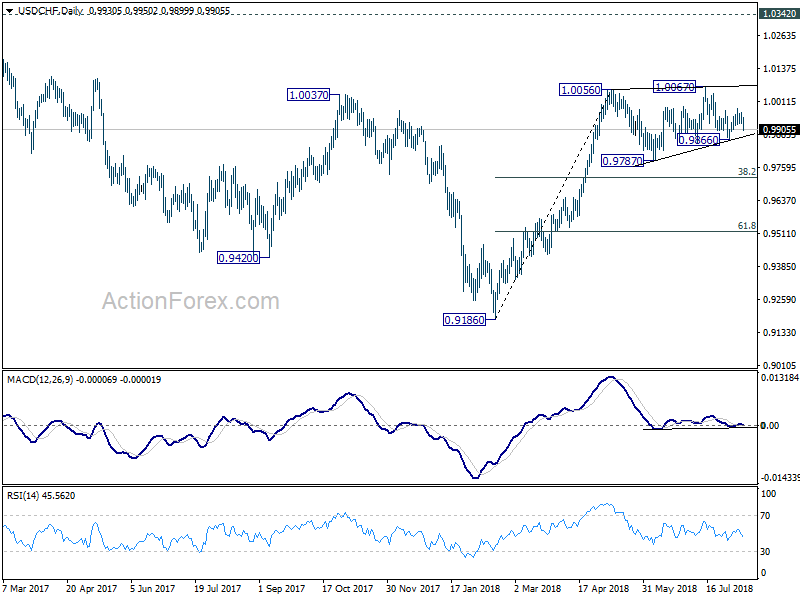
In the bigger picture, current development suggests that the consolidation pattern from 1.0056 is extending with another leg. As long as 38.2% retracement of 0.9186 to 1.0056 at 0.9724 holds, we'd expect rise from 0.9186 to resume at a later stage to retest 1.0342 key resistance (2016 high). However, sustained break of 0.9724 fibonacci level will bring deeper fall, as another declining leg in the long term range pattern.
EUR/GBP Mid-Day Outlook
Daily Pivots: (S1) 0.8972; (P) 0.8995; (R1) 0.9034; More...
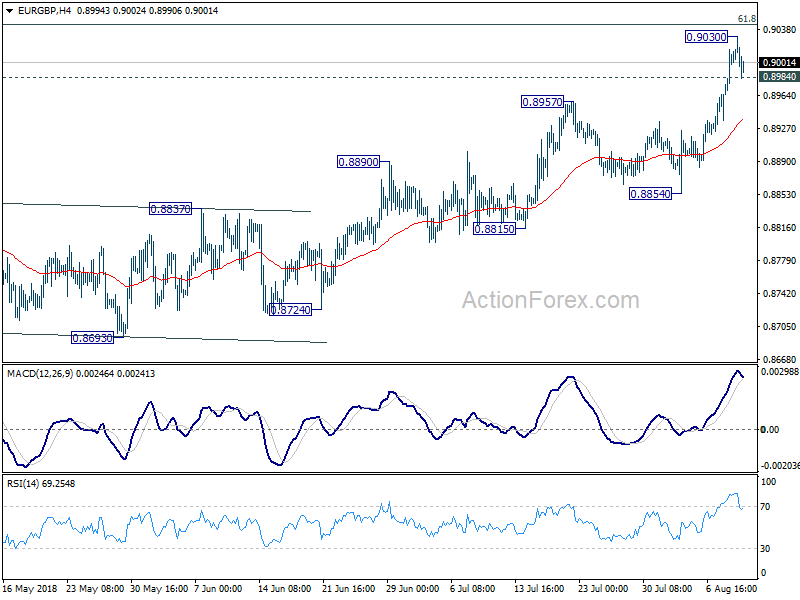
Touching of 0.8984 minor support suggests temporary topping at 0.9030. That's inch below 61.8% retracement of 0.9305 to 0.8620 at 0.9043. Intraday bias is turned neutral for some consolidations. But downside of pull back should be contained well above 0.8854 support. Rise from 0.8620 is expected to extend. And, sustained trading above 0.9043 will pave the way to retest 0.9305 high.
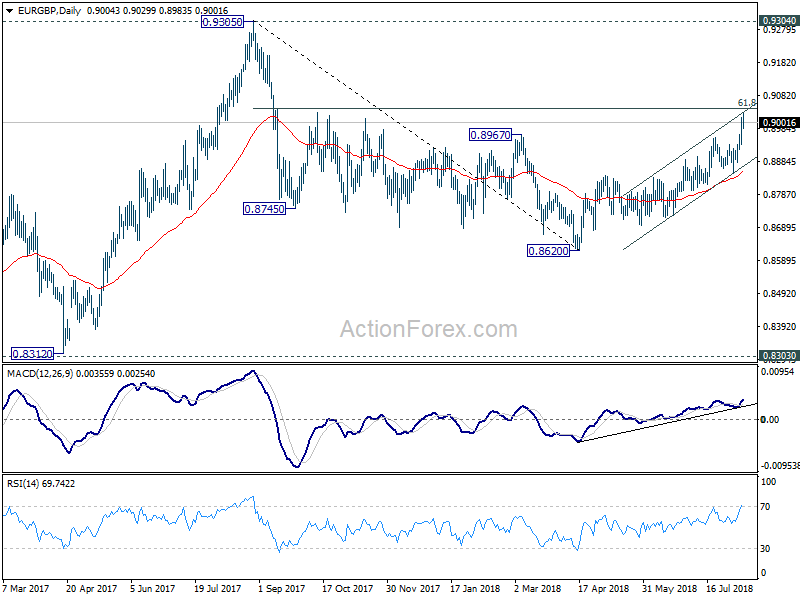
In the bigger picture, EUR/GBP is staying in long term range pattern from 0.9304 (2016 high). The corrective structure of the fall from 0.9305 to 0.8620 is raising the chance that rise from 0.8312 to 0.9305 is an impulsive move. But we're not too confident on it yet. In any case, we'd stay cautious on strong resistance from 0.9304/5 to limit upside in case of further rally. Meanwhile, if there is another medium term decline, strong support will likely be seen from 0.8303 to contain downside.
Canadian Housing Starts Fell in July But Pace of Construction Still Strong
Highlights:
- Housing starts fell to 206k annualized units in July, retracing a good portion of June’s unexpectedly strong jump to 246k.
- The 6-month trend in housing starts edged down to 220k annualized units from 222k in the previous month. That pace remains well above most estimates of underlying household formation.
- July’s pullback was concentrated in multi-unit starts, which jumped to a record high in the previous month. Single unit starts also fell, hitting their lowest level in more than three years.
- Ontario and Quebec saw the most substantial slowdown in July after sizeable gains in June.
Our Take:
Today’s pullback in homebuilding was a bit larger than expected though it would be hard to call July’s housing starts ‘weak’. Last month’s 206k annualized pace is down from 222k over the first half of the year but remains above most estimates of the underlying rate of household formation. July’s decline was concentrated in multi-unit starts but that component still came in only slightly below last year’s pace, which was a record high. Single unit starts, meanwhile, continued to trend lower and have accounted for less than 30% of urban construction year-to-date, for the first time on record. The shift toward multi-unit construction isn’t surprising given very poor affordability of single homes in some key Canadian markets. And the decline in single unit starts is in keeping with a more substantial slowdown in that segment of the resale market.
What has surprised us is the persistent strength in overall homebuilding. We continue to expect the factors that weighed on resales in 2018—rising interest rates and more stringent mortgage qualifying rules—will also put downward pressure on new construction. While starts look set to remain above 200k in the near-term, we expect a slowdown relative to the first half of the year will put some downward pressure on the residential investment component of GDP.