Sample Category Title
Forex Technical Analysis: EUR/USD, USD/JPY, GBP/USD
EUR/USD
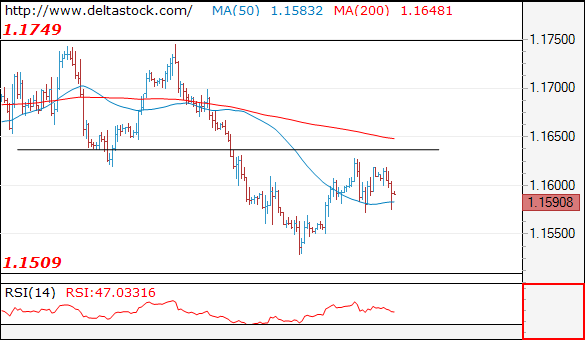
Current level - 1.1590
The pair failed to break through 1.1640 hurdle and currently the bias is neutral, within the 1.1570-1640 range. My outlook is rather bearish below 1.1640, for a slide towards 1.1509.
| Resistance | Support | ||
| intraday | intraweek | intraday | intraweek |
| 1.1640 | 1.1750 | 1.1570 | 1.1510 |
| 1.1750 | 1.1830 | 1.1510 | 1.1300 |
USD/JPY
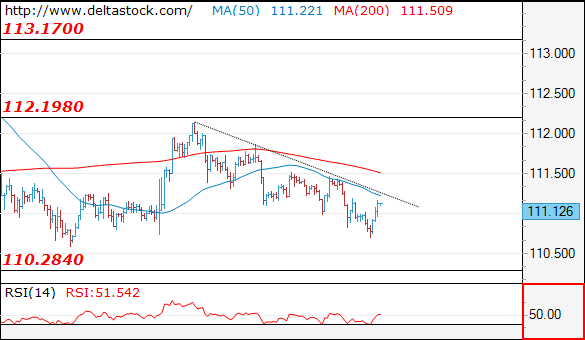
Current level - 111.12
I favor a break through 111.50 key level, towards 112.80 zone.
| Resistance | Support | ||
| intraday | intraweek | intraday | intraweek |
| 111.50 | 114.50 | 110.25 | 110.25 |
| 113.20 | 114.50 | 110.25 | 109.30 |
GBP/USD
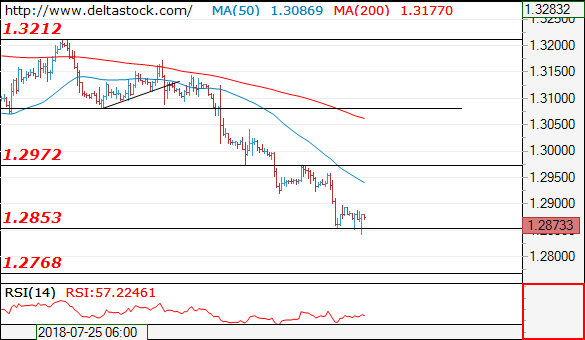
Current level - 1.2873
The general bias remains bearish, for a renewal of the downtrend towards 1.2770. Intraday there is a risk of another upswing to 1.2980 minor resistance.
| Resistance | Support | ||
| intraday | intraweek | intraday | intraweek |
| 1.2980 | 1.3210 | 1.2920 | 1.2960 |
| 1.3060 | 1.3460 | 1.2840 | 1.2770 |
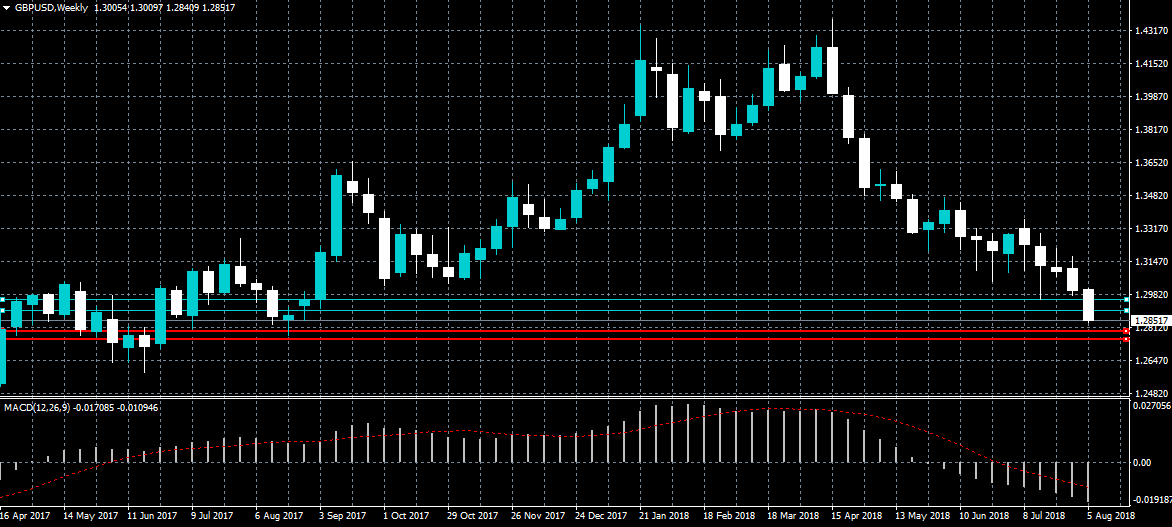
GBPUSD Technicals Still Support Selling
The British pound has fallen to a fresh yearly trading-low against the US dollar during the European session, as the recent move lower in sterling shows few signs of stopping. The GBPUSD pair looks set for a fifth-week of declines on Brexit no-deal fears, with price tumbling towards the 1.2840 level. Sellers are likely to target the 1.2810 and 1.2750 levels over the coming sessions.
The GBPUSD pair remains strongly bearish while trading below the 1.2900 level, key support is found at the 1.2810 and 1.2750 levels.
If the GBPUSD pair moves above the 1.2900 resistance level, key intraday resistance remains at the 1.2922 and 1.2955 levels.
EURUSD Sellers Back In Control Below 1.1580
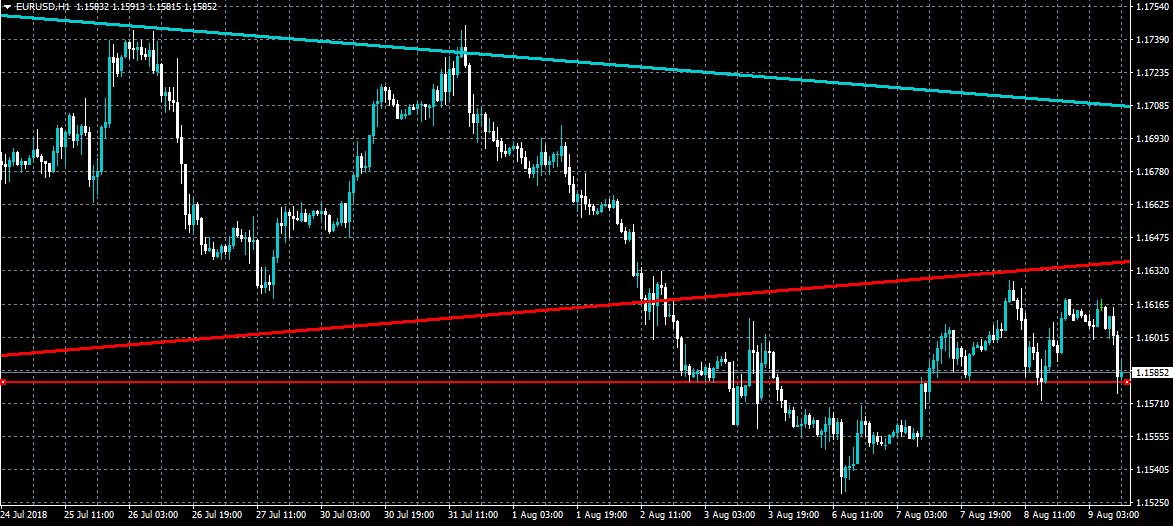
The euro has started to come back under selling pressure against the US dollar after buyers failed to hold onto the 1.1600 level. Further intraday declines in the EURUSD pair remains increasingly likely if the 1.1580 support level is breached for a sustained period. Traders will look to take direction from US inflation, as the July Producer Price Index is released.
The EURUSD pair is only intraday bearish while trading below the 1.1580 level, key support is still found at the 1.1553 and 1.1527 levels.
If the EURUSD pair moves above the 1.1600 resistance level, buyers are likely to test towards the 1.1635 and 1.1681 resistance levels.
Canadian Employment Report Eyed As Loonie Swings From High To Low
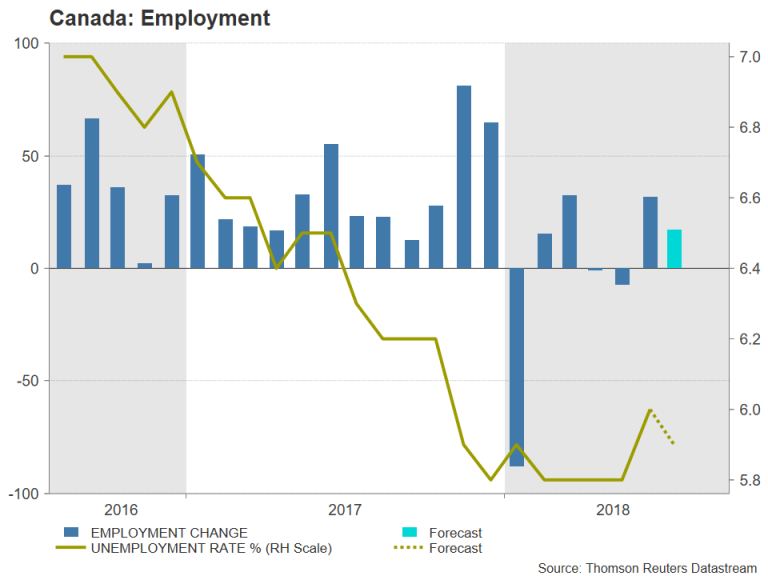
Canadian employment numbers for July due on Friday at 12:30 GMT could add to the recent run of strong data for the North American economy. Jobs growth is expected to slow but remain solid in July, as the country enjoys a bounce in economic momentum amid strained relations with the United States and Saudi Arabia, and ongoing efforts to renegotiate NAFTA. The Canadian dollar could be set for fresh highs against its US counterpart after reaching a near 2-month peak this week before reversing to a 2-week low.
Employment is forecast to grow by 17k in July after rebounding strongly in June when 31.8k jobs were created. The healthy jobs gains invited more people into the workforce, with the participation rate rising from 65.3% to 65.5%, though this pushed up the jobless rate from 5.8% to 6.0%. The unemployment rate is expected to nudge down slightly to 5.9% in July.
Other recent indicators also point to the Canadian economy going from strength to strength in the second quarter. Housing starts jumped higher in June and annual inflation ticked up to 2.5%. GDP rose by a bigger than expected 0.5% month-on-month in May, while retail sales soared by 2% over the same month. The positive trend continued this week with much better-than-expected trade figures. Canada’s trade deficit shrunk to its lowest in 17 months in June as exports surged to a record high.
The Bank of Canada is now almost certain to raise its overnight target rate by at least one more time before the year is out, having increased it twice already in 2018. And while uncertainty about the future of NAFTA remains a major downside risk to the BoC’s outlook, there is growing optimism about a successful renegotiation of the treaty. In the meantime, another robust jobs report on Friday would reinforce expectations of one more rate move, with a very strong reading perhaps even leading to some investors betting on two additional rate hikes.
The loonie, which hit a 7½-week high of C$1.2957 per US dollar on Tuesday, would likely advance further if there is a positive surprise. Dollar/loonie could seek initial support at around 1.2950, before eyeing the 1.2880 level, which is the 38.2% Fibonacci retracement of the upleg from 1.2057 to 1.3385. A breach of that level would open the way to the 50% Fibonacci level of 1.2720.
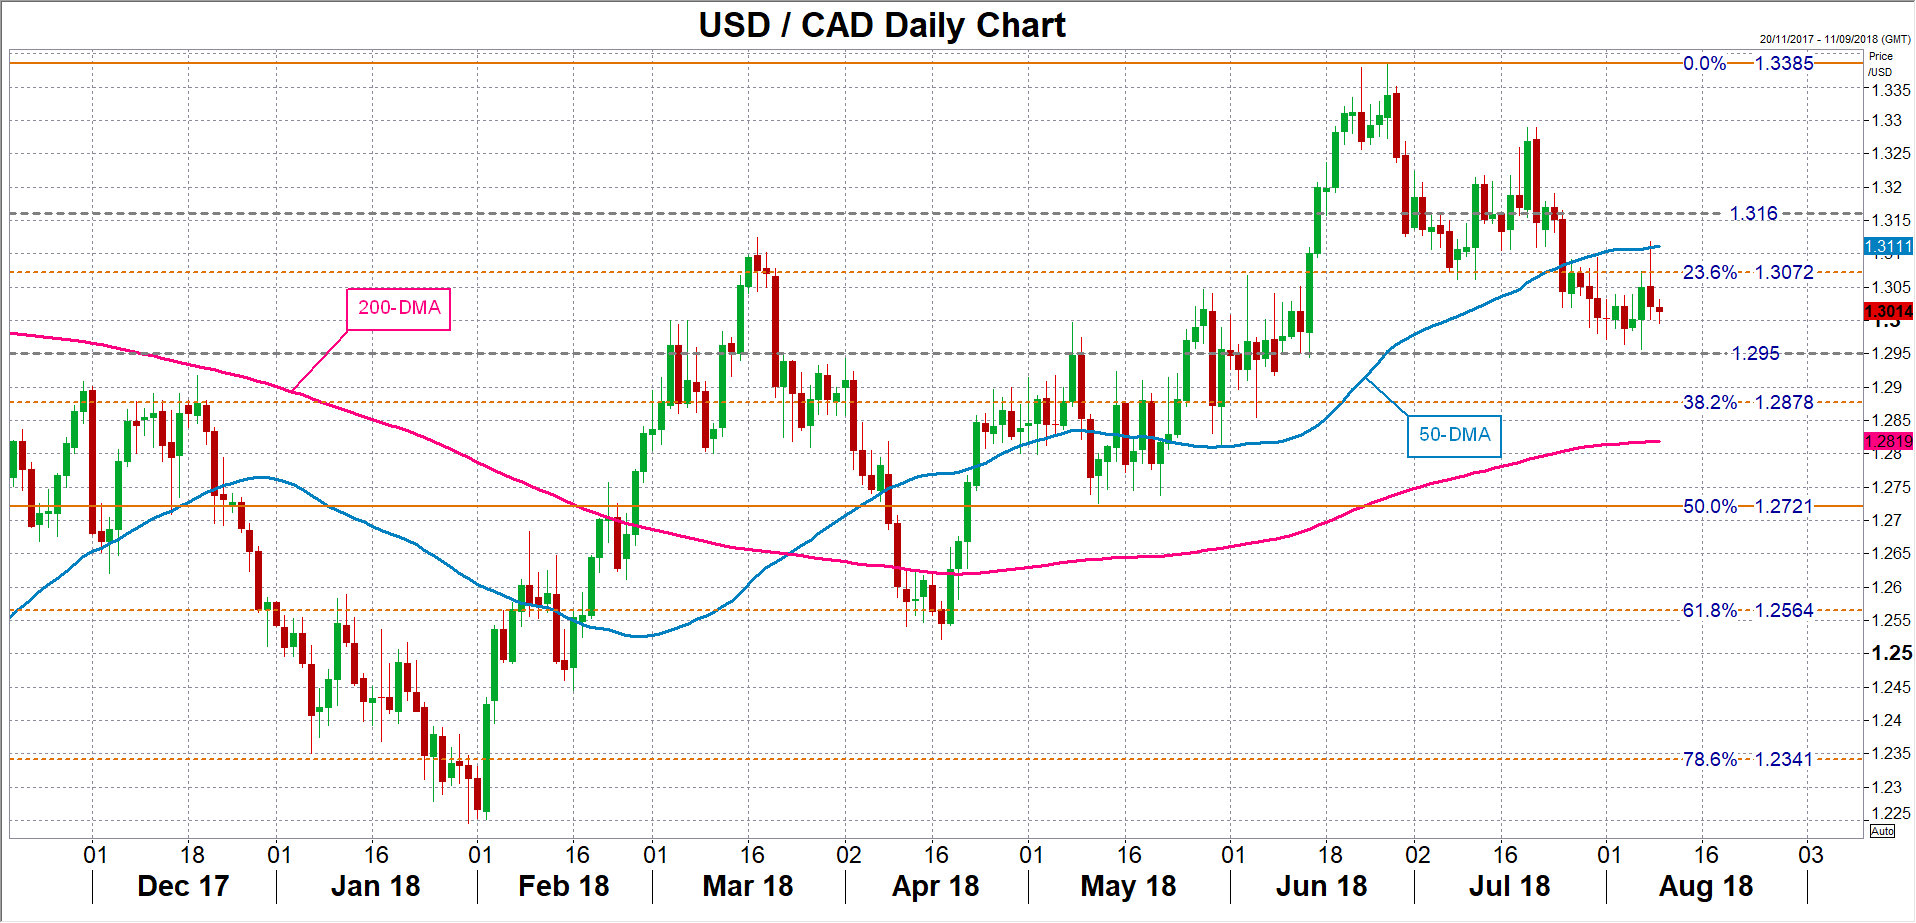
On the other hand, the loonie is vulnerable to a sharp negative correction in the event of a disappointing or an unremarkable set of employment numbers (such as the jobs created consisting mostly of part-time employment). Traders could drive dollar/loonie to test the 23.6% Fibonacci level at 1.3072, which is an immediate resistance area. Above it, Wednesday’s 2-week high of 1.3119 near the 50-day moving average is the next possible hurdle to the upside, followed by the 1.3160 mark.
Dollar Awaits US Inflation Data For Direction
The US will release its Consumer Price Index (CPI) data for July on Friday, at 1230 GMT. Forecasts point to another mild, energy-driven acceleration in consumer prices. While such prints could prove positive for the dollar on the margin, for the currency to clearly resume its uptrend, it may require an upside surprise in inflation that stokes expectations for two more Fed hikes this year.
The Fed provided few fresh signals when it kept interest rates unchanged last week, upgrading its assessment of economic growth and keeping another rate increase at the next meeting in September firmly on the table. Indeed, investors appear all but certain rates will be raised by 25bps in September, with the implied probability for such an action resting at 92.5% according to Fed funds futures. That said, they are less confident regarding moves after that, with another hike in December factored in with a 64% probability. This implies the dollar could still see some upside in case of strong data releases that enhance the prospect of a December action.
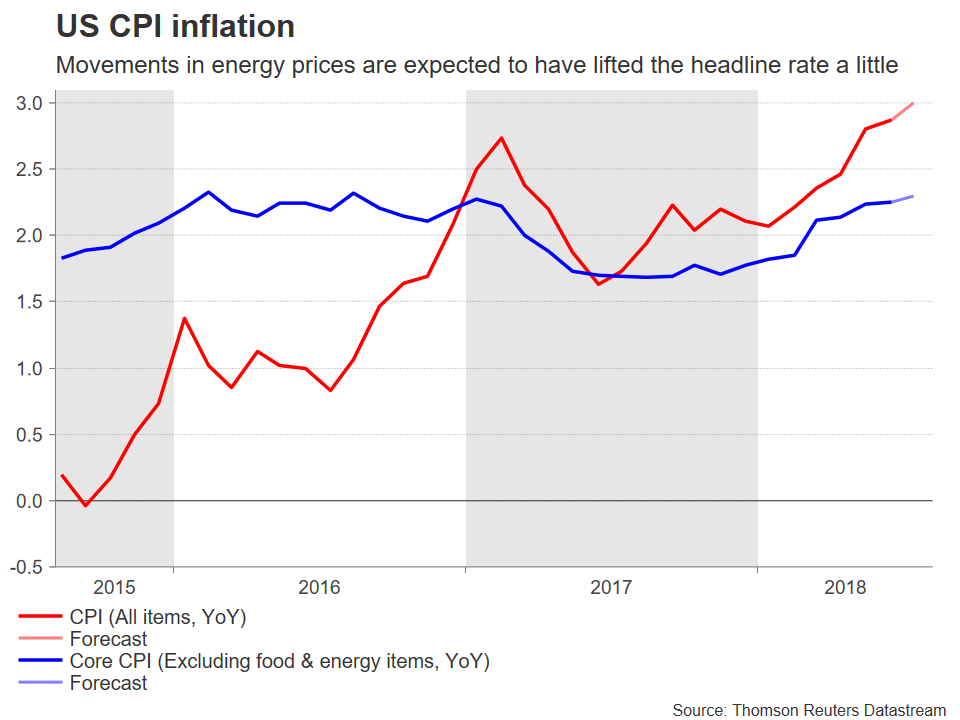
Turning to this week’s inflation data, in July, the US CPI rate is forecast to have ticked up for the sixth consecutive month to reach 3.0% in yearly terms, from 2.9% previously, and matching its highest since December 2011. The core rate – which excludes volatile food and energy items – is projected to have held steady at 2.3%, which suggests that the anticipated uptick in the headline rate may be largely owed to movements in oil prices.
The forecasts are supported by the US Markit manufacturing and services PMIs for July. The former showed manufacturers raised their selling prices at the fastest pace since 2011, while the latter showed the rate of inflation accelerating to its quickest since 2014. In isolation, these may suggest that an upside surprise in the CPI figures may be slightly more likely than a downside one. That said though, note that roughly one third of the CPI basket is the “shelter” component, which measures how fast rent prices are rising. Hence, any potential weakness in rents could keep the CPI down even in case of a notable rise in goods and services inflation. This is among the chief reasons why the Fed prefers the core PCE price index as its main inflation gauge.
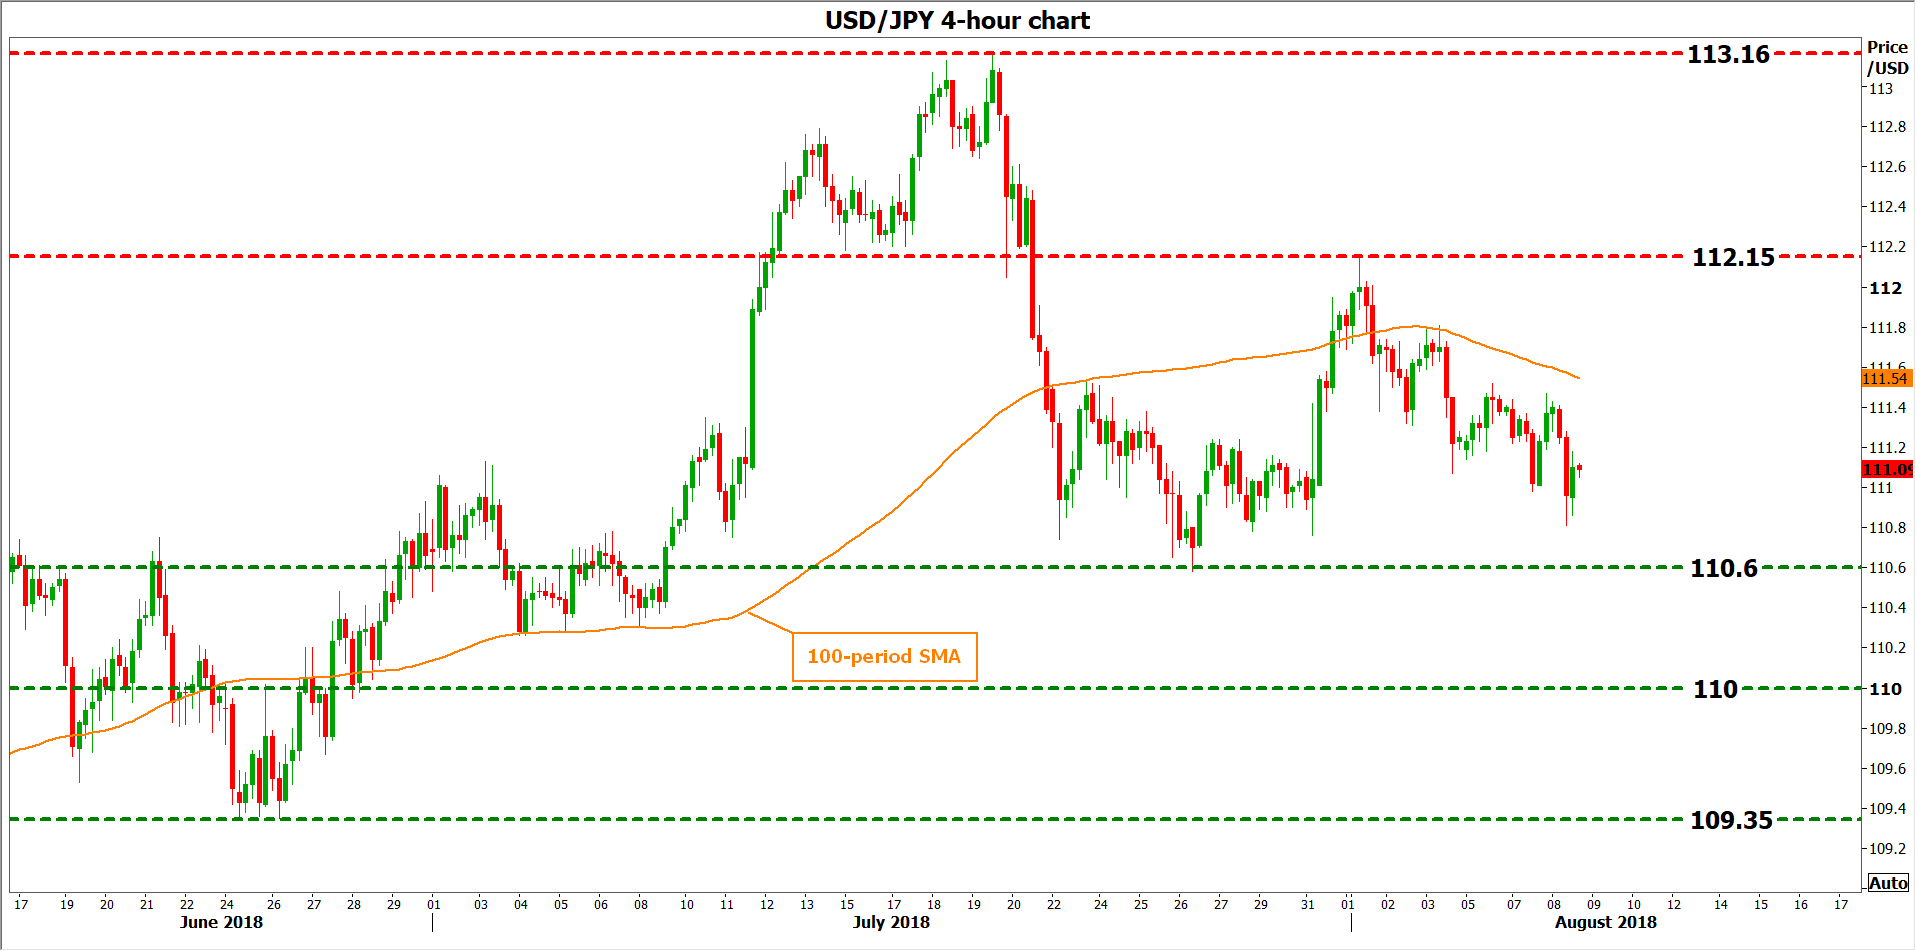
In case of stronger-than-anticipated figures, the dollar could benefit on rising speculation for a December Fed hike. Technically, looking at dollar/yen, immediate resistance to advances may be found near the pair’s 100-period moving average on the 4-hour chart, currently located at 111.54. An upside break could open the way for the 112.15 zone, defined by the August 1 peaks, before the 7-month high of 113.16 comes into view.
On the downside, in case a disappointment in these figures plays down expectations for two more rate increases this year, initial support to declines may come around the 110.60 area, marked by the July 26 low. Even lower, the round figure of 110.00 – which may hold psychological importance – may attract attention, with even steeper bearish extensions aiming for the 109.35 handle, the June 25 trough.
Japan’s Economy To Return To Growth In Q2 As BoJ Keeps Monetary Taps On
The Japanese economy will be under the spotlight on Friday as Japan's Cabinet Office publishes data on second quarter GDP growth at 8:50 local time (Thursday, 23:50 GMT). A negative first quarter had put an end to a stretch of eight consecutive quarters of expansion. However, growth is expected to rebound in the second quarter as business and consumer spending pick up.
Growth floundered in the first three months of the year as poor winter weather and a spike in food and fuel prices put a dent in household spending, while capital expenditure was also on the weak side. But consumption is expected to have recovered in the second quarter, albeit only modestly, by just 0.2% quarter-on-quarter after falling by 0.1% in the first three months of 2018. Business expenditure, meanwhile, is forecast to have accelerated from 0.3% to 0.6% q/q.
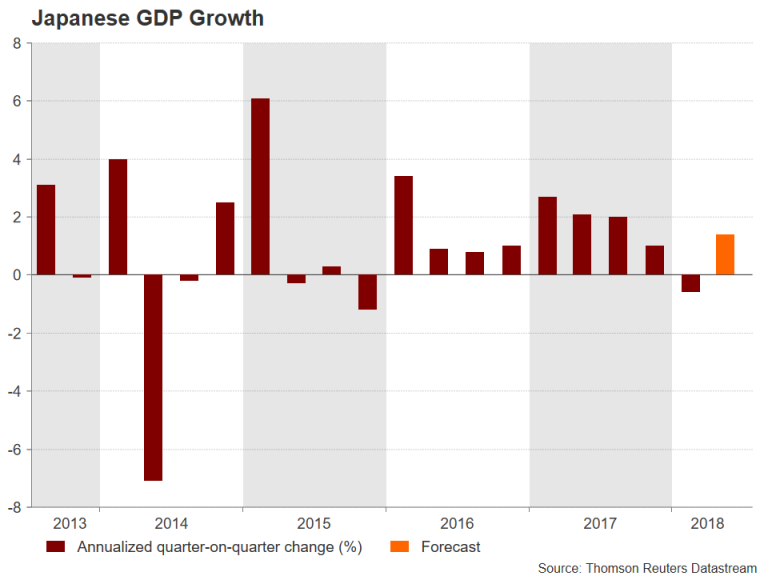
Exports, which held up reasonably well in the first quarter, likely continued to make a positive contribution to growth, with net exports projected to have added 0.1% to GDP in the second quarter, unchanged from the prior three months.
All these should translate to annualized GDP growth of 1.4% in the June quarter, more than recovering from a 0.6% contraction in the first quarter. On a quarter-on-quarter basis, growth is expected to bounce back by 0.3% after falling by 0.2% in the previous quarter.
The yen is unlikely to see a big reaction to the data as the Bank of Japan has pledged to stick to its ultra-loose monetary policy until annual inflation reaches its 2% target. With the BoJ's targeted inflation measure, the core CPI, still running below 1%, the GDP report is not anticipated to alter the outlook much for monetary policy.
However, signs of a strengthening economy in the event of an upside surprise to the GDP data would make the BoJ more comfortable in letting the yield on 10-year Japanese government bonds (JGB) rise farther above 0%. At its last policy meeting on July 30-31, the Bank announced a more flexible yield curve control policy by allowing the 10-year JGB yield to fluctuate in a wider range around its target of 0%.
The yen could appreciate versus the dollar on the back of higher JGB yields as was the case in late July when rumours swirled that the BoJ was debating scaling back its asset purchase program. Dollar/yen could dip to around 110.30 if it fails to grip onto nearby support around the 110.75 level. The next support could come around the 200-day moving average just below the 110 level, with sharper losses bringing the 109.35 region into focus.
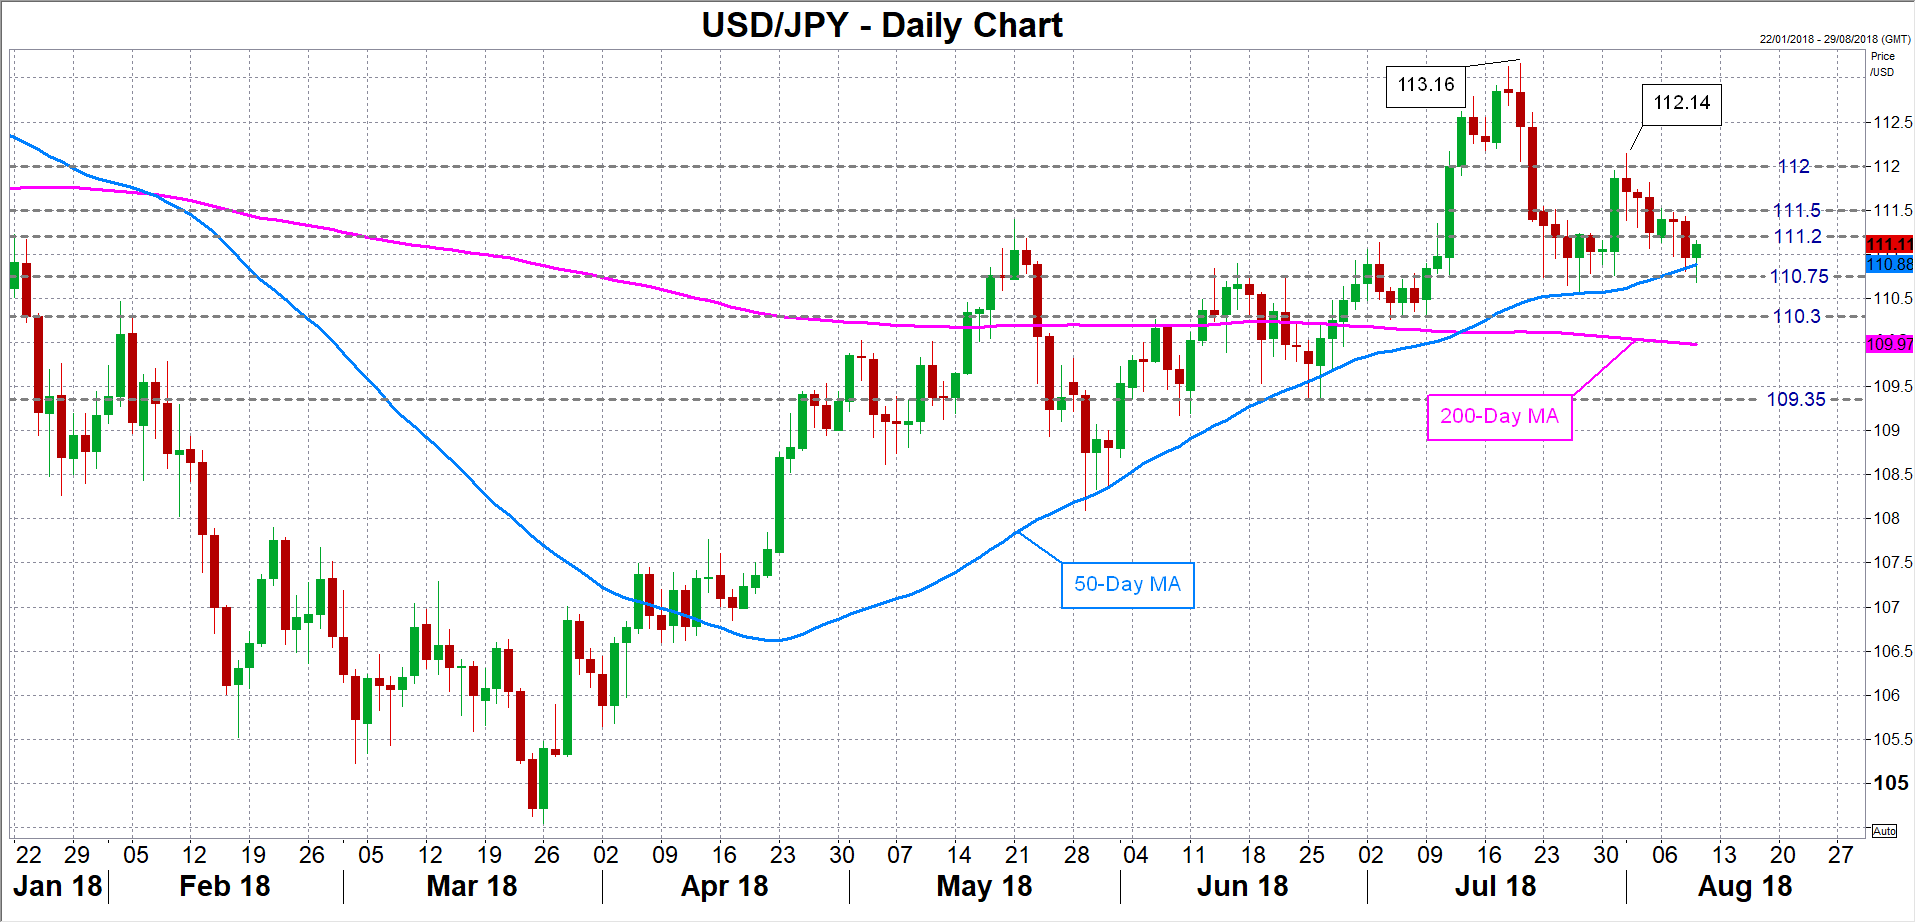
Alternatively, a weaker-than-expected GDP reading would underscore the view of a prolonged period of monetary stimulus and pressure the yen. Dollar/yen could break past immediate resistance at the 111.20 level, but there could be another hurdle not too far away at 111.50. Clearing these resistance points would bring the 112 handle within range. Reclaiming the 112 level would set the pair on track to beat its August top of 112.14. A break above this peak would put the pair in a stronger position to challenge July's six-month high of 113.16.
RBNZ Weighs On NZD, Crude Tumbles
RBNZ sends the Kiwie lower
After extending gains on hope that the RBNZ would adopt a more positive on the inflation outlook, the Kiwi fell sharply on Thursday morning and reached its lowest level in more than two years (lowest since March 2016). After climbing as high as $0.6762 yesterday, NZD/USD slid 1.33% this morning to $0.6655 after the Reserve Bank of New Zealand adopted a more dovish stance. As broadly expected the monetary institution maintained the Official Cash Rate at record low 1.75%. However, investors didn’t expect that Adrian Orr would delayed the timing for the next rate hike. The RBNZ is now expected to wait until the third quarter of 2020, which corresponds to a delay of one year compared to the May forecast. In addition, Governor Orr said that the RBNZ leaves the door open for a rate cut, should the situation warrant it.
The RBNZ’s dovish turn wasn’t expected by most market participants, which explains why the Kiwi is having a rough day. Nevertheless, Governor Orr also said that the RBNZ was finally “pleased” with current level of the Kiwi, which suggests that the downside is limited. In the medium-term, we do not rule out further weakness of the Kiwi towards the 0.66-0.65 support area. However, we remain positive in the longer-term as we believe the Kiwi is approaching oversold territory.
Crude oil sharp decline resumes as investors focus on Chinese tariffs
API estimates and lower inventories from EIA (-1.35 million barrels vs consensus: 2.16 million) for the week ending in 3. August along with US sanctions on exporting goods (ex oil products) failed to impress the market in a sustained way, with Brent Crude and West Texas Intermediate intraday prices reaching 74.65 and 69.17 before plummeting below 100 DMA.
Indeed, the focus is now turning to Chinese 25% duties on $ 16 billion energy products including gasoline, diesel and other oil-based products, a first move of the kind with regard to the energy sector. The decision will be effective in 23. August 2018.
Accounting for 20% of total US oil exports (17.6 million barrels in May), China currently remains the largest importer of US crude oil, a trend that could drastically change in the coming periods as China’s large energy companies are ramping up production in an attempt to satisfy domestic demand at best.
Accordingly, the recent decline in oil prices seems overstated. The short-term bearish impact is expected to dissipate, as global energy demand remains robust. Trading below 50 and 100 DMAs, WTI is expected to rebound in the short-term, approaching the 68.50 range (along 23.6% Fibonacci retracement).
Elliott Wave Analysis: Bears On GBPJPY Pushing Lower
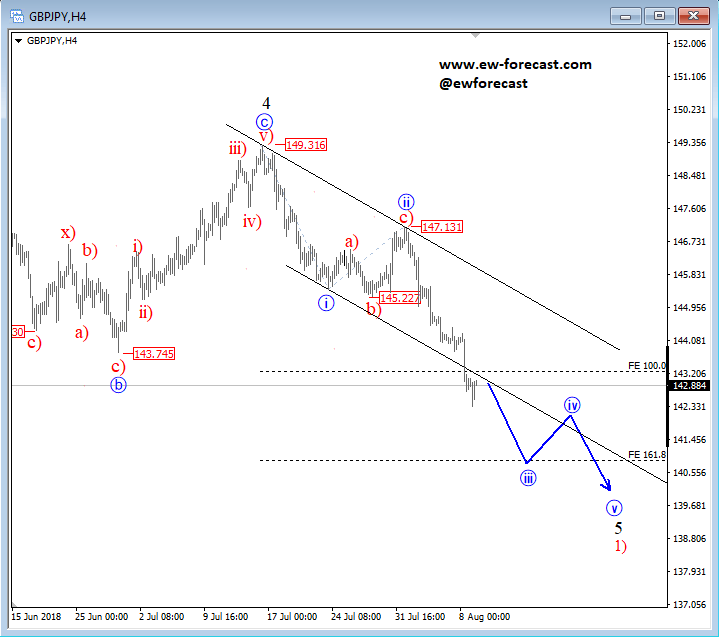
GBPJPY has been trading choppy and overlapping in a higher degree wave 4 in June and found a top In July, at the 149.32 to be specific. We can see that price dropped nicely from the highs, which gave us thinking maybe a new drop in five-waves can be in play for the pair and current firm and strong weakness from 147.13 level can be wave iii which can take price towards the Fibonacci projection zone of 161.8. At the mentioned zone a new temporary correction as wave iv may follow.
GBPJPY, 4h
The Analytical Overview Of The Main Currency Pairs
The EUR/USD currency pair
Technical indicators of the currency pair:
Prev Open: 1.15980
Open: 1.16098
% chg. over the last day: +0.09
Day's range: 1.15934 – 1.16046
52 wk range: 1.0571 – 1.2557
Yesterday, there was a variety of trends on the EUR/USD currency pair. At the moment, the technical pattern is ambiguous. Investors expect additional drivers. The key support and resistance levels are 1.15800 and 1.16150, respectively. We recommend opening positions from these marks.
The news feed on 2018.08.09:
The number of initial jobless claims in the US at 15:30 (GMT+3:00);
Producer price index in the US at 15:30 (GMT+3:00).
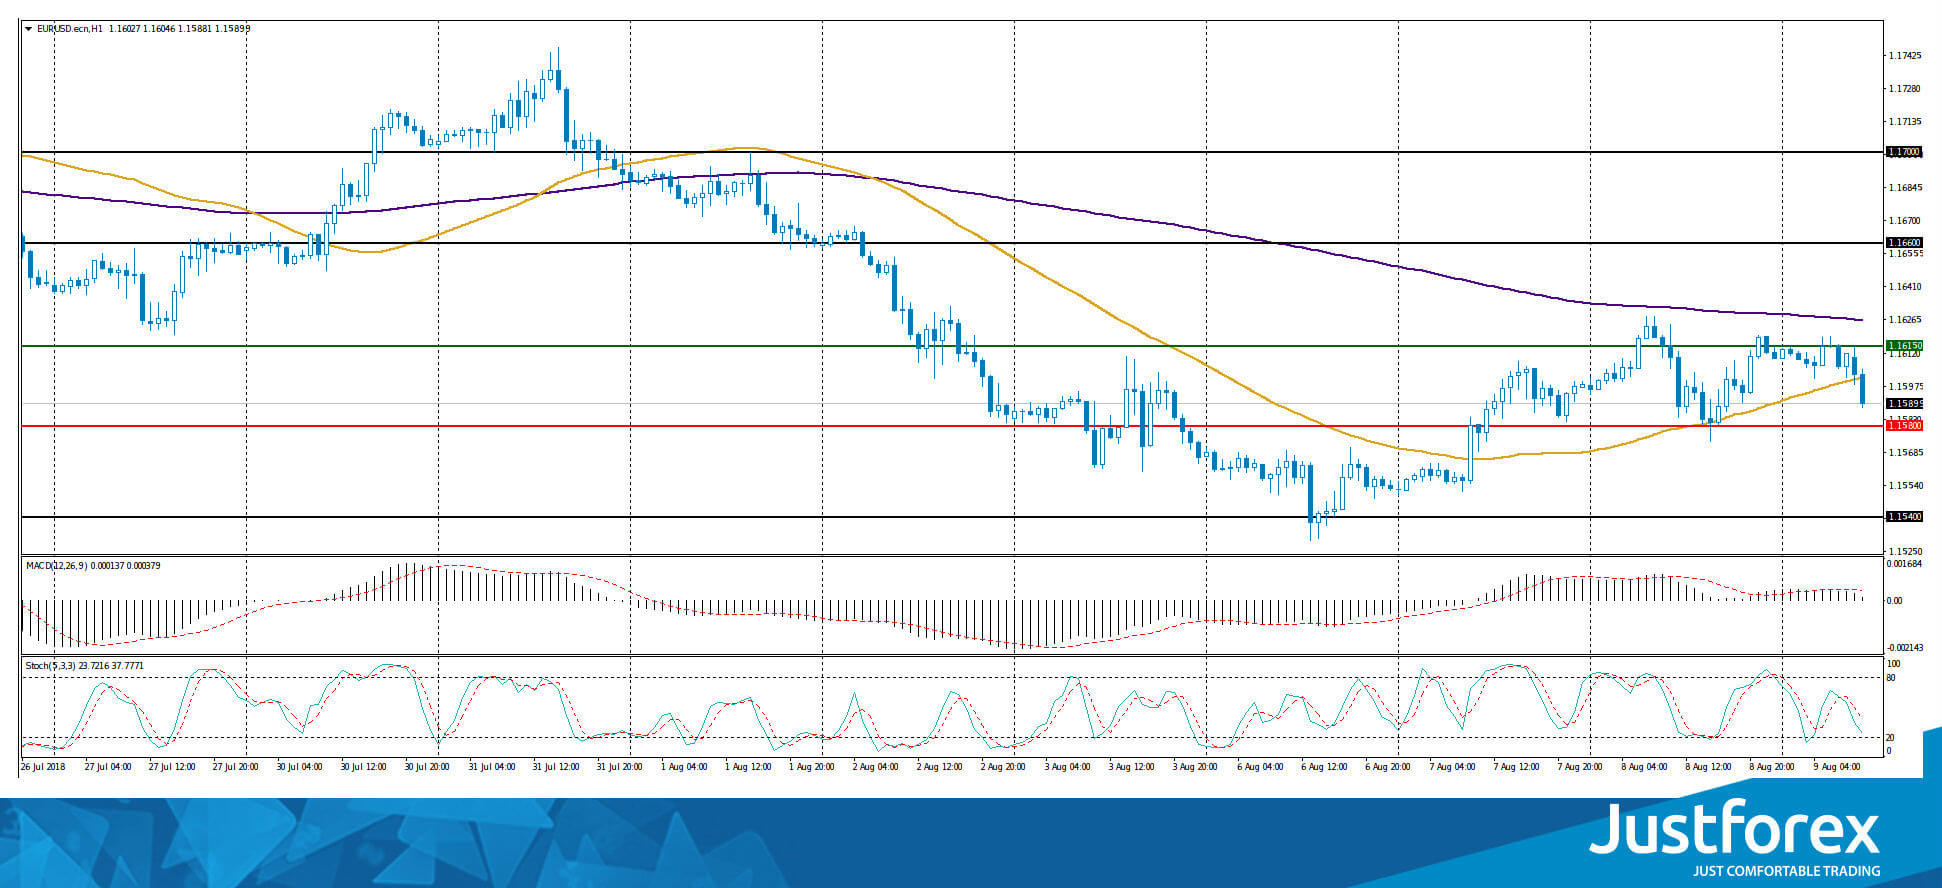
Indicators do not send accurate signals. The price has crossed 200 MA.
The MACD histogram is located near the 0 mark.
Stochastic Oscillator is in the neutral zone, the %K line is below the %D line, which signals to sell EUR/USD.
Trading recommendations
Support levels: 1.15800, 1.15400
Resistance levels: 1.16150, 1.16600, 1.17000
If the price fixes above the resistance level of 1.16150, the EUR/USD quotes are expected to rise. The movement is tending to 1.16600-1.16800.
Alternative option. If the price fixes below the support level of 1.15800, it is necessary to consider sales of EUR/USD. The movement is tending to 1.15400-1.15200.
The GBP/USD currency pair
Technical indicators of the currency pair:
Prev Open: 1.29378
Open: 1.28790
% chg. over the last day: -0.48
Day's range: 1.28446 – 1.29757
52 wk range: 1.2361 – 1.4345
The bearish sentiment prevails on the GBP/USD currency pair. During yesterday's and today's trading sessions, quotes have been decreased by more than 100 points. Investors are still concerned about the consequences of Brexit. At the moment, the local support and resistance levels are 1.28350 and 1.28800, respectively. The trading instrument has the potential for further reduce.
The news feed on the UK economy is calm.
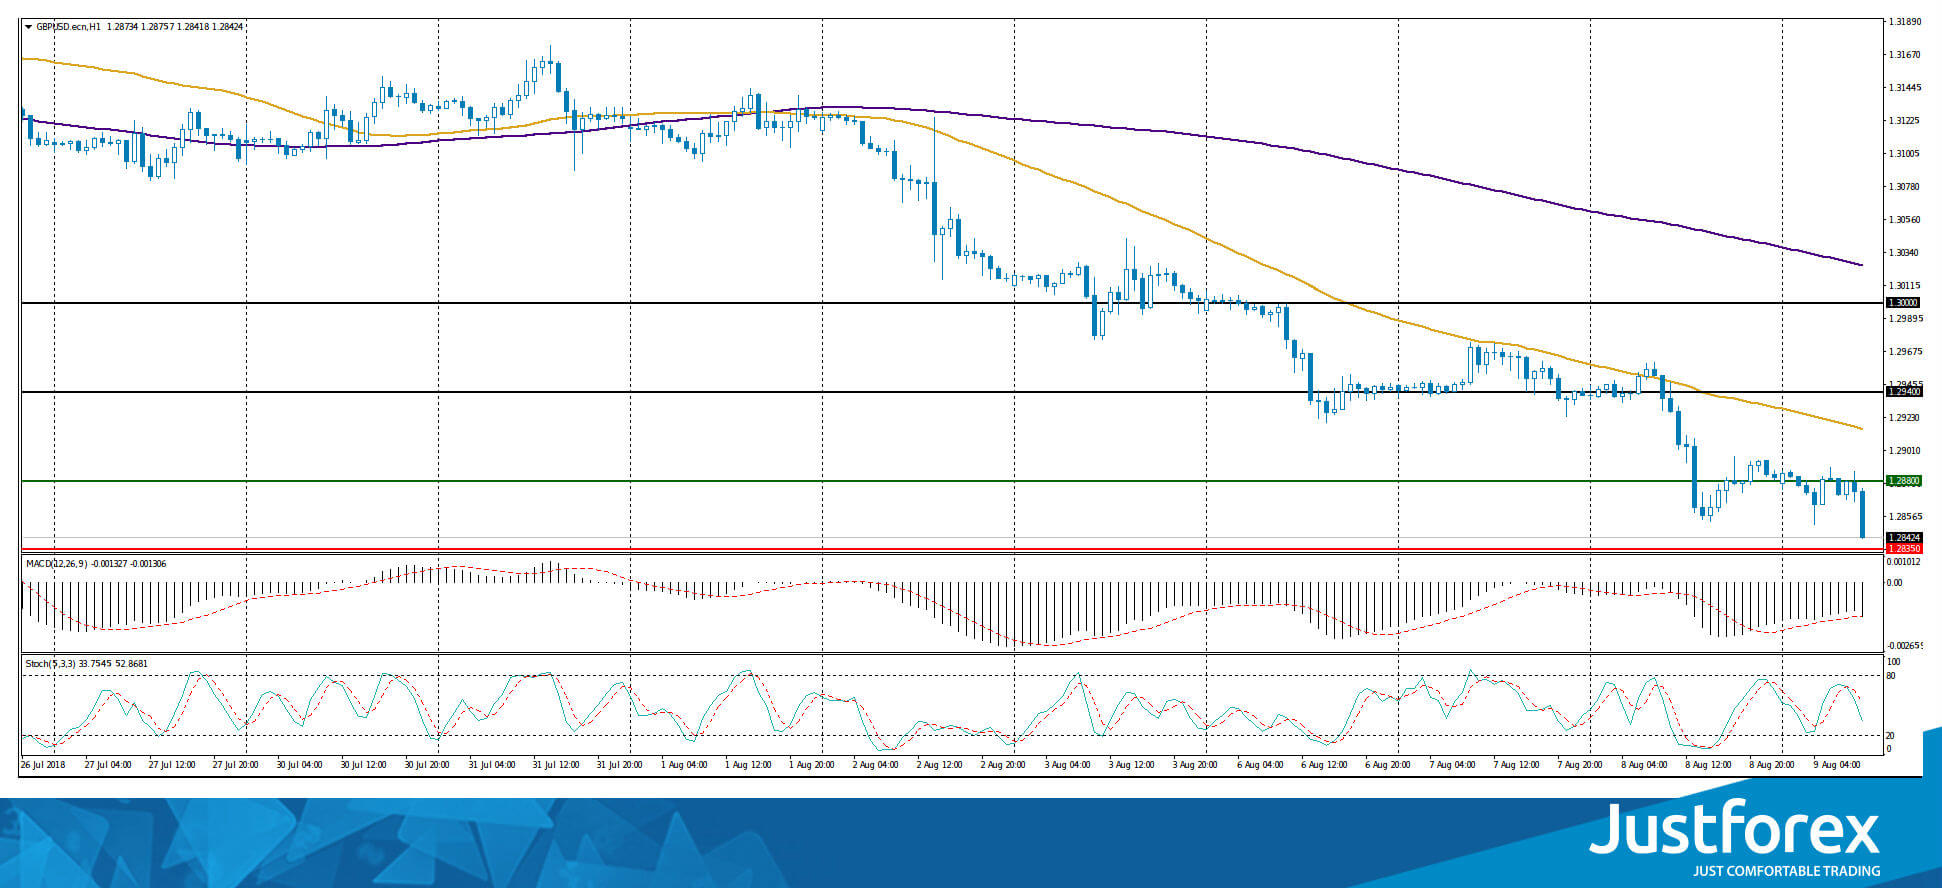
Indicators point to the power of sellers: the price has fixed below 50 MA and 200 MA.
The MACD histogram is in the negative zone and continues to decline, which gives a strong signal to sell GBP/USD.
Stochastic Oscillator is located in the neutral zone, the %K line is below the %D line, which also indicates the bearish sentiment.
Trading recommendations
Support levels: 1.28350, 1.28000
Resistance levels: 1.28800, 1.29400, 1.30000
If the price fixes below 1.28350, the GBP/USD quotes are expected to fall. The movement is tending to 1.28000-1.27750.
Alternative option. If the price fixes above the resistance of 1.28800, correction movement is expected. The movement is tending to 1.29200-1.29500.
The USD/CAD currency pair
Technical indicators of the currency pair:
Prev Open: 1.30521
Open: 1.30481
% chg. over the last day: -0.25
Day's range: 1.30125 – 1.30210
52 wk range: 1.2059 – 1.3795
Yesterday, aggressive sales were observed on the USD/CAD currency pair. Quotes rose, but then fell by more than 100 points. At the moment, the technical pattern is ambiguous. The key support and resistance levels are 1.30000 and 1.30300, respectively. The USD/CAD currency pair is tending to grow.
Today, the news feed on the economy of Canada is calm.
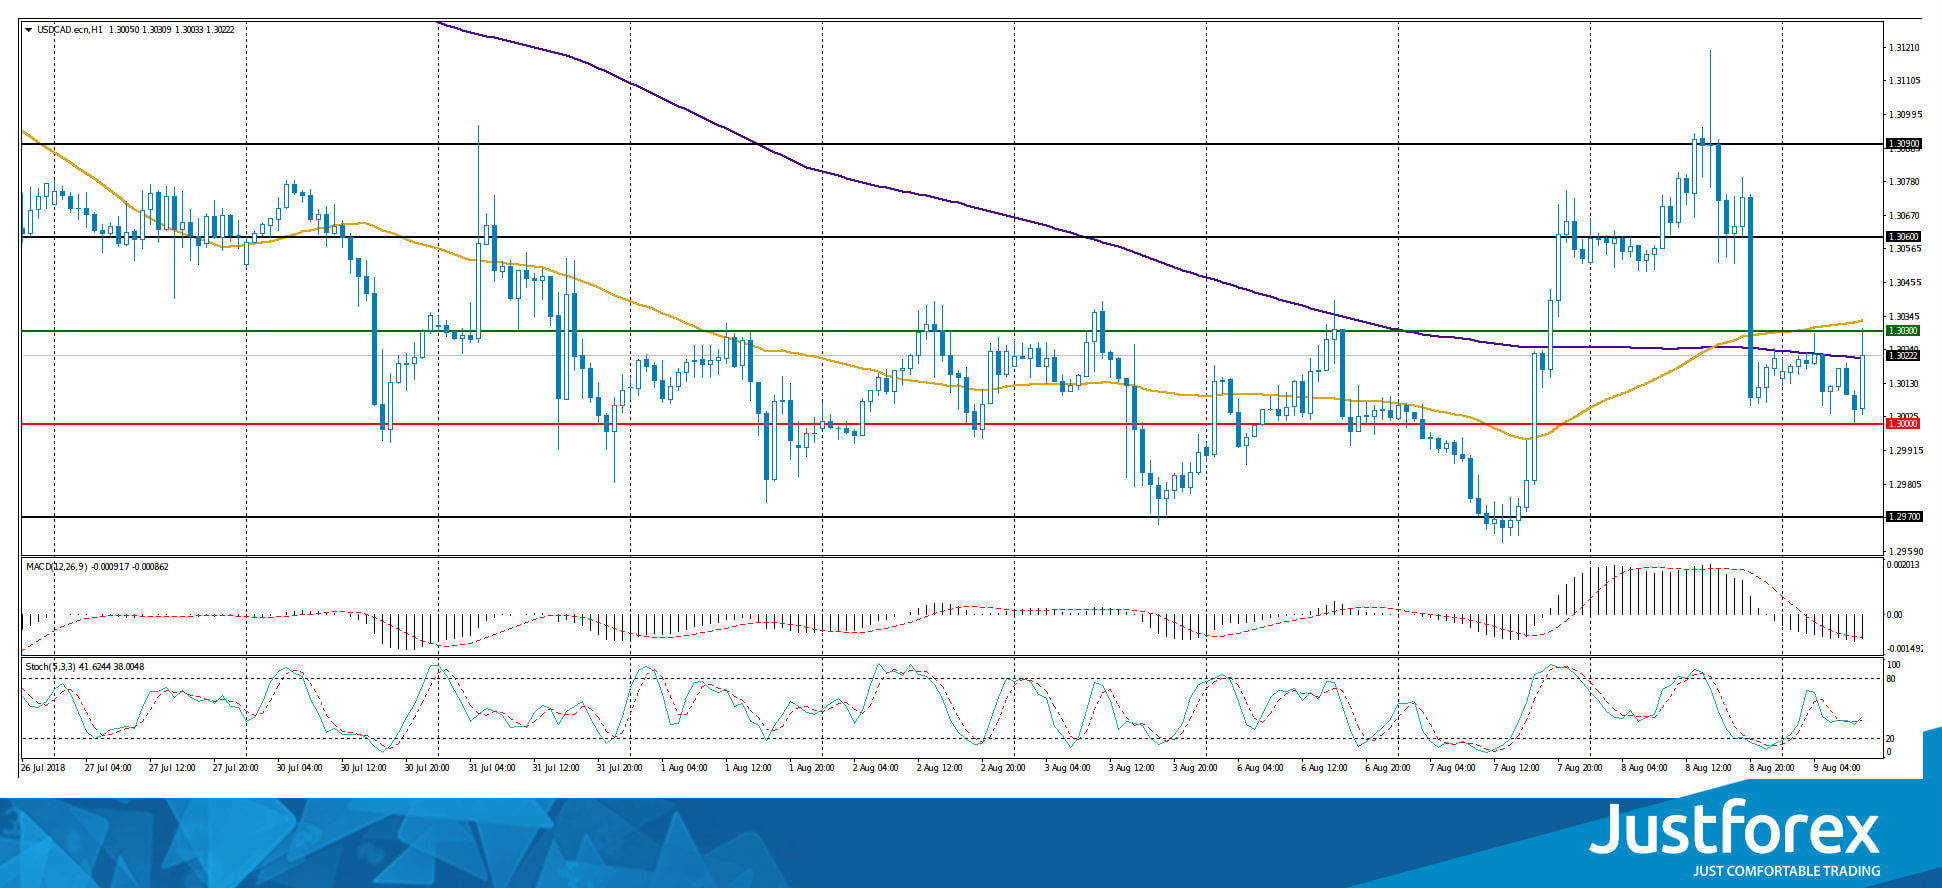
Indicators do not send accurate signals: the price has crossed 50 MA and 200 MA.
The MACD histogram is in the negative zone and below the signal line, which gives a signal to sell USD/CAD.
Stochastic Oscillator is located in the neutral zone, the %K line has crossed the %D line. There are no signals at the moment.
Trading recommendations
Support levels: 1.30000, 1.29700
Resistance levels: 1.30300, 1.30600, 1.30900
If the price fixes above the key resistance of 1.30300, the USD/CAD quotes are expected to rise. The target movement level is 1.30600-1.30800.
Alternative option. If the price fixes below the round level of 1.30000, it is necessary to consider sales of USD/CAD. The movement is tending to 1.29700-1.29500.
The USD/JPY currency pair
Technical indicators of the currency pair:
Prev Open: 111.357
Open: 110.967
% chg. over the last day: -0.43
Day`s range: 110.966 – 111.034
52 wk range: 104.56 – 114.74
During yesterday's trading session, a downward trend was observed on the USD/JPY currency pair. Quotes fell by more than 70 points. At the moment, the USD/JPY quotes are consolidating. Local support and resistance levels are 110.900 and 111.200, respectively. We recommend paying attention to the dynamics of the US government bonds yield. Further growth of the currency pair is not excluded.
The news feed on the economy of Japan is calm.
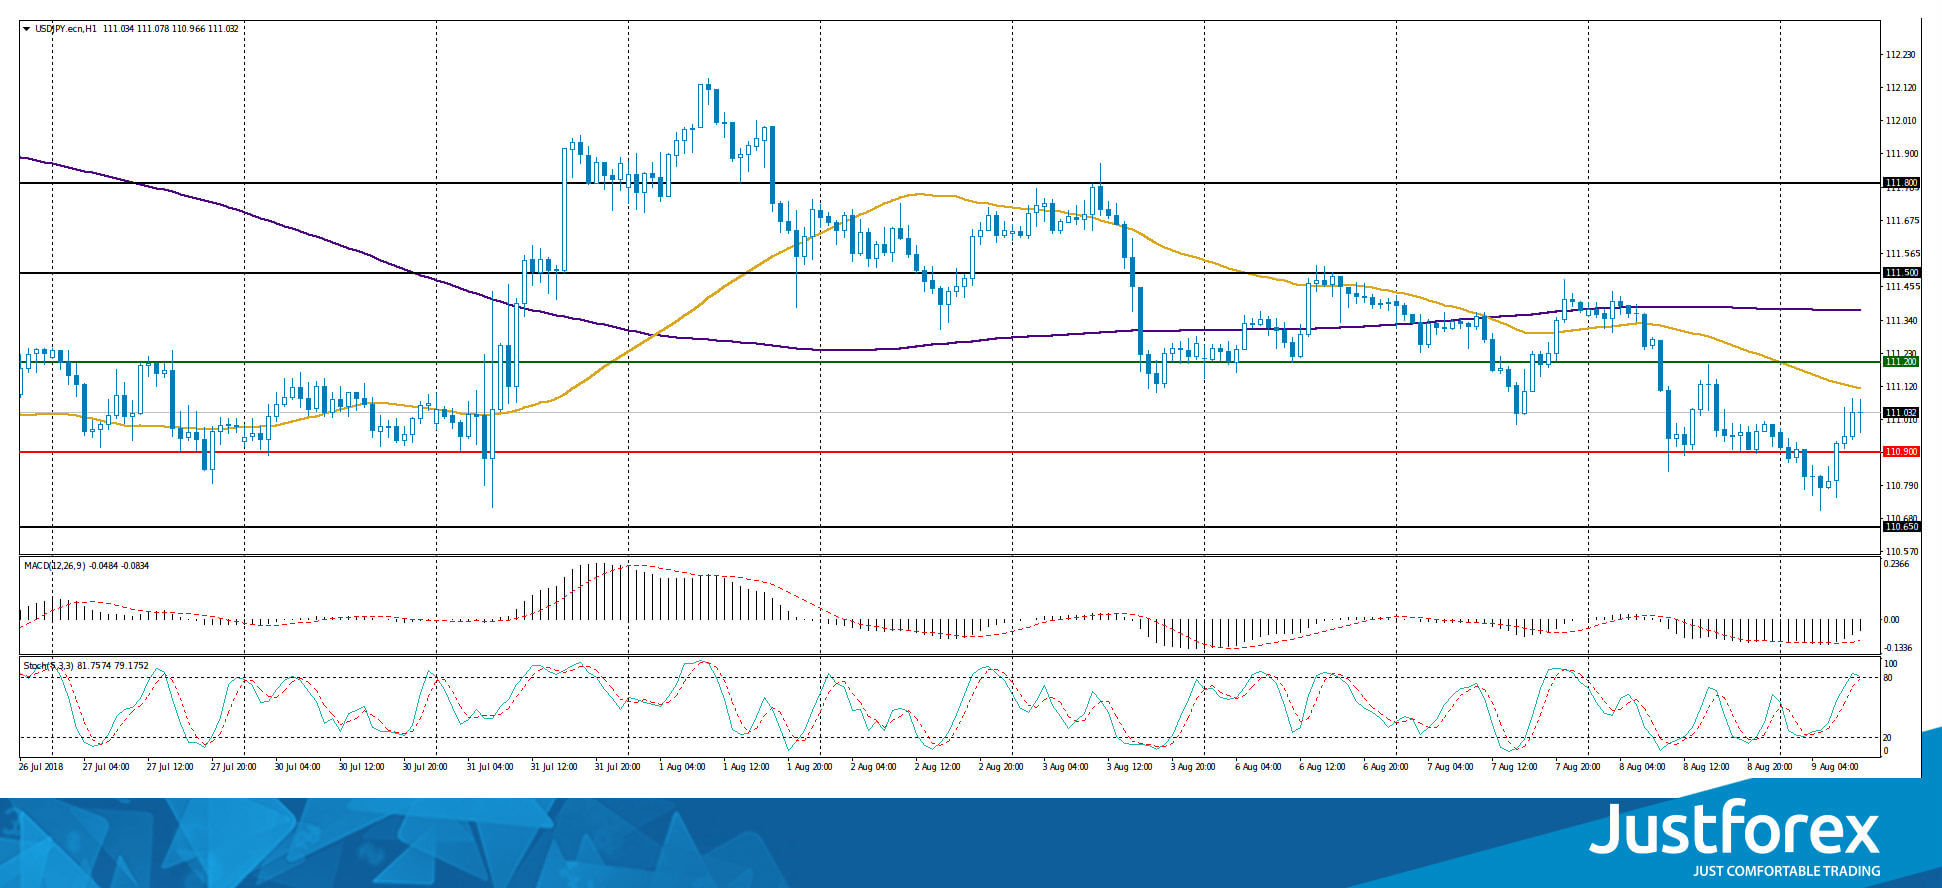
The price has fixed below 50 MA and 200 MA, which indicates the power of sellers.
The MACD histogram is in the negative zone, but above the signal line, which gives a weak signal to sell USD/JPY.
Stochastic Oscillator is located in the overbought zone, the %K line is crossing the %D line. There are no accurate signals.
Trading recommendations
Support levels: 110.900, 110.650
Resistance levels: 111.200, 111.500, 111.800
If the price fixes below 110.900, it is necessary to look for entry points to the market to open short positions. The movement is tending to 110.650-110.500.
An alternative is the USD/JPY quotes growth to 111.500-111.800.
NZDUSD Touches New 29-Month Bottom, Sharp Sell-Off Continues
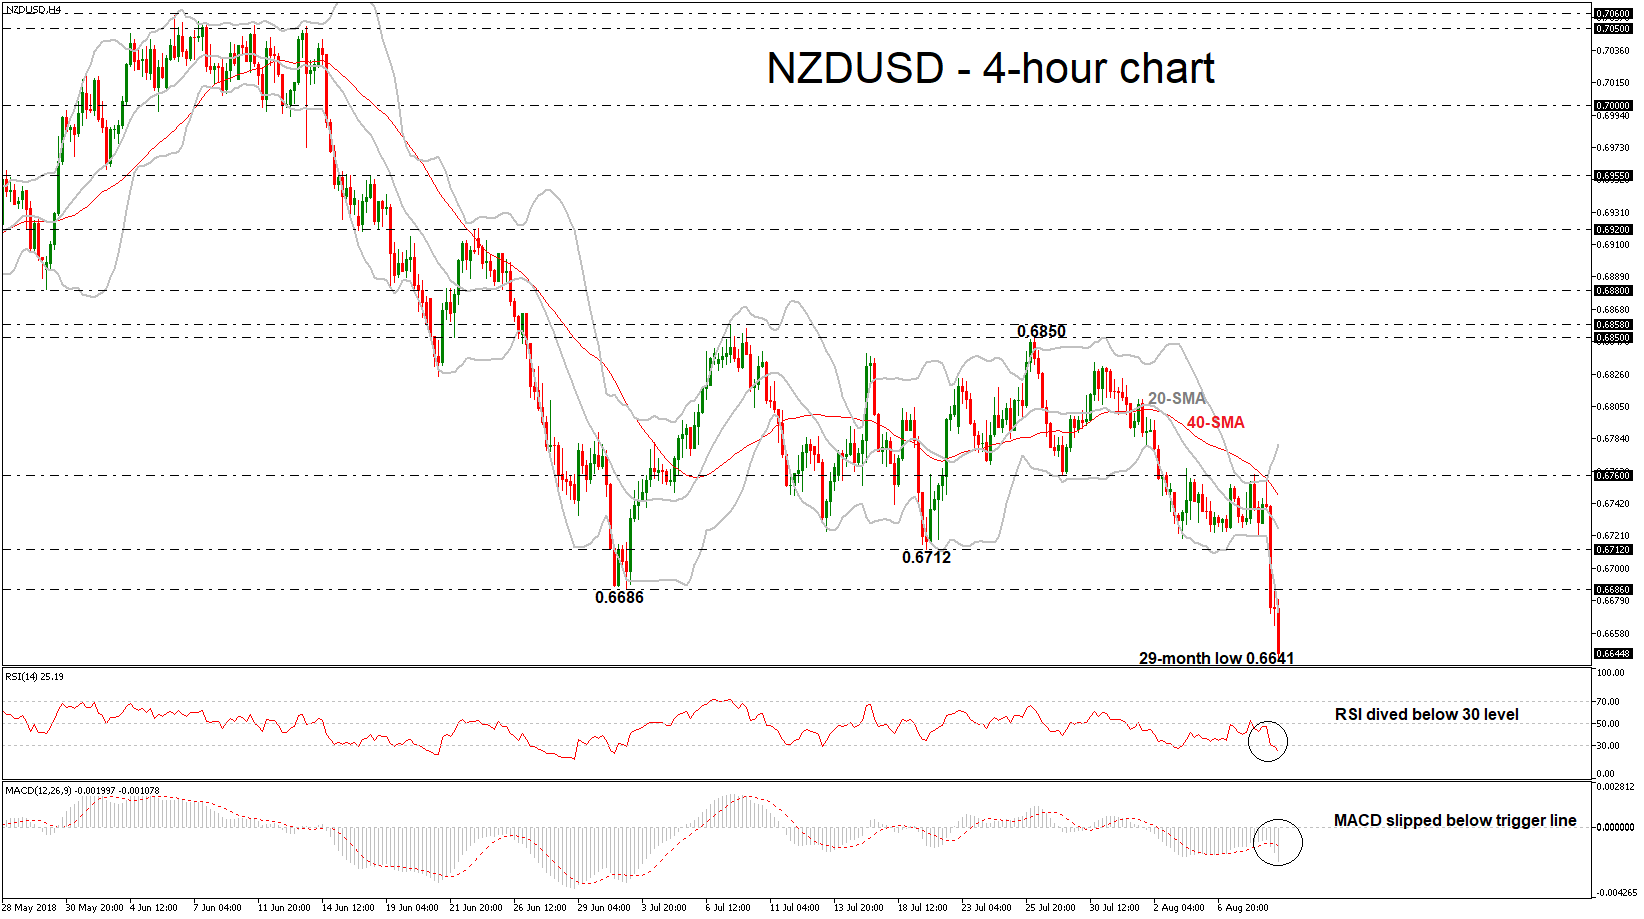
NZDUSD is posting an aggressive bearish rally over today’s session, recording a fresh 29-month low of 0.6641. The price plunged below the lower Bollinger Band in the 4-hour chart, suggesting an extension of the downward pressure. The momentum indicators are supportive of the negative picture, with the RSI falling into the oversold zone below 30 level and the MACD strengthening its falling mode below the trigger and zero lines.
Should the market extend losses, support could be met at the 0.6570 hurdle, taken from the low on March 2016. A significant leg below this area could send prices towards the 0.6345 region, identified by the bottom on January 2016.
However, if the market manages to pick up speed, the 0.6686 level could offer nearby resistance ahead of the 0.6712 barrer. A close above the latter and a climb above the 20- and 40-simple moving averages (SMAs) in the near term would raise chances for further increases. In this case, prices could hit the 0.6760 obstacle.
Overall, NZDUSD continues the downward pattern in the medium-term, creating lower lows and lower highs.