

Sample Category Title
In Japan, Still Waters Merit Attention to Any Ripple
Executive Summary
Even as many of the world's major central banks have been steering toward normalization of monetary policy, the Bank of Japan (BoJ) has remained a holdout. The GDP report for the second quarter offers nothing that will compel BoJ policymakers to change course. That said, there are incremental changes going on in the Japanese economy, which combined with some logistical constraints on the viability of continuing central bank balance sheet expansion forever, may eventually warrant a change in forward guidance from the BoJ. In this special report, we unpack the latest GDP data and consider how some of these small changes may eventually allow the BoJ to let up on the gas after years of having the accelerator stomped to the floor. The most consequential factor in our view is the extent to which recent wage gains will be sustained and whether that will pass through to a broader push to sustained inflation at, or near, the 2.0 percent target.
After Soft Start, Much Better Growth in Japan in Q2
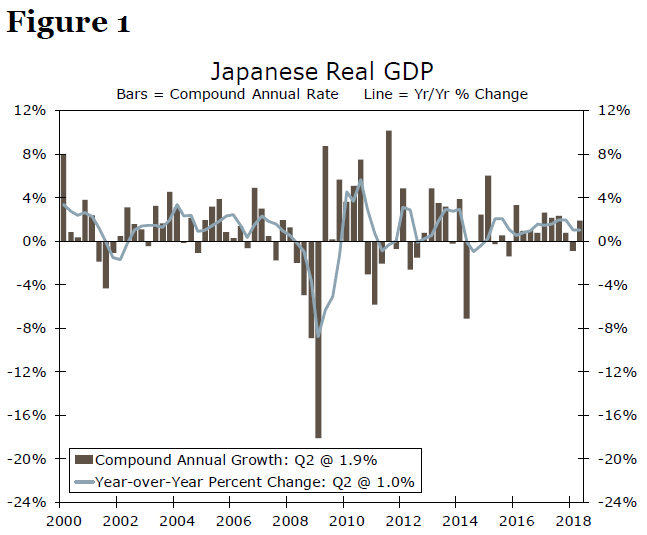
Real GDP growth in Japan came in at a 1.9 percent annualized rate in the second quarter, although revisions to previously-reported numbers showed the contraction in the first quarter was slightly larger than first thought (Figure 1). Still the outcome in the second quarter was better than expected, and alleviates concern that Japan's economy was in trouble.
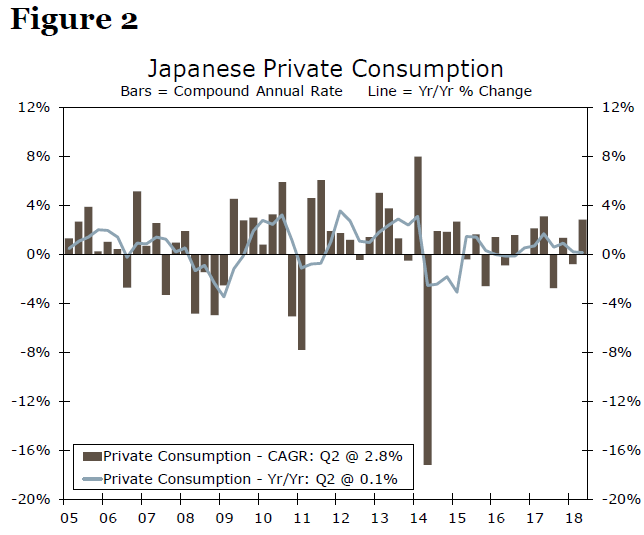
Consumer spending rebounded in the quarter, growing at a 2.8 percent annualized rate (Figure 2). The resurgence of the Japanese consumer of late has been a pleasant surprise. Department stores in Tokyo reported 6.9 percent year-over-year sales growth in June—that is the biggest yearly gain in about three years.
The more robust consumer spending comes with a bit of a tradeoff in the GDP accounting: more consumer spending is often associated with faster import growth. That was certainly the case in the second quarter as Japanese imports grew at a 3.9 percent clip. Exports eked out a scant gain, but not nearly enough to offset the pick-up in imports. The contribution from trade as a whole was a drag of half a percentage point.
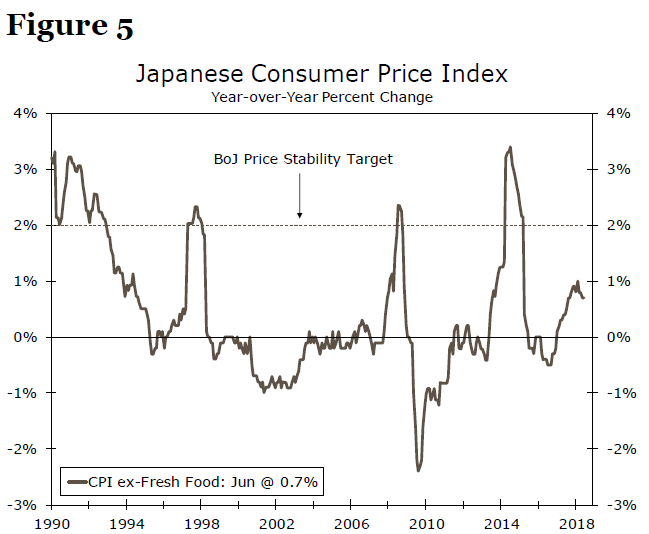
The BoJ's ultra-accommodative monetary policy is intended to spur inflation to the Bank's 2.0 percent target. That has been an elusive goal throughout most of the current cycle partly because even though Japanese businesses report strong profits, there has been only modest willingness to put that capital to use. That may be changing.
After six straight quarters in which firms have only gradually increased spending, business investment grew at a 5.2 percent annualized rate, the fastest pace since Q4-2016. This uptick in spending was large enough to add 0.8 percentage points to GDP—more than enough to fully offset the drag from net exports during the period. A continuation of slow inventory growth added another two tenths of a percent to GDP as well.
Tight Labor Market Lending BoJ a Hand
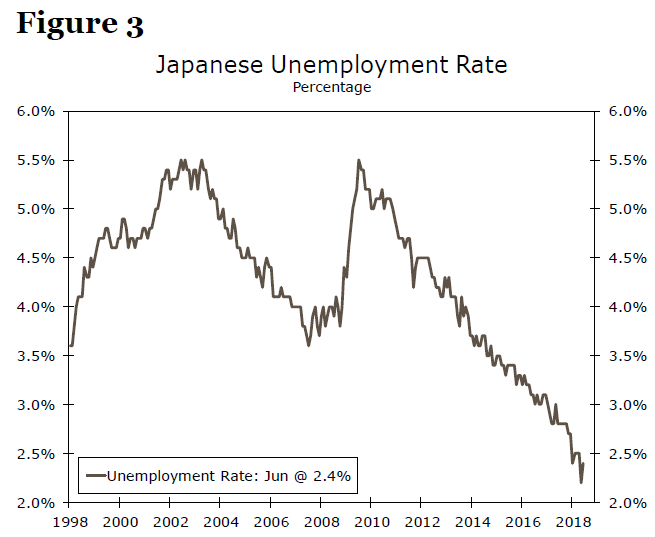
For the BoJ, the more vexing consideration about business spending from a policy standpoint is to what degree businesses will pass on increased profits to employees in the form of higher wages. The unemployment rate ticked up a notch in June amid trend improvement in participation. Still, it remains among the lowest jobless rates for any advanced economy at just 2.4 percent (Figure 3).
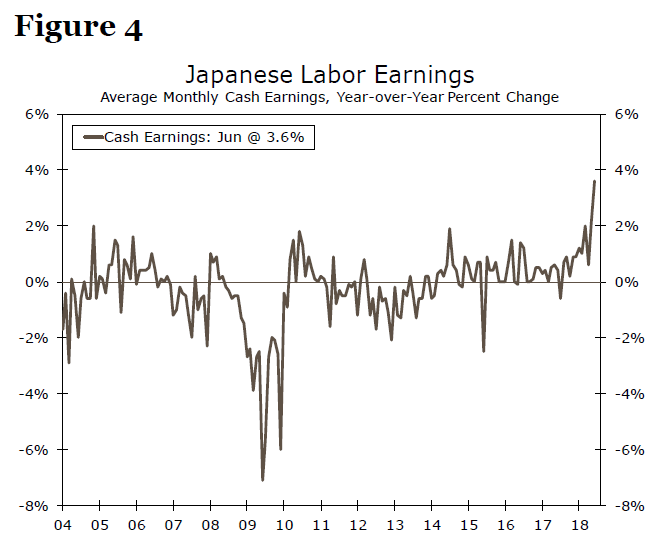
The tight labor market is at last compelling businesses to do what years of pleading from policymakers could not: it is making them pay people more. Average monthly cash earnings, which have been stuck in neutral for years, are finally picking up. The year-over-year growth rate of monthly cash earnings is up 3.6 percent (Figure 4). Workers in Japan have only rarely seen earnings growth of more than 2 percent in the past 20 years and 3.6 percent for June is the fastest year-over-year growth in earnings since 1997.
Inflation in Japan may already be getting a slight (and welcome) push from bigger wages. The year-over-year rate of CPI inflation in June firmed to 0.7 percent (Figure 5). That is still well-below the BoJ's 2.0 percent target, but it is a step in the right direction, if only an incremental one. There is a CPI series for just the Tokyo market that comes out earlier than the broad CPI inflation measure. It is such a good predictor that we use that Tokyo version in our model for national CPI. The 0.9 percent print for Tokyo CPI inflation in July augers well for another notch or two higher in the broader CPI inflation rate for July.
Outlook for the BoJ
At its July 31 meeting, the BoJ held interest rates steady and maintained its comprehensive program of monetary policy support. Remaining dovish on forward guidance, the BoJ stated that it "intends to maintain the current extremely low levels of short- and long-term interest rates for an extended period of time". It had already dropped any reference to a timeline for achieving its 2.0 percent inflation target, although Governor Kuroda affirmed multiple times that the removal of the date was not in any way an indication of monetary policy bias.
Dynamics in the Japanese economy can be a game of inches rather than yards and that is true of monetary policy as well. As a case in point, consider this: the BoJ made clear that it would allow the yield on the benchmark 10-year Japanese Government Bond (JGB) to move as much a 20 basis points on either side of its zero yield target (Figure 6). This followed rumors in weeks leading up to the meeting that the BoJ might announce plans to remove accommodative policy in one way or another.
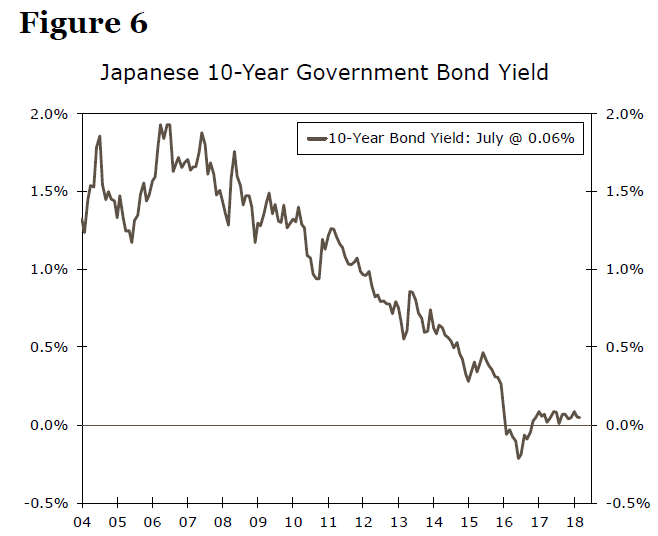
This carefully calibrated move to allow some variability in the 10-year JGB yield is not a change in the BoJ's policy stance, but when the water is completely still, even the slightest ripple bears mention.
We do not see BoJ policy being materially impacted by today's GDP report, and we expect that the very modest growth which has characterized the past few years will return in the quarters ahead. If there is a factor likely to influence the BoJ to adjust its forward guidance, it is the extent to which the incipient rise in wages translates into sustained CPI inflation.
U.K. Mid-Year Economic Outlook
Executive Summary
Economic growth in the United Kingdom picked up modestly in Q2 after slowing in the first quarter. Real GDP rose 0.4 percent on a sequential basis, driven by solid growth in consumer and business spending. Inflation in the U.K. has also returned closer to the Bank of England's (BoE) 2 percent target in recent months after surpassing 3 percent in the wake of the Brexit referendum in 2016. Real wages now look poised to pick up and, along with a tight labor market, should continue to support consumer spending going forward. While growth in domestic demand remained solid in Q2, export growth dropped into negative territory. However, solid global economic growth in the second half of the year should prove a positive for international trade in the U.K., and we look for overall GDP growth to continue to grind higher this year and into 2019.
But Brexit remains the elephant in the room, as uncertainty has increased recently on whether the U.K. and European Union can iron out the future of their economic and financial relationships by the March 2019 deadline. The possibility that negotiations break down and a "hard" Brexit occurs next year poses a substantial downside risk to our forecast of sustained economic growth in the U.K., given the extensive trade and financial ties between the two economies. Uncertainties surrounding negotiations also have the potential to weigh on investment spending, which has already slowed in the wake of the initial referendum in 2016. For now, our brighter outlook for the future of the U.K. economy is based on the assumption that a "hard" Brexit does not come to pass. Should this be the case, we look for the BoE to continue to tighten policy, albeit at a very gradual pace. Inflation has already come back toward target, and higher debt-servicing costs for U.K. households also pose a risk to consumer spending. Brexit-related concerns remain on the horizon, and the BoE will likely proceed with caution until some of these uncertainties subside.
U.K. GDP Rebounds Modestly in Q2 after Sluggish First Quarter
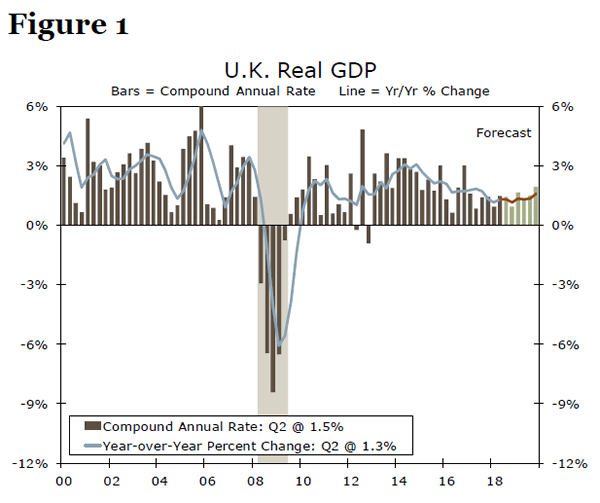
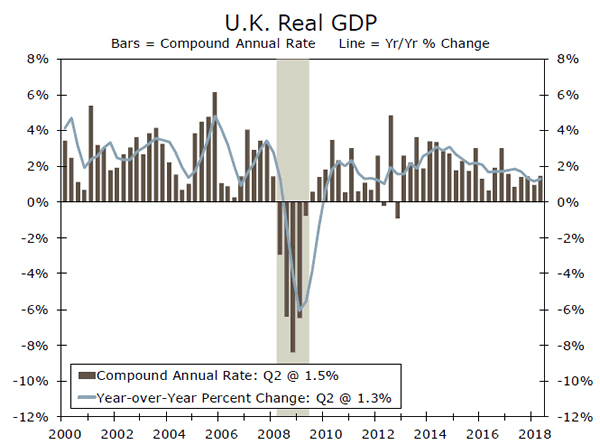
Data released today showed that real GDP in the United Kingdom grew 0.4 percent on a sequential basis (1.5 percent at an annualized rate) in Q2-2018 (Figure 1). The outturn represents a modest strengthening in growth relative to the 0.2 percent rate that was registered in the first quarter; however, the economy has only grown a relatively slow pace over the past several quarters. That said, a breakdown of the real GDP data into its underlying demand components showed that several sectors of the economy made a comeback in Q2. Consumer spending rose 0.3 percent in the quarter. As inflation has receded in recent months, which we discuss in more detail below, there are signs that real wage growth is beginning to pick up. Higher real wages along with a tight labor market–the unemployment rate is currently at a 43 year low—should support growth in consumer spending in coming quarters.
Investment spending was also a notable standout, rebounding 0.8 percent in the quarter after growth dropped into negative territory in Q1. While business fixed investment has decelerated in the wake of Brexit-related uncertainties, the Q2 rebound is supportive for near-term GDP growth prospects. Although consumer spending and business fixed investment proved to be bright spots in today's print, international trade was a drag on topline GDP growth. Exports dropped 3.6 percent after posting flat growth in Q1, and imports also declined in the quarter. That said, solid global economic growth in the second half of the year should be supportive of a resurgence in external demand.
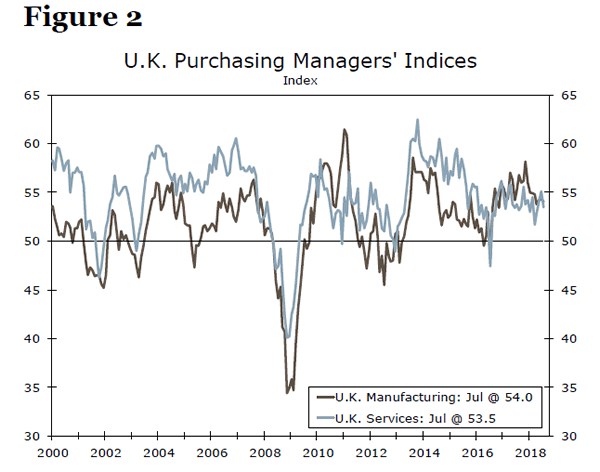
There is not much "hard" data yet from the third quarter, but some "soft" economic indicators suggest that U.K. GDP growth has remained positive thus far in Q3. For example, the respective purchasing managers' indices from the manufacturing and service sectors remained well above the demarcation line separating expansion from contraction in July (Figure 2). Our forecast looks for real GDP in the United Kingdom to continue to grow at a modest rate through at least the end of the year before accelerating somewhat in 2019 (Figure 1). Although the Bank of England has hiked its main policy rate 50 bps since last November, monetary policy generally remains accommodative and it is not yet restraining economic activity. Solid economic growth in most of the U.K.'s major trading partners should continue to support growth in British exports for the foreseeable future. That said, there is a significant downside risk to our U.K. GDP forecast, a topic to which we now turn.
Brexit: The Elephant in the Room
Our forecast of continued economic expansion in the United Kingdom is conditional on our assumption that a "hard" Brexit does not occur on March 29, 2019.1 Specifically, we assume that the trading relationship that the United Kingdom currently enjoys with the other 27 members of the European Union (EU-27) will be maintained for approximately two years after March 2019, which will allow negotiators to hammer out the details of a new trading relationship. But the assumption of a smooth transition to a new trading relationship is by no means assured. There is little consensus within the British government about the U.K.'s future relationship with the European Union, and negotiators from the United Kingdom and the EU-27 have made little progress to date. Negotiations could ultimately break down, and a "hard" Brexit could potentially occur in March 2019.
The United Kingdom has extensive trade and financial ties with the European Union. Last year, the United Kingdom sent £164 billion (roughly $215 billion) of exports of goods to the EU-27, which is equivalent to about 8 percent of U.K. GDP. An additional £110 billion (about $140 billion) worth of services were exported to the EU-27 in 2017. The U.K. economic outlook would darken if a "hard" Brexit were to occur and the EU-27 imposed tariffs and other trade restrictions on £275 billion worth of British exports of goods and services.
Moreover, the current uncertainty regarding the ultimate trading relationship and the economic outlook could lead U.K. businesses to mothball investment decisions until more visibility is at hand. Indeed, growth in business fixed investment (BFI) spending has slowed already. BFI was essentially flat in 2016, the year of the Brexit referendum, and it grew only 1.6 percent last year. In contrast, BFI grew at an average rate of 4.5 percent per annum in 2014 and 2015. Growth in investment spending likely will remain sluggish until some of the uncertainty about the long-run trading relationship that the United Kingdom will maintain with the EU-27 is cleared up. A "hard" Brexit could lead to an outright drop in BFI spending.
Bank of England Likely Will Tighten Further, But Only Slowly
Assuming that our forecast of continued economic growth in the United Kingdom comes to pass, we would look for the Bank of England to continue tightening monetary policy at a gradual pace (Figure 3). The Monetary Policy Committee (MPC) lifted the Bank's main policy rate 25 bps on August 2, which we think was the one and only rate hike that it will undertake in 2018. But we forecast that the MPC will tighten further next year with a 25 bps rate hike in the first quarter of 2019 and another one in the third quarter.
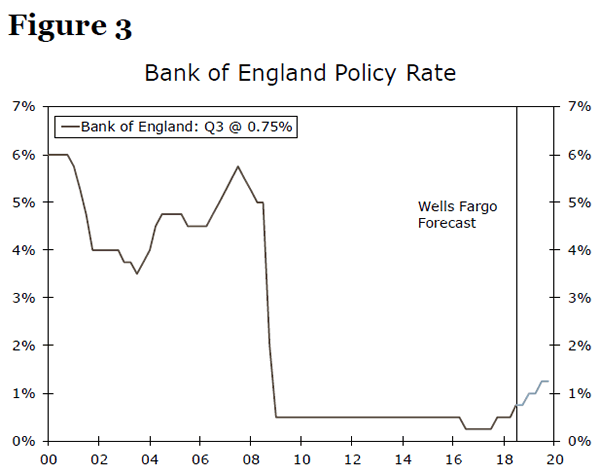
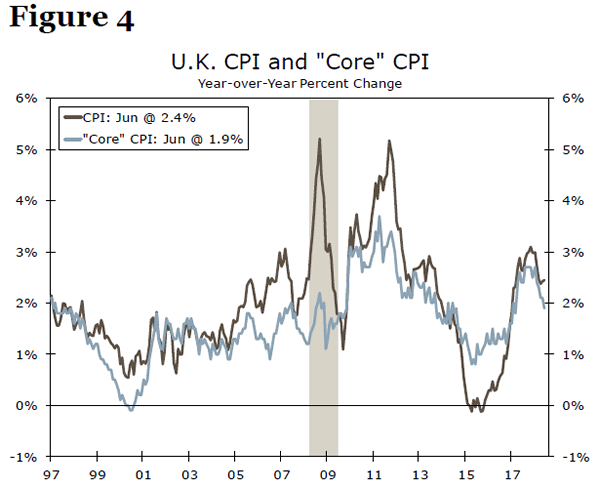
So why will the MPC tighten policy only gradually? For starters, the BoE is tasked by the U.K. government with hitting an inflation target of 2 percent. CPI inflation shot higher in 2017 as the sharp depreciation of sterling in the aftermath of the Brexit referendum lifted import prices (Figure 4). However, inflation has been receding back toward target in recent months, so the MPC probably does not need to tighten policy sharply in order to stabilize inflation expectations.
Secondly, most mortgages in the United Kingdom have some sort of floating-rate structure, and large changes in interest rates lead to meaningful changes in debt-servicing costs among households. Everything else equal, the MPC would want to tighten policy at a gradual pace to guard against the possibility of an abrupt deceleration in consumer spending due to rising debtservicing burdens.
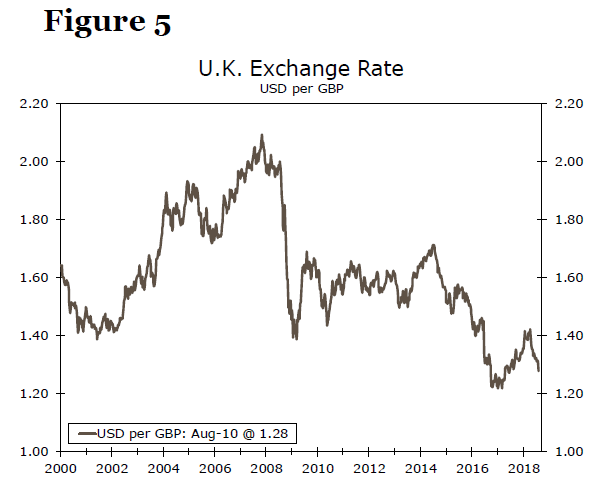
The British pound has depreciated modestly versus the U.S. dollar since April as the greenback has enjoyed general strength versus most currencies (Figure 5). Looking forward, our currency strategy team expects that sterling will slowly trend higher versus the dollar in coming quarters. Although the U.S. Federal Reserve will likely continue to tighten monetary, rates hikes by other central banks, including the BoE, should lend support to most foreign currencies, including the British pound.
Conclusion
Real GDP in the United Kingdom rose 0.4 percent in Q2 after a marked slowdown earlier this year. Several sectors of the economy performed solidly in the quarter, with notable increases in consumer spending and business fixed investment. While trade proved a drag on Q2 GDP growth, solid global growth through the remainder of this year should be supportive of a rebound in external demand. That said, Brexit remains the elephant in the room, as uncertainty has increased in recent weeks on whether the U.K. and European Union can reach an agreement on the future of their economic and financial relationships by the March 2019 deadline. A "hard" Brexit, which could occur if negotiations break down, poses a significant downside risk to our outlook for the U.K. economy. For now, our forecast of continued economic growth in the U.K. is contingent on the fact that a "hard" Brexit does not come to fruition. Should these assumptions remain intact, we look for the BoE to continue to slowly tighten policy in the coming quarters as economic growth also picks up.
1 A "hard" Brexit would occur if the United Kingdom leaves the European Union on March 29, 2019 with no agreements in place. In that event, the rules and regulations governing trade in goods and services between the United Kingdom and the EU-27 would be similar to the current rules between a non-EU country, say the United States, and the European Union.
Weekly Economic and Financial Commentary: Lackluster Growth in Some Foreign Economies in Q2
U.S. Review
Prices Continue to Advance
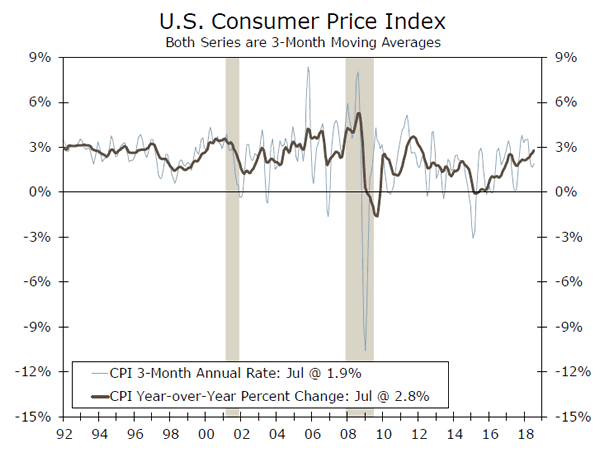
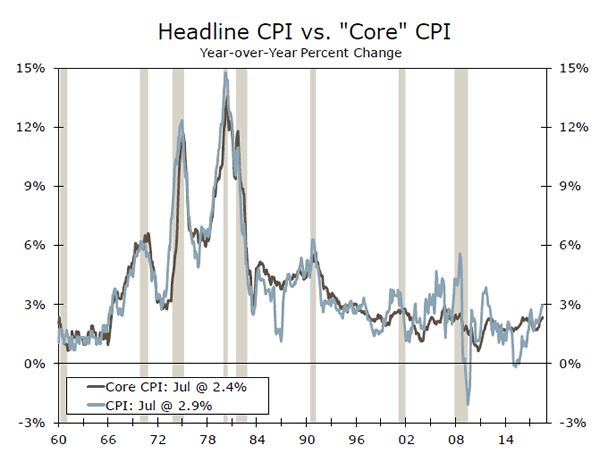
- Consumer prices increased 0.2 percent in July, advancing to 2.9 percent on a year-to-year basis, the strongest pace in six years. The core CPI index also rose a strong 0.2 percent, bringing the year-to-year rate to 2.4 percent.
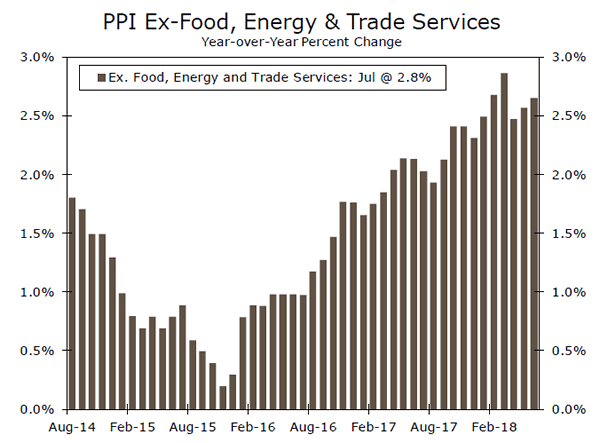
- The Producer Price Index showed no change in July. However, underlying details showed prices trending higher. Excluding food, energy and trade services, prices rose 0.3 percent.
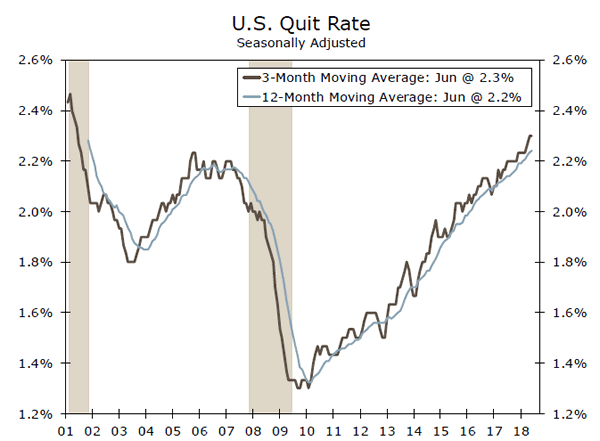
- JOLTS data for June indicated that the number of open job positions remained near record highs at 6.7 million. The quits rate also remained elevated at 2.3 percent.
Prices Continue to Advance
This week offered few surprises in terms of economic data. Prices continue to gradually rise and evidence of a strong labor market continues to mount. We maintain our stance that the Fed should be on track for two more rate hikes this year in September and December, with two additional quarter-point hikes in 2019.
Consumer prices matched expectations and edged up 0.2 percent in July. The monthly gain kept the headline index at a 2.9 percent increase on a year-to-year basis, the fastest pace in six years. Energy prices were a drag on the headline figure and dropped 0.5 percent for the month, mostly the result of lower gas prices. Excluding food and energy prices, the core index also rose 0.2 percent during the month. Before rounding however, core prices came in on the high side of expectations and grew 0.24 percent, pushing prices 2.4 percent higher compared with last year. Much of the monthly increase in core prices was owed to a 0.3 percent gain in services, notably in housing, which also rose 0.3 percent. Vehicle prices also advanced, with a 1.3 percent rise for used vehicles. While increases were generally broad-based, apparel and medical care prices saw modest declines.
Meanwhile, the overall Producer Price Index fell short of expectations and showed no change in July. However, the underlying details showed that prices continue to trend higher. June's soft topline reading was the result of a drag from declines in several volatile sectors. The trade services price index, which is measured by changes to retail and wholesale margins, fell 0.8 percent, while food decreased 0.1 percent and energy declined 0.5 percent. The "core-core" measure, which excludes food, energy and trade services, rose slightly more than expected and increased 0.3 percent during the month. Over the past 12 months, "corecore" prices for U.S. producers have now risen 2.8 percent. However, intermediate prices for processed goods were flat in July and input costs for services have slowed in comparison to earlier this year, an indication that price growth should be contained and continue to advance at a gradual pace.
We also received new data that reflect the underlying strength of the labor market. JOLTS data for June revealed that the number of job openings was essentially unchanged at 6.7 million during the month. However, job openings are near a record high and remain well ahead of the 6.1 million open positions posted a year ago. The number of job openings has also now exceeded the number of unemployed for the fourth consecutive month. Most industries saw the number of job openings increase in June, notably in financial activities and wholesale trade. The construction and manufacturing industries also saw the number of open positions increase during the month, both hitting fresh new cycle highs. The quit rate was essentially unchanged at 2.3 percent, but also sits near its highest point of the expansion. The elevated level of the quit rate signals that workers continue to have a high degree of confidence in the labor market. Quits also usually lead to a pay increase, which should help keep upward pressure on wages.
Initial jobless claims fell to 213,000 for the week of August 4. On a four-week moving average basis, jobless claims are well below the 241,500 registered in the same period last year. The continued low level of jobless claims is consistent with an increasingly shallow pool of available labor.
U.S. Outlook
Retail Sales • Wednesday
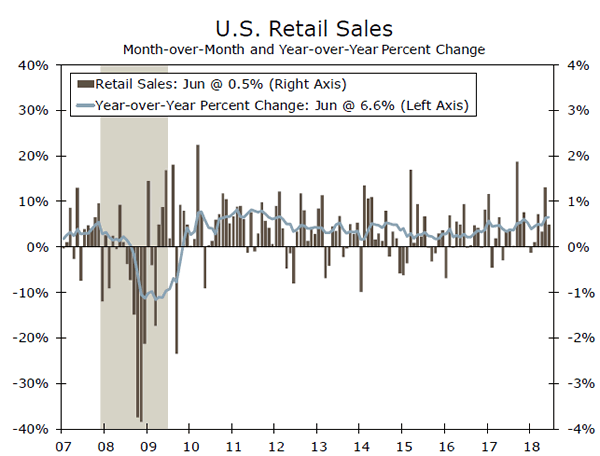
Retail sales rose 0.5 percent in June, while May's gain was revised up to a strong 1.3 percent. Control group sales were flat on the month, which was not too concerning given the upward revisions to prior months. These retail sales figures are consistent with the 4.0 percent annualized rise in personal consumption expenditures registered in the second quarter. It is tempting to tie the second quarters' big gain in consumer spending to the tax cuts; however, part of the strength reflects some catchup from the first quarter, which was, in part, negatively impacted by harsh winter conditions. Catchup effects, coupled with a weak print in June, do not provide great momentum for retail sales going into the third quarter. We expect some weakness to remain, and look for retail sales to rise only 0.1 percent in July. However, given a tight labor market and wage growth beginning to materialize, the current weakness in retail sales is unlikely to persist throughout the remainder of the year.
Previous: 0.5% Wells Fargo: 0.1% Consensus: 0.1% (Month-over-Month)
Industrial Production • Wednesday
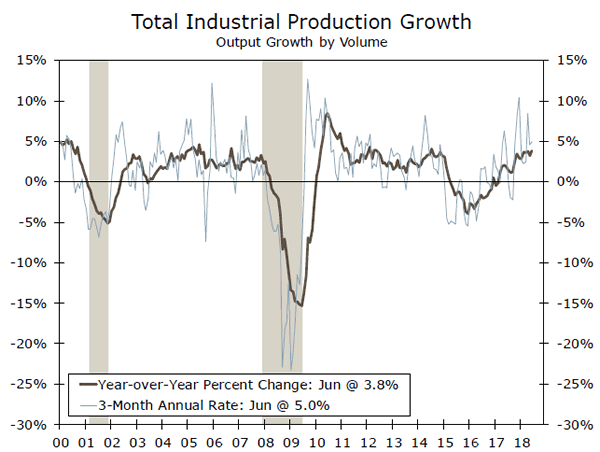
Industrial production rose 0.6 percent in June. Due to supply disruptions from a major fire at a parts supplier the prior month, the gain was largely driven by a 7.8 percent bounce-back in motor vehicles and parts production. Mining output marked its fifth consecutive monthly gain, increasing 1.2 percent, as elevated energy prices drove production. Utilities output, however, fell 1.5 percent in June. June's rise in production nudged capacity utilization back up to 78 percent. Despite remaining slightly below the long-run average of 79.8 percent, capacity constraints are evident in the supply chain, and continue to be supportive of increased investment spending and mounting price pressures. Given the strength of the ISM index, which sits at 58.1 as of July, we expect industrial activity to continue to advance to a level that is more consistent with the positive sentiment being expressed through various manufacturing surveys.
Previous: 0.6% Wells Fargo: 0.4% Consensus: 0.4% (Month-over-Month)
Housing Starts • Thursday
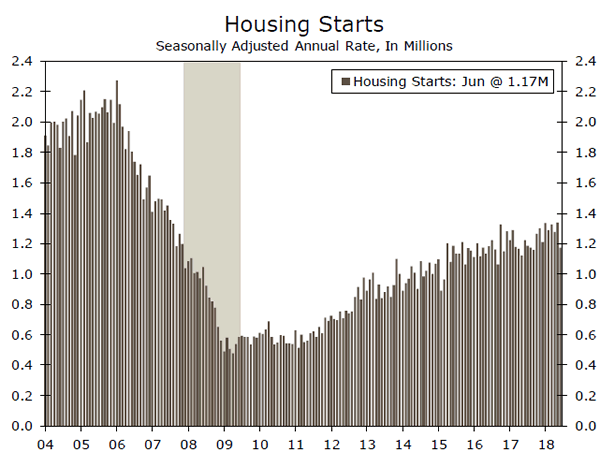
Housing starts declined 12.3 percent in June to a 1.173-million unit pace. Both single-family and multifamily starts fell. Given the continued tight supply of homes available for sale and fairly high levels of builder confidence, the recent weakness in housing starts is perplexing. Supply constraints may be at play. Higher input costs, such as lumber prices in light of tariffs on Canadian softwood lumber, are likely weighing on starts of lower priced homes, which do not have large enough profit margins to absorb increased costs. This may be adding to the continued drop in the share of consumers that feel now is a good time to buy a home, with the most often cited reason being the lack of affordable homes to choose from. Similarly, labor supply shortages may be weighing on builders' ability to start projects. Despite these headwinds, and the weakness exhibited in June, we expect stronger job and income growth to push home buying higher in the coming months.
Previous: 1.173M Wells Fargo: 1.249M Consensus: 1.273M
Global Review
Lackluster Growth in Some Foreign Economies in Q2
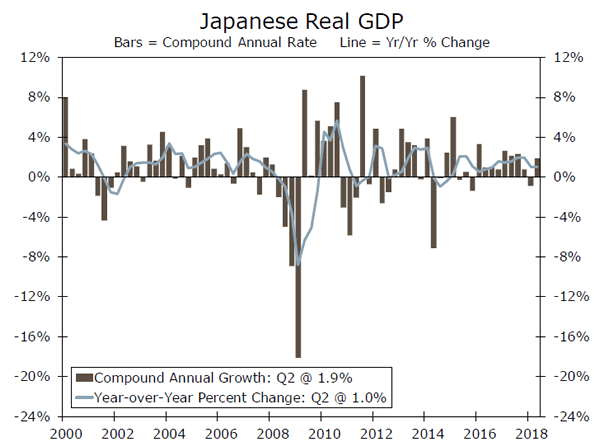
- Real GDP in Japan grew at an annualized rate of 1.9 percent in Q2, reversing the modest contraction that occurred in Q1. But inflation remains very low in Japan.
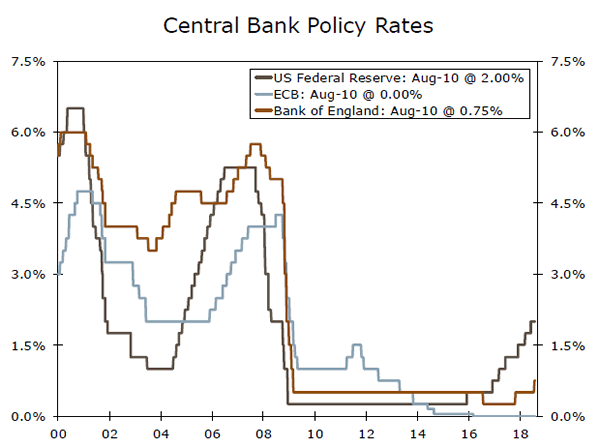
- The British economy has expanded only 1.3 percent over the past four quarters. Uncertainty related to the Brexit negotiations remains high, which will keep the Bank of England cautious as it slowly hikes rates.
- In contrast, the Canadian economy appears to have turned in a solid quarter in Q2. The unemployment rate is back to its cycle low, which should lead to another rate hike by the end of the year.
GDP Growth Rebounds in Japan in Q2
Incoming data show that real GDP continued to grow in most major foreign economies in the second quarter, if only at lackluster rates. In Japan, GDP grew at an annualized rate of 1.9 percent on a sequential basis (see chart on front page). Not only was the outturn a bit stronger than most analysts had expected, but it more than offset the 0.9 percent contraction that occurred in the first quarter. Moreover, growth in the individual components of domestic demand was reasonably solid, with private consumption expenditures rising 2.8 percent and private non-residential investment climbing 5.2 percent.
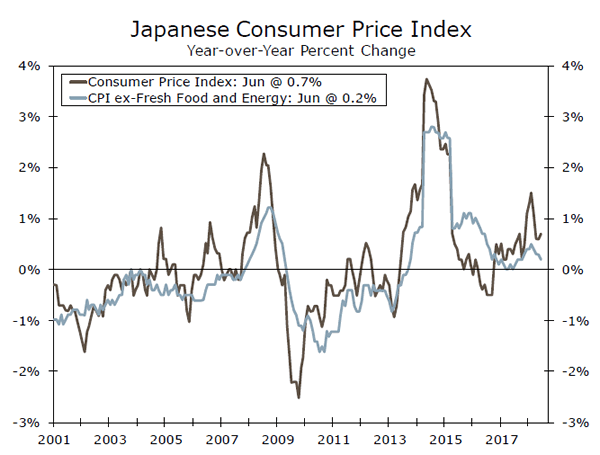
The GDP outturn undoubtedly led to a sigh of relief at the Bank of Japan, which has been trying for years, without much success, to engineer a higher rate of inflation in the Japanese economy. The rebound in GDP growth in the second quarter is welcome, but it will take sustained growth at a strong rate to lead to a meaningful rise in CPI inflation in Japan, which is currently running below 1 percent (top chart). Consequently, the Bank of Japan is not likely to start removing policy accommodation anytime soon, which should limit the degree of any appreciation of the Japanese yen that may occur in coming months.
U.K. Economy Continues to Grow at a Modest Pace
Real GDP in the United Kingdom grew 0.4 percent (1.5 percent at an annualized rate) on a sequential basis in the second quarter (middle chart). The outturn was a tad stronger than the anemic 0.9 percent annualized growth rate that was registered in Q1. Personal consumption expenditures continued to grind higher and business fixed investment spending, which tumbled in Q1, rebounded in the second quarter.
That said, the British economy has expanded just 1.3 percent over the past four quarters, which is barely above stall speed. As we describe in more detail in a report that was published today, uncertainty related to the Brexit negotiations remains the elephant in the room. (See "U.K. Mid-Year Economic Outlook," which is posted on our website.) A "hard" Brexit in March, should one occur, could potentially lead to further economic weakness. The Bank of England, which hiked rates 25 bps at its policy meeting last week, likely will proceed at a very slow pace until some of the uncertainty surrounding the U.K. economic outlook dissipates.
Canadian Economy Continues to Enjoy Solid Growth
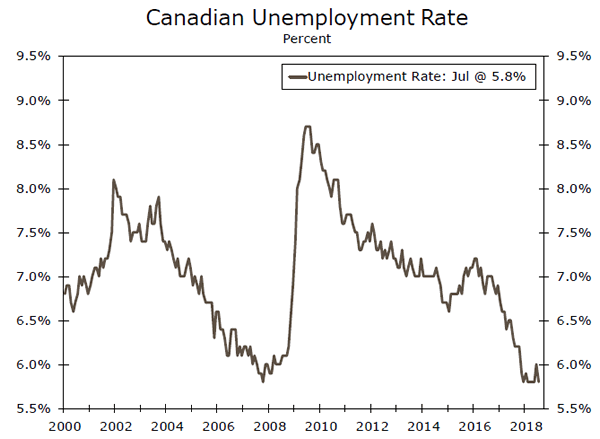
Canada will not release its Q2 GDP data until later this month, but monthly economic indicators suggest that the Canadian economy grew at a solid rate in the second quarter. Monthly GDP rose by 0.5 percent in May, which followed the 0.1 percent gain registered in April. And it appears that growth started Q3 at a decent clip as employment shot up by 54.1K individuals in July. Strong employment gains in recent months have returned the unemployment rate to its cycle low of 5.8 percent in July (bottom chart). The Bank of Canada has raised its policy rate 50 bps so far this year, and we look for it to tack on another 25 bps increase later this year.
Global Outlook
China Fixed Investment Spending • Monday
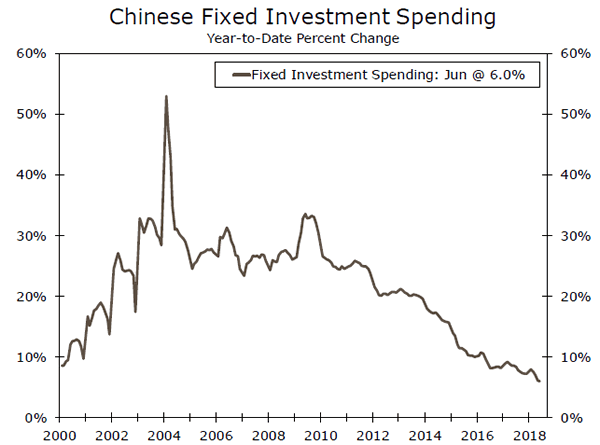
Growth in investment spending reached its lowest rate on record in June, rising just 6 percent year-over-year as the Chinese economy continues its transition toward a consumption-oriented economic model. The run-up in investment spending over the past decade also resulted in a highly-leveraged corporate sector, which along with the broader economic transition has restrained China's expansion. GDP growth decelerated slightly in Q2 to 6.7 percent year-over-year, and data on industrial production and retail sales also released on Monday should support the continued economic pivot. Although still at historically slow rates of growth, retail sales rebounded slightly in June, while industrial production growth continued its slowdown. Trade tensions have also reemerged this week as China and the U.S. imposed additional tariffs on each other's exports. Although trade uncertainty and structural factors are present, we look for overall economic growth to slow only modestly in the coming quarters.
Previous: 6.0% Consensus: 6.0% (Year-over-Year, Year to Date)
United Kingdom CPI • Wednesday
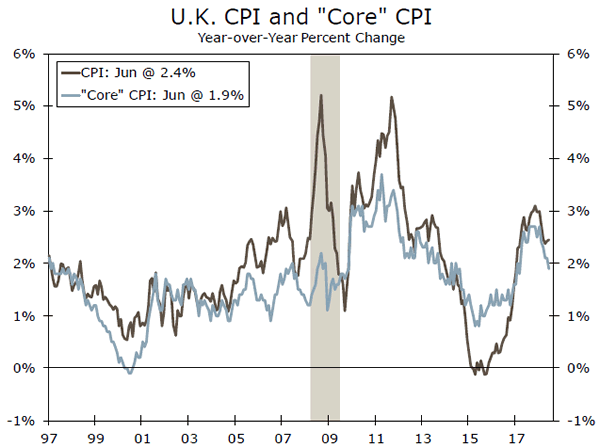
Inflation in the U.K. has trended lower after a sharp drop in sterling drove up import prices and pushed the CPI above 3 percent in the wake of the Brexit referendum in 2016. Consumer price inflation was 2.4 percent in June, and we look for it to decline further to 2.3 percent in July. Amid slowing inflation and only tepid economic growth in Q1, the Bank of England (BoE) hiked rates 25 bps at its meeting last week. The BoE looked for domestic price pressures to pick back up as Brexit-related distortions fade, and today's GDP print also showed that economic growth rebounded modestly in Q2, with real GDP growing 0.4 percent in the quarter. That said, Brexitrelated concerns have reemerged recently on whether the U.K. and the E.U. can reach an agreement on the future of their economic relationships by the March 2019 deadline. For now, we look for the BoE to tighten policy at a slow pace, given Brexit-related uncertainty and inflation that is already moving back toward target.
Previous: 2.4% Wells Fargo: 2.3% Consensus: 2.5% (Year-over-Year)
Canada CPI • Friday
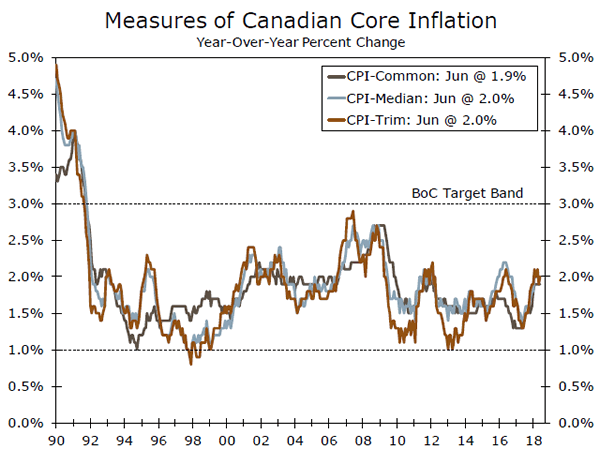
The CPI in Canada rose 2.5 percent year-over-year in June, and various measures of core consumer price inflation have firmed within the Bank of Canada's (BoC) target band in recent months. Monthly GDP growth has remained solid so far in April and May, putting overall Q2 GDP growth on track to surpass a 2 percent annualized pace. Firming inflation and solid economic growth led the BoC to hike its overnight lending rate 25 bps at its July meeting. But, in its accompanying statement, the BoC acknowledged rising trade concerns as a threat to its outlook. In terms of inflation, the Canadian dollar has weakened against the U.S. dollar in light of recent trade concerns, and new tariffs on U.S. imports should also push up prices in coming months. Rising external price pressures and an economy operating near full capacity support our forecast for the BoC to hike rates once more before the end of 2018.
Previous: 2.5% Wells Fargo: 2.6%
Point of View
Interest Rate Watch
Two Down, Two to Go, Right Charlie?
With two quarter-point rate hikes on the books for 2018 most analysts (ourselves included) expect the strong labor market and firming inflation to warrant two more rate hikes by the end of the year.
At an event in Chicago this week, that region's Fed President Charles Evans considered the path for the FOMC in the context of fiscal stimulus and a hot economy.
Second quarter GDP came in at a scorching 4.1 percent annualized rate and the July jobs report showed the unemployment rate dipping back below 4 percent. On the inflation side of the mandate, the Fed's preferred measure, the PCE deflator, puts prices up 2.2 percent on a year-over-year basis through June. The CPI index reports 2.9 percent price growth for the same period.
While he is not a voter this year, the comments from Chicago Fed President Evans may yet offer clues about a coming shift in policy guidance from the Fed.
A key consideration in that decision will likely be the natural rate of unemployment, or the jobless rate that could be sustained without putting upward pressure on prices.
In our view, the lack of substantive wage pressure in the current cycle warrants at least a degree of caution or skepticism in assigning too much emphasis on a given jobless rate as the magic number.
Former Fed Chair Janet Yellen often stressed that the unemployment rate was just one data point that needed to be considered in the broader context of the changing size of the labor force as well as levels of participation.
Based on our current forecast, we do not expect the 4.1 percent GDP growth rate in the second quarter to be repeated at any point in the foreseeable future. But we do anticipate further declines in the unemployment rate. Whether or not that translates into wage-push inflation will be the greater matter for consideration by the Fed. For now, we still anticipate two more rate hikes to finish the year with the fed funds rate at 2.50 percent.
Credit Market Insights
Sluggish Revolving Credit Growth
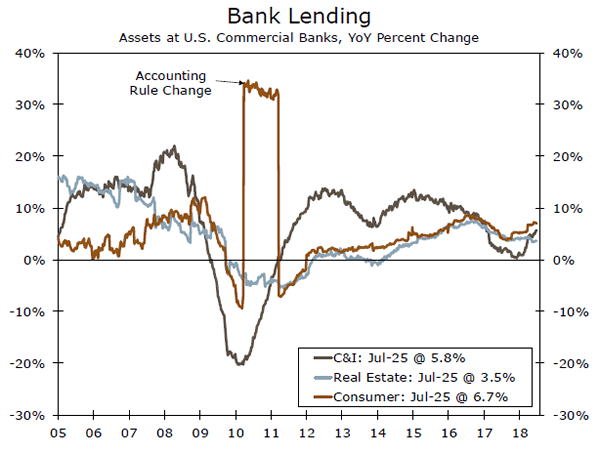
Consumer credit rose $10.2 billion in June, slowing from an increase of $24.3 billion in May. Much of the moderation came in revolving credit, which consists mostly of credit cards. Revolving credit declined 0.2 percent after increasing 11.2 percent in May. This turnaround from May puts revolving credit growth back on the softer trend seen through the first few months of the year. Even including May's large gain, 2018 has seen the slowest first-half for revolving credit since 2013.
Credit growth can be a helpful proxy for consumers' willingness to spend. Thus, the pullback could be concerning if it is the result of slower consumption in the face of higher interest rates, but retail sales and personal consumption were up solidly in Q2. Another explanation is that tax cuts and improving income prospects may be pushing down consumers' need to borrow.
Looking at other forms of borrowing, nonrevolving credit, which includes student loans and car loans, has maintained a solid pace over the past few months and is up 4.4 percent since June of last year. Mortgage debt, which makes up the majority of household debt but is not included in the consumer credit report, was up a solid 3.9 percent in Q1 year-over-year.
Overall consumer spending looks to be in fairly good shape. Going forward, we expect disposable income growth to continue to strengthen and for spending to follow suit.
Topic of the Week
Tax Reform 2.0: The Sequel
The Tax Cuts and Jobs Act (TCJA) enacted into law at the end of last year was a significant change in U.S. policy that led to material changes in the economic outlook. Recently, talk in Washington, D.C. has begun to swirl about a potential "Tax Reform 2.0". On July 24, Republican members of the House Ways and Means Committee circulated a two-page memo listing some high-level goals for Tax Reform 2.0. Given the impact the TCJA has had on the economy and financial markets, what are the implications of a possible tax reform sequel?
For now, details remain sparse. In short, however, most of the proposed changes in a possible tax reform encore are likely to be marginal rather than wholesale changes. The most ambitious aspect of the loosely outlined proposal is to make the individual tax cuts enacted last year permanent; at present, most of these cuts are scheduled to expire at the end of 2025. While we are skeptical this would be included in any final plan, were it to occur, there would likely be minimal short-run economic impact due to the back-loaded nature of the cuts. The long-run fiscal deterioration would be fairly large, however, and a more ominous debt outlook could cause long-term interest rates to rise a bit further.
Beyond this potential change, most of Tax Reform 2.0's goals, such as expanding how 529 education accounts can be used or allowing families to access retirement accounts penalty-free when having a child, are unlikely to have a major macroeconomic impact in the context of the $20 trillion U.S. economy. In addition, the political calculus for passing a bill before the midterm elections in November looks a bit vexing, and a tight legislative calendar will likely be a second major hurdle. Thus, while tax reform 2.0 might come and go in the headlines over the coming months, we believe its near-term macroeconomic impact, should it become reality, would be far less significant than its predecessor.
Dollar Higher as Risk Appetite Vanishes
The US dollar appreciated versus most major pairs on Friday. The Japanese yen outperformed the greenback as a safe haven, but all other major currencies suffered heavy losses during the week. Tense trade developments between China and the US and Friday’s drop in the Turkish lira dragged emerging and developed markets lower as US sanctions were doubled. Geopolitics drowned out most of the impact of economic releases with US inflation hitting a new high and Canadian part time jobs driving a drop in the unemployment rate.
- Turkish lira fell more than 20 percent in a week
- US retail sales to remain subdued
- UK retail sales to show more evidence of solid summer
European Bank Exposure to Turkey Hits EUR
The EUR/USD lost 1.2 percent in the last five days. The single currency is trading at 1.1398, with the pair looking to fall further after breaking through the 1.14 barrier. The economic calendar does not feature major events in Europe and with current geopolitical tension the single currency remains vulnerable against the safe haven dollar.
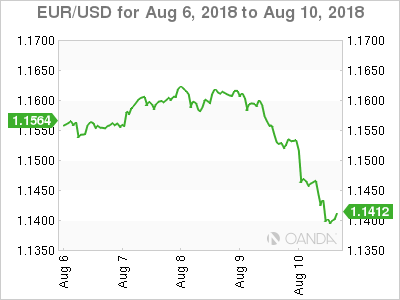
US inflation is 2.94 percent, and with core inflation is back to 2008 levels at 2.4 percent the case for two more rate hikes by the U.S. Federal Reserve this year remains strong. The monetary policy divergence between the European Central Bank (ECB) and the U.S. Federal Reserve has been a factor, but remains in the background as geopolitical forces have proven to have a bigger impact in 2018.
Italian, Spanish and French banks are reported to have loans worth $150 billion in Turkey. The falling Turkish lira will make those loans denominated in foreign currency harder to repay which is why the EUR has touched record lows on Friday. The European stock market has already witnessed a sell off of financial institutions.
Turkey President Erdogan was defiant and called for the population to defend the currency by selling their US dollars and gold holdings instead of trying to open a dialogue with the US regarding steel tariffs.
Loonie Grounded Despite Strong Jobs Report
The USD/CAD gained 0.77 percent during the week. The Canadian dollar is lower on Friday. The USD/CAD is trading at 1.3145. Statistics Canada released a stronger than expected employment report with a huge gain of 54,100 jobs driving the unemployment rate down to 5.8 percent in July. The loonie failed to gain momentum from that economic indicator release given the current geopolitical climate.
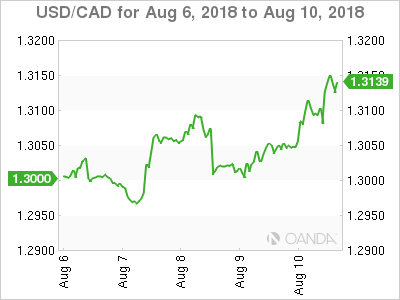
A flight to safety from investors has given a boost to traditional safe havens like the JPY, CHF, USD and gold. The Turkish lira has been in free fall and has triggered contagion fears as Spain, Italy and France have high exposures.
The strong jobs report adds to the probability the Bank of Canada (BoC) will hike the benchmark interest rate one more time in 2018. The BoC raised its overnight target rate to 1.50 percent on July 11 with the growth of the economy picking up for a follow up rate hike in October.
The Canadian currency was lifted by the solid jobs report, but not enough to send the loonie into the black on Friday. The indicator comes during a tense trading environment where risk appetite is subdued.
Pound Lower on Brexit Despite Strong GDP Numbers
The GBP/USD lost 1.64 percent in the last five days. The currency pair is trading at 1.2755 near a one year low after no deal Brexit probabilities rose. The divorce negotiations between the UK and the EU have been short on positives with an 8 month period to sort out a lot of tough negotiations.
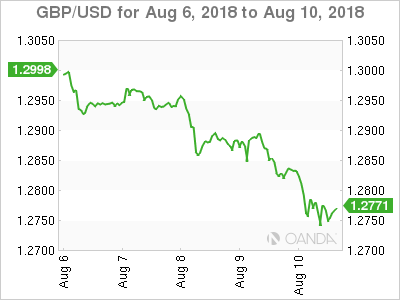
The market has priced in the scenario of the UK exiting the single market with no trade deal in place. The ball is back on the government of Theresa May to come up with a package that not only satisfies supporters at home, but more importantly is acceptable for the EU. So far that balancing act has not been achieved and has put the leadership of Theresa May into question with an almost imminent vote of confidence in the near term.
The decision of the Bank of England (BoE) to lift rates last week was unanimous, but it could end up being the only pro-active decision by the central bank in 2018 as it heads into reactive territory.
Yen Keeps Up With Dollar in Turbulent Times
The USD/JPY lost 0.51 percent during the last five trading sessions. The currency pair is trading at 110.59. The Japanese currency has appreciated but it has done so less than other times of uncertainty in the market. The use of economic sanctions by the Trump administration was a recurring theme this week causing high volatility in emerging markets.
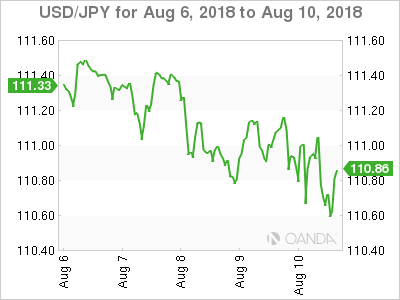
The JPY continues to trade in a tight range despite the global uncertainty but the safe haven appeal of the currency has set it apart from other Asian currencies that have depreciated as trade war concerns rise.
Market events to watch this week:
Tuesday, August 14
- 4:30am GBP Average Earnings Index 3m/y
- 9:30pm AUD Wage Price Index q/q
Wednesday, August 15
- 4:30am GBP CPI y/y
- 8:30am USD Core Retail Sales m/m
- 8:30am USD Retail Sales m/m
- 10:30am USD Crude Oil Inventories
- 9:30pm AUD Employment Change
Thursday, August 16
- 4:30am GBP Retail Sales m/m
- 8:30am USD Building Permits
- 7:30pm AUD RBA Gov Lowe Speaks
Friday, August 17
- 8:30am CAD CPI m/m
*All times EDT
The Weekly Bottom Line: Canada – Another Rate Hike on the Way
U.S. Highlights
- Global equity markets were hit Friday by fears that Turkey's deepening economic crisis will spread. The Turkish lira plummeted as investors have lost confidence that the Erdogan regime will be able to steer Turkey through its current crisis.
- Meanwhile, U.S. inflation continued its gradual rise in July. Notably core CPI inflation reached a new cycle high of 2.4%.
- Economic conditions in the U.S. argue for a rate hike in September, and Turkey-related turmoil seems unlikely to derail that.
Canadian Highlights
- This week's jobs report delivered a mixed message, with rosy, above-expectation gains in the headline print, accompanied by declines in full-time work.
- Housing starts came in below expectations, falling to 206k in July, but maintaining a healthy underlying trend
- A Canada-Saudi Arabia diplomatic spat briefly caught the attention of the markets in an otherwise quiet week.
U.S. - Turkish Lira Rout Hits Markets
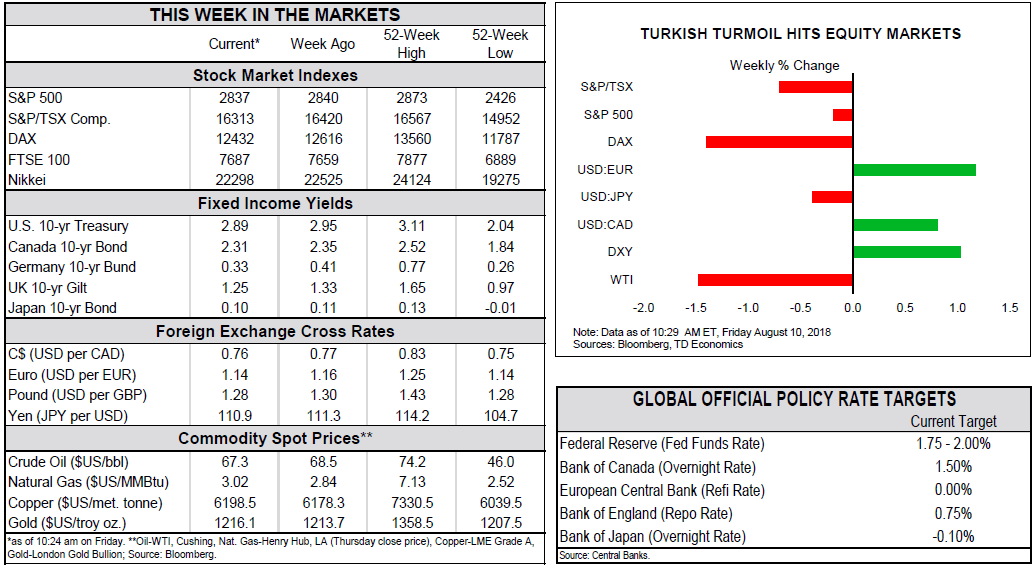
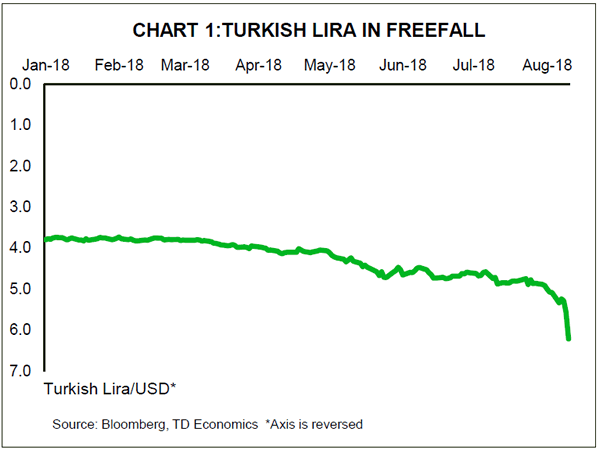
Global equity markets were hit Friday by fears that Turkey's deepening economic crisis will spread. The Turkish lira fell 16% (Chart 1) as investors have lost what little confidence they had that the Erdogan regime will be able to steer Turkey through its current crisis. Turkey has substantial foreign-currency-denominated debts, and low foreign currency reserves – a classic recipe for speculative attack. Worries intensified as tensions between Turkey and the White House run high. As Turkey's finance minister was giving a speech, President Trump tweeted that he plans to double steel and aluminum tariffs on the country.
The key worry is the degree of contagion to other countries. Turkey has significant trade and banking ties with Europe, but not sufficient to fuel a contagion effect. Still, the lira rout has hit European bank shares with exposure to the country, and banking authorities are on high alert.
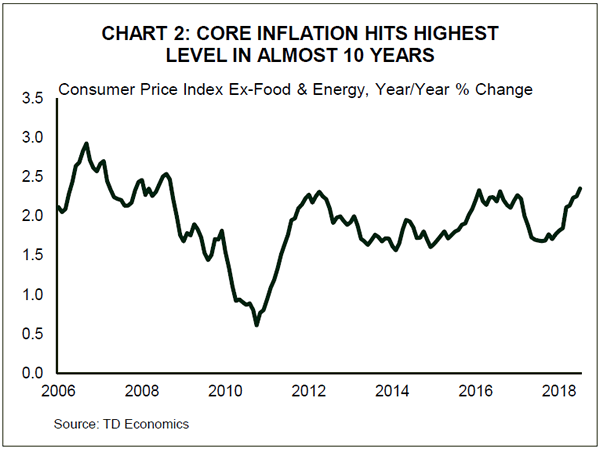
For the U.S. economy, attention was focused on consumers and producer prices for July. Overall, the story is that inflation continues its gradual march upwards. Core consumer price inflation hit a new cyclical high in July, up 2.4% year/year (Chart 2). Price pressures picked up for both core goods (+0.1% m/m) and core services (+0.3% m/m). A 25% tariff on $34 bn worth of Chinese imports came into effect early in the month, and so the data was closely watched for early tariff impacts, which would most likely show up in prices for core goods. Deflation in core goods at the consumer level has been waning for some time, and growth is now flat on a year-on-year basis. At the producer level, inflation has been much higher for a while now. While companies can absorb some of this in their margins, we do expect price increases to increasingly be passed on to the consumer, boosting inflation.
The Fed's task will be to disentangle how much of this is thanks to tariffs, and how much is due to a hot economy. In the July PPI, prices were up for categories that likely contain products from China subject to new import tariffs, so we are likely already seeing some impact. But these prices have been rising for some months, suggesting an upward trend was in place pre-tariffs.
At the end of the day, services prices carry a far greater weight in the CPI (62%), and inflation for core services has been building steadily. Shelter costs have been particularly hot, up 3.5% year/year in July, and carry a heavy weight in the CPI basket (about 1/3 of the total). Inflation pressures have been strong for both rent (+3.6% y/y) and owners' equivalent rent (+3.4% y/y). Transportation services inflation has also been hot, up 4% year/year. Even services categories with below average inflation have seen momentum building in recent months.
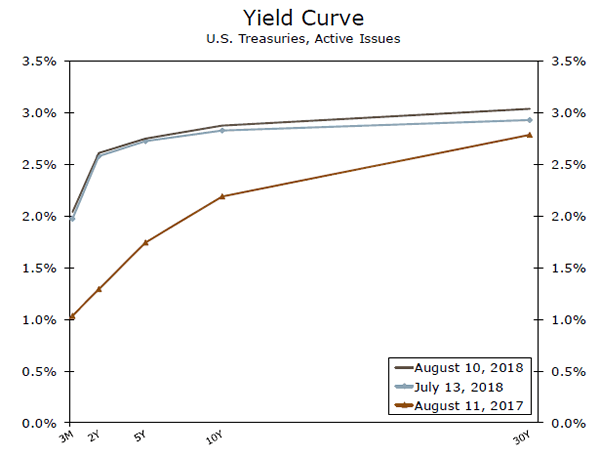
These price pressures justify FOMC rate increases in the months ahead. So far, Turkey-related market volatility seems unlikely to delay a September hike. Looking into 2019, however, if we don't start to see some move upward in longer-term yields, Fed hikes may be jeopardy, given the Fed's desire not to cause an inversion of the yield curve.
Canada - Another Rate Hike on the Way
Following last week's blockbuster GDP and trade surprises, this week's economic data releases had a high bar to jump over to maintain momentum. The data this week, while mixed, did little to change the story of a healthy economy operating near full capacity. As we discuss in the latest Dollars and Sense, with continued strong economic performance, the pieces are in place for the Bank of Canada to raise the overnight rate in October.
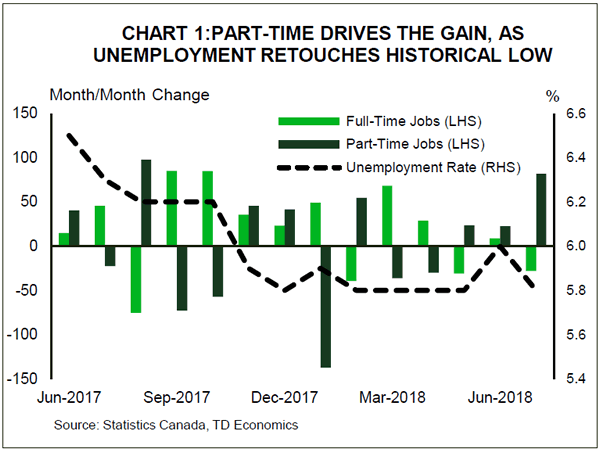
Today's jobs report is relatively immaterial on a standalone basis (given the usual noise), but still adds some credence to existing optimism, showing solid employment gains and painting a healthy picture of the labour force. The economy added 54k jobs in July, with the unemployment rate falling to 5.8% – a very healthy number relative to historical standards.
One area of concern is the quality of job gains, where the headline gain was driven mostly by part-time hiring (+82k), leaving full-time employment down 28k jobs on the month. While wages posted increases, growth decelerated relative to prior months, which may be attributable to the part-time nature of the jobs gained. Additionally, the job gains were relatively concentrated, with public sector hiring driving most of the gains. Nevertheless, we would chalk most of this up to monthly noise. On a yearly basis, full-time jobs still make up the majority of job gains, solidifying the overall healthy labour market picture.
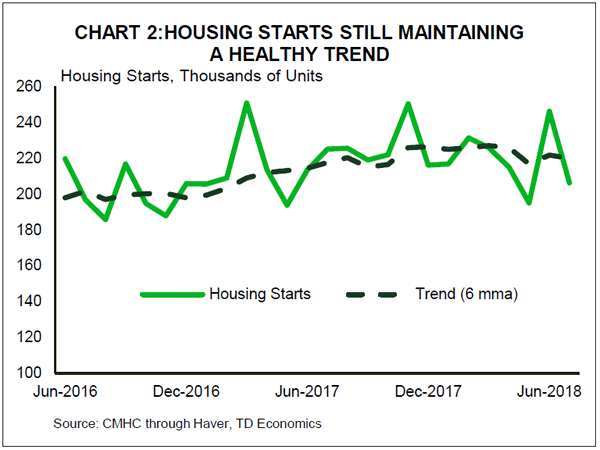
Housing starts, meanwhile, fell to 206k units (annualized) from last month's notable 246k pace. This decline was led by the multifamily category, particularly in Toronto and Montreal, which surged in the prior month. Given the volatile nature of the monthly series, the underlying trend (6-month moving average), at 220k, offers a clearer picture of what is still a healthy market, still trending above demographic fundamentals.
With continued monetary policy tightening on the horizon and increased macroprudential regulations, the expectation is that housing will continue to slow, albeit gradually. Price pressures are also starting to manifest, with Statistics Canada citing the impact of rising lumber prices on its New Housing Price Index (NHPI) measure, which moved up 0.1% on the month in June. Together with steel and aluminum tariffs, these may add some pressure on construction costs, but given solid permit issuance and an otherwise healthy economy, the impact should be limited.
Aside from data releases, the relatively quiet week for financial markets was interrupted by the escalation of a Canadian-Saudi diplomatic spat that started over the weekend. Markets initially reacted negatively, with the S&P/TSX and the Canadian dollar falling slightly, but reversing those losses thereafter and returning to positive territory. The impact of the fallout isn't expected to be large given the relatively insignificant size of trade between the two countries, and the reassurance of continued oil shipments.
Canada: Upcoming Key Economic Releases
Canadian Manufacturing Sales - June
Release Date: August 16, 2018
Previous: 1.4%
TD Forecast: 1.1%
Consensus: 1.1%
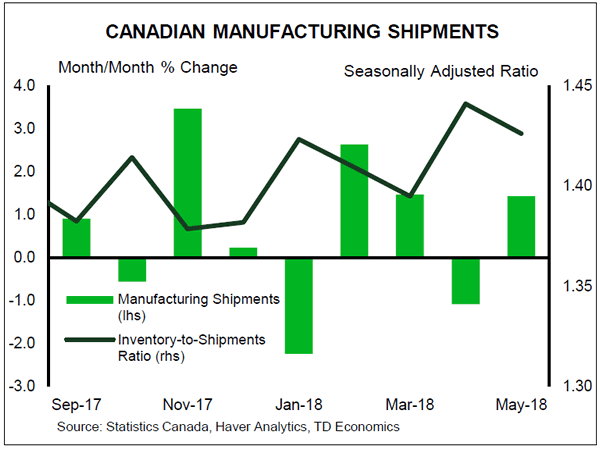
TD looks for manufacturing sales to post a 1.1% m/m increase in June on a rebound in auto production after supply chain disruptions weighed on the prior month. Primary metals will provide a modest offset on recently imposed steel and aluminum tariffs, which saw exports fall by roughly $200m (nsa) in June, while nondurables should be led by strong petroleum sales as presaged by a rebound in exports. Elsewhere, business surveys continue to indicate robust manufacturing conditions with Markit PMI posting a new record high in June. However, rising factory prices will see real manufacturing sales post a more modest advance of roughly 0.5% m/m.
Canadian Consumer Price Index - July
Release Date: August 17, 2018
Previous: 0.1% m/m, 2.5% y/y
TD Forecast: 0.0% m/m nsa, 2.5% y/y, Index: 133.6
Consensus: 0.0% m/m nsa, 2.5% y/y, Index: 133.6
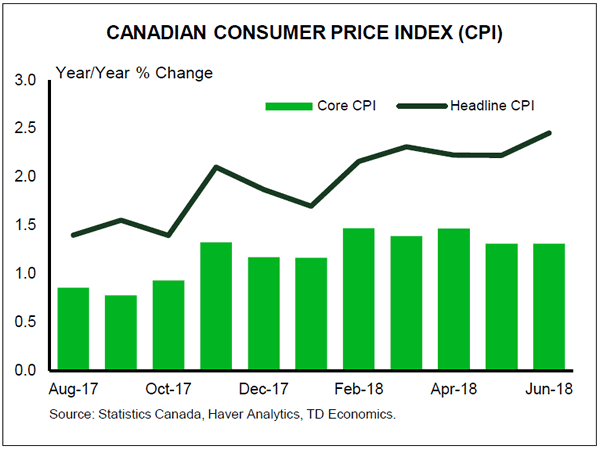
We expect headline CPI to hold at 2.5% y/y in July, with prices flat on the month (0.3% seasonally adjusted). Gasoline prices rose on the month while warmer than normal temperatures suggest energy services could see a boost as well. Currency depreciation (-3% cumulative since April) along with tariffs imposed on the US on July 1 suggest firmer price pressures for categories such as food at home, appliances and personal care products. The tariffs, however, impact just 3% of merchandise imports, and we expect impacts to feed through at a lag. We expect to see the gap between exclusion-based core indexes (CPIX and CPIXFE) and BoC core measures to narrow with this report, with the latter staying near 2.0% on average and the former moving marginally higher. Looking ahead, July CPI likely marks the peak this year, as we continue to expect a moderation toward 2% through year end.
Turkey: Erdogan Chooses the Confrontation Path – TRY Collapses
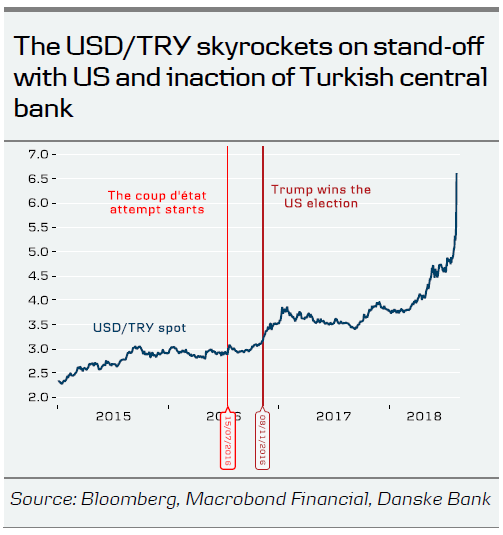
- The Turkish lira hit an all-time low as USD/TRY jumped almost 23.4% today following a speech by the President Recep Tayyip Erdoğan, where he spooked investors by choosing to continue his path of confrontation with the US and calling for Turks to hand in their US dollar and gold holdings.
- Shortly after, TRY's turmoil deepened on President Donald Trump's tweet, which mentioned doubling of tariffs on metals, citing bad relations with Turkey.
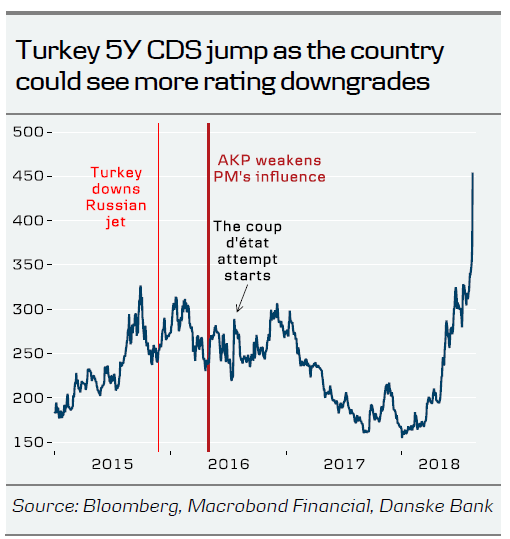
- Erdoğan's speech contained no hint of hikes by the Turkish central bank (TCMB). While we do not fully exclude an option of a massive hike by the TCMB, we believe that probability of capital controls has greatly increased.
- We do not exclude the possibility that Erdoğan could revert for financial support to Russia.
Assessment and outlook
The Turkish lira saw its own Black Friday as markets became more disappointed on President Erdoğan's speech at a rally. The speech was long-expected, and the disappointment amplified the move in the USD/TRY pair. Our wrap-up from the speech:
- The President's major lines remain unchanged: no rate hikes were hinted at.
- Erdoğan urged citizens to save the TRY by bringing EUR, USD, gold to the banks.
- Erdoğan said nothing about the imprisoned American pastor. That hits investors' hopes of a geopolitical de-escalation in Turkey-US relations.
A nail in the TRY's coffin came from the US, as Trump tweeted: 'I have just authorized a doubling of Tariffs on Steel and Aluminium with respect to Turkey as their currency, the Turkish Lira, slides rapidly downward against our very strong Dollar! Aluminium will now be 20% and Steel 50%. Our relations with Turkey are not good at this time!'
We will wait for the announcement of Turkey's new five-year economic programme, which should be released in three weeks. In the meanwhile we emphasise that the risk of capital controls has increased on Erdoğan's reluctance to support rate hikes by the TCMB and that these controls could be considered over the weekend or next week.
Later on Friday 8 August, reports came about Erdoğan's talks with President Vladimir Putin on economic ties. As we mentioned earlier in our previous piece on the TRY, we see the possibility that Turkey could get FX funding from Russia. However, upcoming US sanctions against Russia bring more uncertainty.
Australia & New Zealand Weekly: RBA Lowers Inflation Forecasts to Reflect “One-off” Effects
Week beginning 13 August 2018
- RBA lowers inflation forecasts to reflect "one-off" effects.
- RBA: RBA Governor Lowe Semiannual Testimony, Assistant Governor Ellis speaks.
- Australia: Westpac-MI Consumer Sentiment, wage price index, employment, NAB business survey.
- NZ: REINZ house prices and sales.
- China: retail sales, fixed asset investment, industrial production.
- US: retail sales.
- Key economic & financial forecasts.
Information contained in this report current as at 10 August 2018.
RBA lowers inflation forecasts to reflect "one-off" effects
The Reserve Bank's August Statement on Monetary Policy provides few surprises.
Of most interest in the Statement is the update in the Bank's forecasts. In particular, this update includes another six months of forecasts to cover the whole of 2020.
The GDP growth rate forecasts through to end 2018 and end 2019 are unchanged from the May Statement at 3 ¼ per cent, while the 3 per cent forecast for growth through to June 2020 is extended to December 2020. The forecast slowdown between 2019 and 2020 is attributed to a flat contribution from LNG exports as production capacity peaks in 2019.
Growth to June 2018 is forecast at 3 per cent compared to 2 ¾ per cent in May. This forecast implies that the Bank is expecting the GDP print for the June quarter to be an optimistic 1.0%, following the 1.0% which was registered for the March quarter. In contrast, Westpac is expecting 0.6% for the June quarter growth rate.
The significant change from May comes with the inflation forecasts. Headline inflation to December 2018 has been revised down from 2 ¼ per cent to 1 ¾ per cent. Underlying inflation to December 2018 has been revised down from 2 per cent to 1 ¾ per cent. If those forecasts prove correct, then 2018 will be the fifth consecutive calendar year in which headline inflation has printed below the bottom of the 2-3% target band and the third consecutive year when underlying inflation has been the below the bottom of the band.
The Bank attributes this revision to changes in the September quarter, specifically for electricity, childcare costs and some education costs. They are claimed to be one-off and do not affect any subsequent quarters. Consequently, the forecasts for the year ending December 2019 are unchanged at 2 ¼ per cent (headline) and 2 per cent (underlying). The modest forecast lift in underlying inflation to 2 ¼ per cent to June 2020 which we saw in the May statement is extended to December 2020, with both headline and underlying forecast at 2 ¼ per cent.
There are no changes to the unemployment profile with the rate expected to be 5 ½ per cent in December 2018, 5 ¼ per cent in December 2019 and a projected fall from 5 ¼ per cent in June 2020 to 5 per cent in December 2020.
Commentary in the Statement around the growth and inflation outlook is largely unchanged from May. Consumer spending continues to be a source of "significant uncertainty" largely because of the outlook for household income growth. Key components here are wages growth and employment growth. The Bank does not provide specific forecasts for these variables, although employment growth is expected to be slightly above working age population growth of 1.6%.
Last week, I pointed out the deterioration in employment growth around the last two Federal election periods (2013 and 2016). With another election due by May next year, the risk of an unexpected slowdown in employment growth must be quite real although the Bank does not consider that prospect as part of the risks outlined in the Statement.
We are also not given the Bank's forecasts for wages growth. The persistence of the unemployment rate being forecast to be above the full employment rate of 5 per cent would indicate little expected wage pressures. The Bank does identify uncertainty around the level of spare capacity in the labour market and seems to rely on its liaison program and evidence of tight conditions in construction and information technology. It is interesting to observe that the Government's forecasts which were included in the May Federal Budget, and entailed a similar profile for the unemployment rate, expect wages growth of 3 ¼ per cent in 2019/20 and 3 ½ per cent in 2020/21. Prospects for such an optimistic outcome for wages growth seem remote, particularly as the Bank observes that current new enterprise bargaining agreements are lower than the average of those currently in existence.
The reason why the outlook for household incomes is so important is that with a very low savings rate; high debt levels; and falling house prices; it seems unlikely that household consumption can grow at a faster pace than incomes in the way we have seen in recent years.
These risks around a negative wealth effect are down played in the commentary. Various spokesmen for the Bank have indicated that while empirical estimates of the wealth effect are quite dated, the view is that the negative wealth effect in this upcoming cycle will be modest. The Statement notes that "there is no evidence that moderate house price declines have weighed on household consumption to date". However, appropriately, some concern is raised around the consumption of highly indebted and or credit constrained households.
The Statement rightly acknowledges the recent solid growth in non-mining business investment which reached 10% over the year to the March quarter, largely driven by non-residential construction. While approvals in this sector are falling, the Bank's expectation is that growth in machinery and equipment investment will pick up further over the forecast period. These investment decisions will be significantly influenced by expected demand and therefore the household consumption profile, making the debate around incomes important not only for consumption itself but also business investment. Those risks around political uncertainty are also relevant for business confidence and investment.
Public demand and exports remain the bright side of the growth outlook. We acknowledge that this boost is likely to continue and has spill-over effects to private sector investment. It is also true that resources export growth will be sustained although iron ore and coal volume growth will be relatively flat and compensated for by the ongoing boost in LNG at least out to end 2019.
Conclusion
The Bank's approach, consistent with the May Statement, and many preceding statements, is to anticipate a gradual return to "normal conditions". The spectre of the persistent underperformance of inflation over multiple years must be unnerving. Nevertheless this gradual return to normality remains the theme. From our perspective weak wages growth; a slowdown in employment growth; and potential negative wealth effects loom as more significant risks to these forecasts than the Bank appears to be prepared to accept at least in the Statement.
Westpac expects growth in the key policy year of 2019 to be only 2.5% compared to the 3 ¼ per cent anticipated by the RBA. We see larger risks around the household sector; negative wealth effects from the housing market; and share the RBA's unease around the outlook for risks in China.
There is a clear sense that there is no particular urgency to change the policy stance and a forecast of 2 ¼ per cent underlying inflation and 5 per cent unemployment in 2020 certainly confirms that view.
We see no reason based on the Statement and the forecasts to change our view that the cash rate will remain on hold through the remainder of 2018 and 2019.
The week that was
A quiet week for data globally has drawn attention to central banking in the antipodes, as both the RBA (see essay) and RBNZ meet and updated guidance.
The tone of the RBNZ's August communications was a stark contrast to the RBA's optimism. For the past year, our NZ economics team has been warning that GDP growth would materially disappoint the bullish expectations of the RBNZ and NZ Treasury. As highlighted by NZ Chief Economist Dominick Stephens and more fully by the team, the RBNZ has now come to this realisation. Indeed, they have gone much further, projecting that the OCR will remain flat until September 2020 versus Westpac's long-standing view that a first hike will come at end-2019. This abrupt shift by the RBNZ implies that risks to Westpac's view are now skewed towards an even later start for rate hikes. In assessing these risks, a key barometer will be the Q2 GDP outcome.
This week the Sydney team has released a number of pieces of new research.
On the topic of the moment for Australian markets, shortterm wholesale funding, comes a real economy perspective. Specifically we assess how the abrupt deceleration in deposit growth is affecting these markets. Apparent to us is that Australia's national income has gone through a protracted period of weakness. The consequence for corporates has been a need to carefully manage costs, particularly wage inflation. Deposit growth for corporates and households has therefore come under significant pressure. For household deposit growth, an additional negative as we look ahead is an end to the support that has come from strong price gains and high turnover in the housing market. The switch to principal & interest payments and rise in investor interest costs at a time of weak income growth creates yet more downside risk for deposit growth in the sector. The more that deposit growth underperforms credit, the greater the need for wholesale funding by the banks. This situation is likely to create sustained upward pressure on short-term wholesale funding rates into 2019, absent an increase in the supply of funds to this market.
Contained in our August Market Outlook are a number of other pieces of note. Firstly on inflation, we highlight that headline inflation is likely to move below the bottom of the RBA's 2–3% inflation target band as electricity prices ease from elevated levels, and in the absence of any up and coming inflation pressures. This situation is expected to persist through 2019, with core inflation circa 2.0%yr forecast. Non-mining infrastructure investment is also in the spotlight in this edition. Spearheaded by public transport projects and private electricity generation, activity in this sector has directly added 0.75ppts to activity over the past 12 months. Importantly, supported by strong population growth and given a long period of under investment, this upswing has a lot further to run.
On the global scene, the August Market Outlook also highlights the strength of the US economy, which is set to justify four hikes by the FOMC to June 2019, but equally the risks thereafter. Despite very strong employment growth and a much-improved financial position, US consumers are hesitant to spend. Indeed, in 2018-to-date, they have actually throttled back on discretionary consumption and reduced housing investment. Also a clear risk to aggregate growth is business investment. So far trade tensions have offset the would-havebeen benefit of President Trump's stimulus. But, if uncertainty persists, then investment could become an outright negative for the US economy.
Finally on China, Westpac Economics and Strategy have released an update to our 2018 and 2019 view for China, covering the real economy, policy and financial markets. We started this year with a sub-consensus view that growth would slow materially, to 6.3% in 2018 and 6.1% in 2019. Based on the 6-month annualised pace to June of 6.4%, our beginning of the year forecast looks to be on the mark. Weak investment by State Owned Enterprises and local government authorities has been key to this outcome, coming as a result of a government mandated wholesale change in credit supply and authorities' related pursuit of high-quality growth and long-term prosperity. Amid growing trade tensions, authorities are starting to take a more active approach to policy to make sure that the deceleration in activity does not go too far. Note though this stimulus' marginal nature. Hence we remain comfortable with a further deceleration to 6.1%yr in 2019.
If trade tensions intensify, a sub-6.0%yr growth pace could even be seen in 2019 absent additional fiscal support. On trade tensions, this week China implemented 25% tariffs on $16bn of US goods effective August 23, matching the scale of 2nd tranche of tariffs imposed by the US. China had flagged their response in advance, but removed crude oil from the original list of 114 products and consequently had to expand the final list to 333 products including coal, medical and steel products.
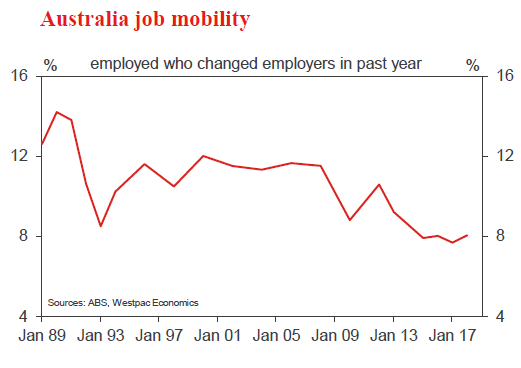
Chart of the week: Australia job mobility
The annual job mobility data was released this week and continues to point to low mobility. The chart to the right shows the share of employed who switched employers in a given year.
The same series was used in a Governor Lowe speech in 2017. Back then, he had this to say: "One related aspect of the current labour market is a decline in job mobility. Data published by the ABS suggest that the share of employed people changing employers is around the lowest in recent decades. It is likely that in an environment of less job security, fewer people are inclined to switch employers. There is also a demand-side effect, with fewer firms attempting to attract workers from other firms. This is consistent with subdued wage growth."
Since then we have received the 2017 and 2018 updates which continue to show mobility around its lows. It would appear that high vacancies and reportedly high difficulty finding skilled workers has not seen employers bid for already employed labour.
New Zealand: week ahead & data wrap
Snap back to reality
As expected, the Reserve Bank repeated its line that the OCR will stay low for an extended period and that the next move could be up or down. However, the RBNZ's interest rate projections and some subsequent comments have made clear the extent to which the 'down' scenario is a real prospect. We're taking seriously the possibility of a rate cut within the next year, and we think that financial markets should too. However, we expect that some better-than-expected economic data will stay the RBNZ's hand in the near term.
The August Monetary Policy Statement shifted broadly in the direction that we expected. We were saying at the start of this year that the RBNZ's growth forecasts were too optimistic, and that as they came to realise this they would shift to a more dovish stance. This has now come to pass. At the time, financial markets and many forecasters were still predicting OCR hikes this year; the centre of gravity has now shifted towards a much later move.
However, the RBNZ has shifted its assessment even further than we expected. Their updated projection for the OCR is flat until September 2020, a year later than in the May MPS. From there, the next projected move is up, but at a very gradual pace.
At face value, the RBNZ's assessment of the economy certainly wasn't ringing alarm bells. The RBNZ is forecasting growth to accelerate again after a recent slowdown, supported by low interest rates, increased government spending and a rebound in export volumes. The Kiwibuild programme will help to boost construction activity, although the RBNZ has adopted the Treasury's view that Kiwibuild will ramp up more slowly than previously expected. Above-potential growth would lead to greater capacity pressures and a lift in wage and price inflation.
The most substantial change compared to the May MPS was a cut to the GDP growth forecasts for the rest of this year, reflecting the softness in business confidence and other recent indicators. However, this slowdown was regarded as temporary.
The risk scenarios in the MPS were more revealing. On the one hand, the possibility of a faster than expected pickup in inflation would ultimately require higher interest rates than otherwise. But even then it wouldn't require a sharp response, as it would actually serve to get the RBNZ closer to its inflation target.
On the other hand, the downside scenario considered a slower pickup in GDP growth (though still accelerating from its recent pace). A slower than expected pickup in activity could see the RBNZ fall short on both its inflation and employment goals, and would warrant a substantially lower OCR.
The potential for a cut was reinforced in a later interview with the RBNZ's Assistant Governor McDermott, who commented that "we've been pushed nearer to that trigger point". McDermott went on to highlight that the RBNZ will need to see a lift in GDP growth in the September quarter (when increased fiscal stimulus should start to come through) to be convinced that it is on the right track.
These comments suggest that the risk of an OCR cut is real, but not imminent. September quarter GDP isn't published until late December, though there will be some indicators out in time for the November MPS.
Moreover, our view is that the RBNZ won't have to wait that long for some reassurance. The RBNZ expects June quarter GDP to rise by 0.5%; the information that we have to date suggests an outturn closer to 1%. Of course, quarterly GDP outturns can be volatile – we think that the 0.5% rise in the March quarter probably understated the underlying pace of growth, and that the June quarter will almost certainly overstate the case. But there are some genuine positives in there as well. For instance, last week's labour market surveys showed a surprisingly strong lift in employment and hours worked in the June quarter.
Perhaps less significantly, we're also expecting the next inflation print to top the RBNZ's forecast. The RBNZ is expecting a 0.4% rise in September quarter prices, with a particularly soft result for tradable goods prices. We're expecting a 0.7% rise for the quarter, with fuel prices set to make another sizeable contribution. However, this is the kind of inflation surprise that the RBNZ has scope to look through.
We should emphasise that not all of the upcoming economic news is going to be more favourable. The housing market is likely to remain subdued this year, as various Government policies aimed at dampening housing market speculation come into effect. That's also likely to weigh on growth in household spending.
In addition, we expect the recent slowdown in growth to filter through to the labour market with a lag. That implies the uptick in the unemployment rate in the June quarter could run further in the near term, before the effects of fiscal stimulus push it lower again next year. It's not clear to what extent the RBNZ would be willing to tolerate a move in unemployment in the wrong direction, so we will be watching vigilantly for any labour market developments that could trigger a rate cut next year.
Financial markets have now removed any pricing for OCR hikes, and are now giving a 20% chance of a cut in the next year. We think that that shift has been appropriate, and is likely to go even further in the coming weeks. That in turn implies lower borrowing rates and a lower exchange rate, which would serve the RBNZ's purposes.
Data Previews
Aus Q2 Wage Price Index - %qtr
- Aug 15, Last: 0.5%, WBC f/c: 0.6%
- Mkt f/c: 0.6%, Range: 0.5% to 0.8%
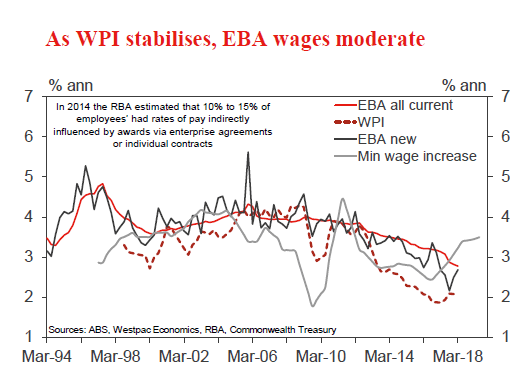
There has been some removal of excess slack in the labour market as well as the annual boost from the lifting of the minimum wage. And yet, we are still to observe a meaningful pickup in wage inflation. Total hourly wages ex bonuses gained 0.5% in Q1, again slightly less than market expectations of 0.6% holding the annual rate at 2.1%yr.
In Q1, private sector wages grew 0.5% holding the annual rate at 1.9%yr. Public sector wages grew 0.5% with the gains coming from education (0.8%) and public administration (0.5%). Public sector wage inflation has eased back to 2.3%yr from 2.4%yr which is on par with the 2016 record low of 2.3%yr.
The boost to the minimum wage last year helped to put a floor under wage inflation in 2016/2017 but it did not boost over wage inflation. This year the minimum wage was lifted by 3.5% to $18.29 per hour but this does not apply to July 1. As such we are forecasting a modest 0.6% rise but are cautious that an undershoot is again possible.
Aus Aug Westpac-MI Consumer Sentiment
- Aug 15, Last: 106.1
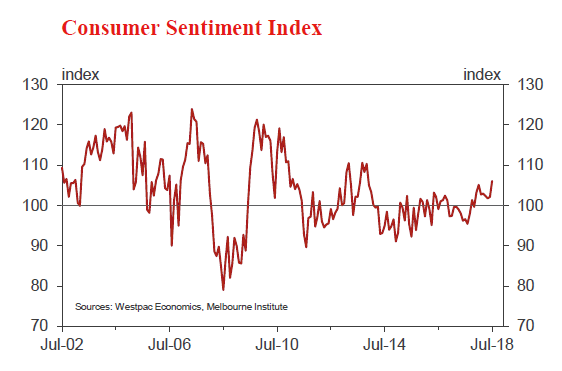
The consumer mood showed a clear improvement in July, the Index rising 3.9% to 106.1, the most positive since November 2013. That said, the overall level of sentiment is still not strong – the index averaged 108.3 over the ten years prior to the GFC with peaks well above the 110 mark. Much of the improvement over the last year reflects a more balanced growth profile across states.
The August survey is in the field from August 6-11. Factors that may influence this month include: the RBA's decision to leave official rates on hold, recent comments emphasising that any move is still a long way off; continued slippage in dwelling prices. Financial markets have been relatively steady, the ASX up marginally since the last survey and the AUD down slightly. Offshore, global trade tensions have again been to the fore.
Aus Jul Labour Force Survey - Employment '000
- Aug 16, Last: 51.9k., WBC f/c: –5.0k
- Mkt f/c: 15k, Range: -22k to 30k
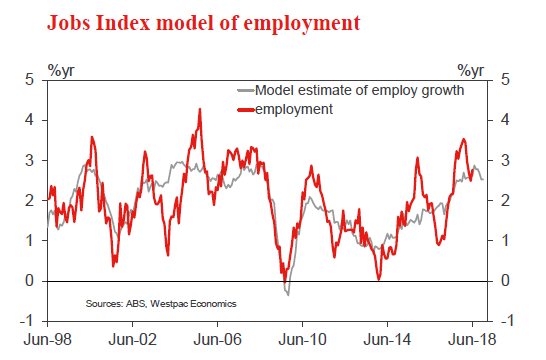
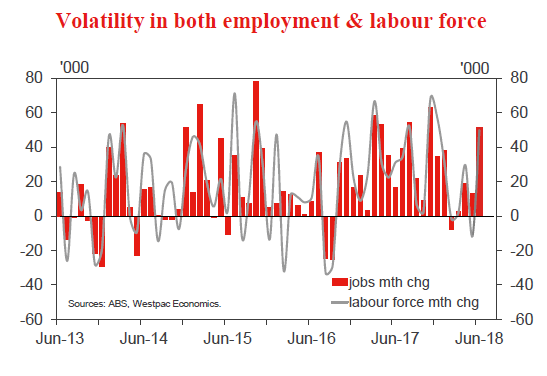
Australian employment increased by 51k in June beating the market consensus expectation of +16.5k and Westpac's +17k. With full-time contributing most of the gain, +41k, part-time rose +10k while hours worked increased by 0.6% rounding out a positive June employment result. Yet, the six month annualised pace is down to 1.9% from a peak of 4.3% in August 2017, though June's result means the three month average is 28k per month.
Employment in the business surveys softened in the last few months, something we are watching closely. Of note the June survey was associated with a strong rise in employment & participation. The ABS notes that in July, the outgoing rotation group has higher employment and participation ratios than the average for the whole sample. If the incoming sample is more like the average, then it will drive both a softer employment and participation print hence we see the risk for a negative print. Our –5k forecast will see the three month average fall to 19.8k.
Aus Jul Labour Force Survey - Unemployment %
- Aug 16, Last: 5.4%, WBC f/c: 5.4%
- Mkt f/c: 5.4%, Range: 5.3% to 5.5%
The Australian unemployment rate held at 5.4% as the participation rate reversed last month's decline to lift to 65.7% from 65.5%. In part, this highlights the responsiveness of labour supply to stronger employment that we have been seeing over the past few years. As such, the unemployment rate has been sticky around 5 ½ per cent.
But we also note above that some of the monthly volatility can be driven by sample volatility. We suspect some of the rise in both employment and the labour force in the June survey was due to the sample rolling in having a much higher attachment to the labour force. If the sample rolling in July is more like the sample average then we will see not only a softer employment print but also softer participation.
This is why, despite our forecast –5k for employment, we see the unemployment rate flat at 5.4%.
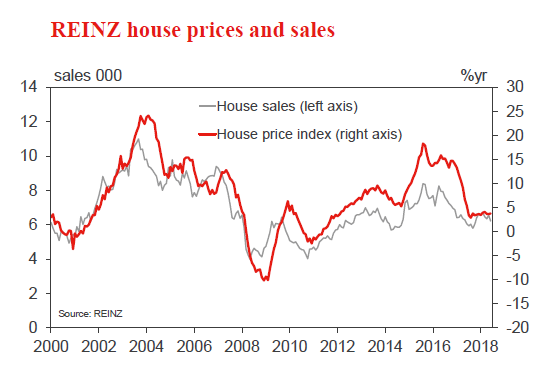
NZ Jul REINZ house sales and prices
- Due the week beginning Aug 13,
- Sales, Last: -5.1%. Prices, Last: 3.8%yr
The housing market has weakened over the past few months. Prices are falling in Auckland and Canterbury, and price growth has weakened elsewhere. June data was particularly weak, with a 5.1% drop in nationwide sales.
The slowdown in the housing market comes against a backdrop of significant policy changes targeting housing affordability and supply. We expect that these measures will result in further weakness in July.
Looking further ahead, restrictions on foreign buyers are likely to reinforce the other factors weighing on house price growth, although falling fixed interest rates might be a partial countervailing force.
Week Ahead – Pound Looks to UK Data to Halt Slide; US Retail Sales and Aussie Jobs Coming Up...
Economic releases will heat up in the coming week with monthly data on inflation, employment and retail sales certain to keep some traders busy as many head off for their summer holidays. Central bank meetings will take a backseat, though the week will not be totally absent of policy announcements as the Norges Bank meets to decide on rates.
Australian employment in focus for the aussie
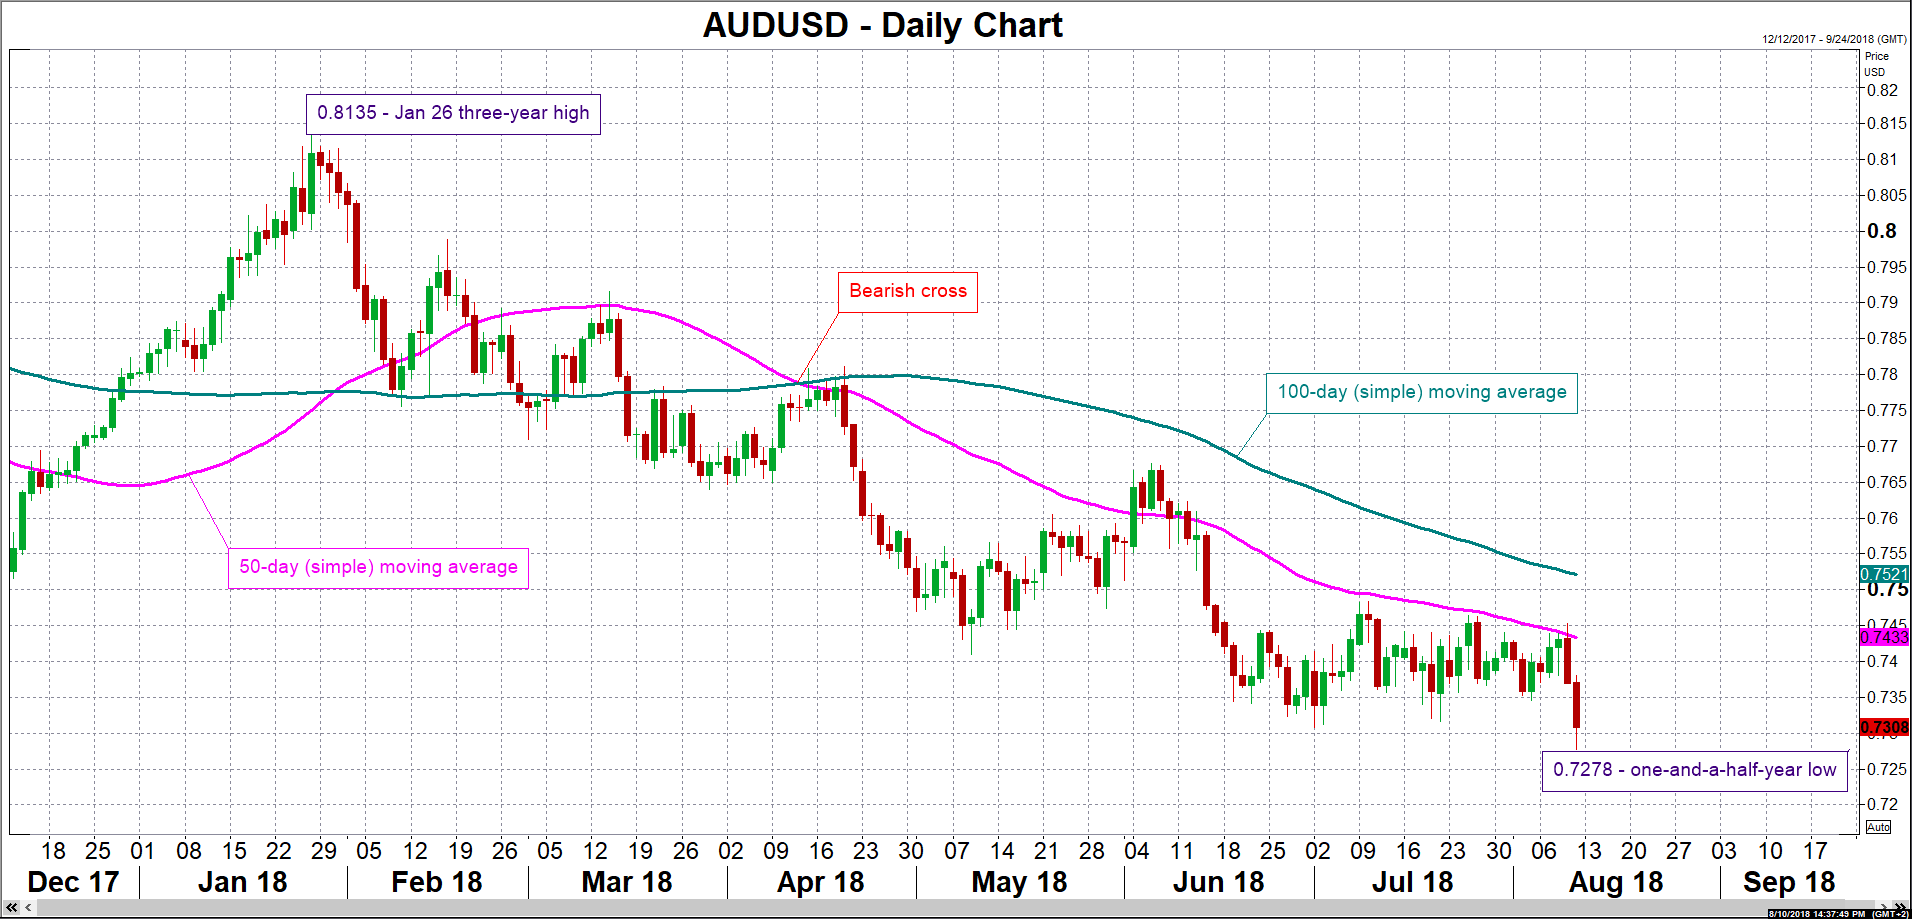
The Australian dollar hit its lowest since January 2017 of 0.7278 this past week, with US-China trade worries weighing on the currency. Previously – since late June – a neutral RBA largely confined the aussie to a range, as the central bank has signalled it wants to see higher wage growth before it begins considering raising rates. Wage growth and employment figures due next week will therefore fall under the spotlight as they could provide some hints as to the timeline of an RBA rate hike. The quarterly wage price index is out on Wednesday and the employment report for July will follow on Thursday. Also attracting attention for the aussie will be survey data, consisting of the NAB business confidence gauge on Tuesday and Westpac’s consumer sentiment index on Wednesday.
Chinese July indicators to be watched for tariffs impact
There was some relief this week as trade numbers showed exports from China rose by more-than-expected in July. Specifically, they surged by a solid 12.2% year-on-year, with little evidence so far that the US tariffs on Chinese goods implemented in July had a notable impact. Analysts aren’t forecasting a major drag on industrial output either as the sector is expected to have grown by 6.3% y/y in July, accelerating from the prior 6.0% rate. Investment in urban areas is expected to have risen by 6.0% y/y in the year-to-date in July, the same pace as in June. Growth in retail sales is also forecast to remain steady, at 9.0% y/y in July. The figures are due on Tuesday. While a deterioration in the data is not being anticipated, neither are they expected to point to strong momentum and so may not do much in lifting market sentiment and in turn the aussie which is a viewed as a liquid proxy for “China plays”, given that China is Australia’s biggest export market.
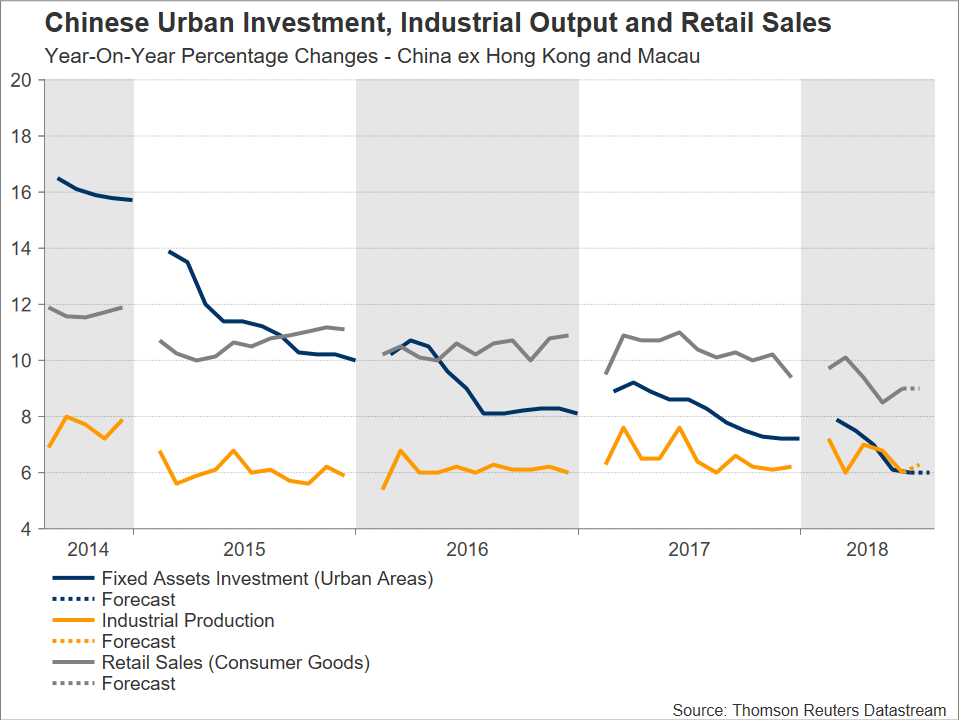
Japanese exports to moderately accelerate in July
While ongoing trade tensions have kept the yen in demand in recent weeks, growing speculation that the Bank of Japan is slowly moving towards tighter monetary policy have also been supporting the currency. Upbeat trade figures due during Thursday’s Asian session may add to the positive sentiment for the yen. Exports are forecast to increase by 6.3% y/y in July, below June’s 6.7%, while import growth is expected at 14.4% y/y during the same month, at a much higher pace compared to June’s 2.6%. Moreover, data out this week showed Japan’s economy expanded by an annualized rate of 1.9% in the second quarter following Q1’s contraction by 0.9%, suggesting that economic activity in Japan is back on a more sustained path.
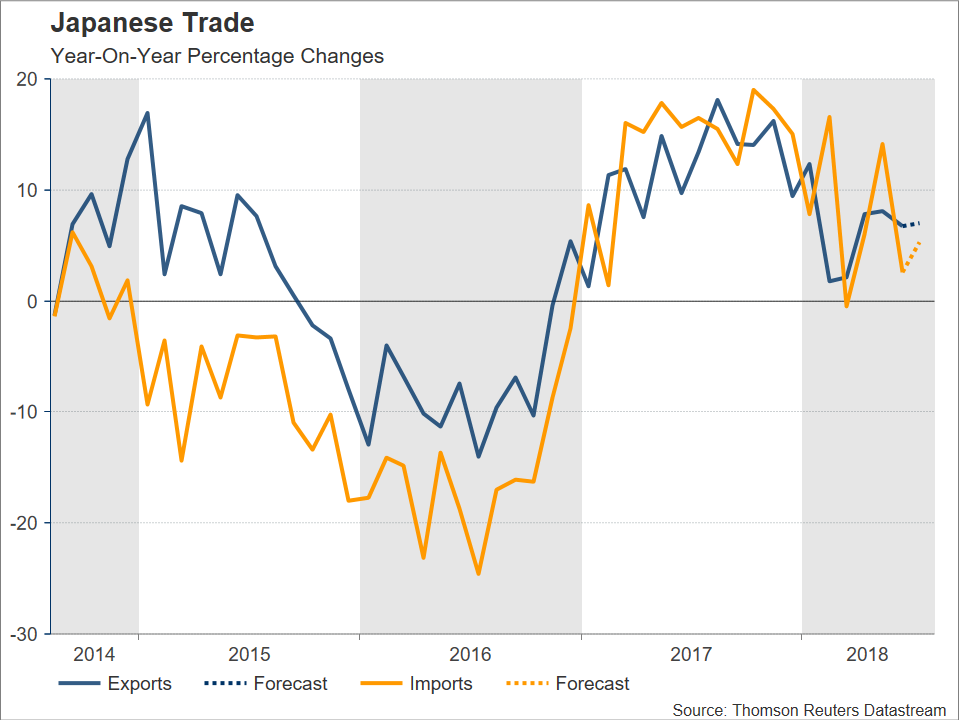
Another subdued week for Eurozone data
The Eurozone calendar will be light again in the next seven days with only a handful of major releases. Up first is the ZEW business survey out of Germany on Tuesday, with the economic sentiment index forecast to improve in August, though still remain in negative territory. Also due on Tuesday are Eurozone industrial output numbers for June and the second estimate of GDP growth for the second quarter. No revision is expected to the preliminary print of 0.3% quarter-on-quarter. Finally, on Friday, the final inflation reading for July will be released, with no revision projected either.
Also worth keeping an eye on is the policy decision by Norway’s central bank. The Norges Bank is due to announce its decision on Thursday and will probably keep its benchmark rate unchanged at 0.5%. At its last meeting in June, the Bank had reiterated its plans for a rate hike in September and is unlikely to deviate from that view in August. However, investors will still be watching whether there will be any change to the tone of the statement for possible clues as to the path of interest rates beyond September. The Norwegian krone is likely to strengthen on the back of a potentially more hawkish central bank next week, with the opposite holding true as well.
Will UK data put a floor to sterling’s slide?
The pound has been in freefall since the Bank of England policy meeting on August 8, as comments by the Bank’s Governor as well as government ministers have fuelled concerns about a no-deal Brexit. However, with cable looking oversold, a batch of data out of the UK next week could help the British currency put an end to its losing streak. Starting with the labour market report on Tuesday, the unemployment rate is expected to remain at the multi-decade low of 4.2% in June, with the number of jobs created during the three months to June projected to come in at the healthy figure of 105k. Another big rise in employment would add support to the BoE’s argument that the labour market is tightening, hence justifying this month’s rate hike. But even more important will be the latest wage growth numbers. Average weekly earnings are anticipated to have risen by 2.5% in the three months to June, exceeding CPI growth – though not by far – for the fifth month in a row and thus translating into positive real income growth.
On Wednesday, the focus will turn to July inflation figures. The annual rate of CPI is forecast to rise by 2.5% from 2.4% in June, while the core rate is expected to remain at 1.9% y/y. After five straight months of below-forecast prints, another miss in July would likely dampen expectations about further rate hikes over the coming months, acting as an additional drag on the British currency. Rounding up the UK releases will be retail sales on Thursday. Those are anticipated to grow by 0.2% m/m in July, bouncing back from a 0.5% dip in June.
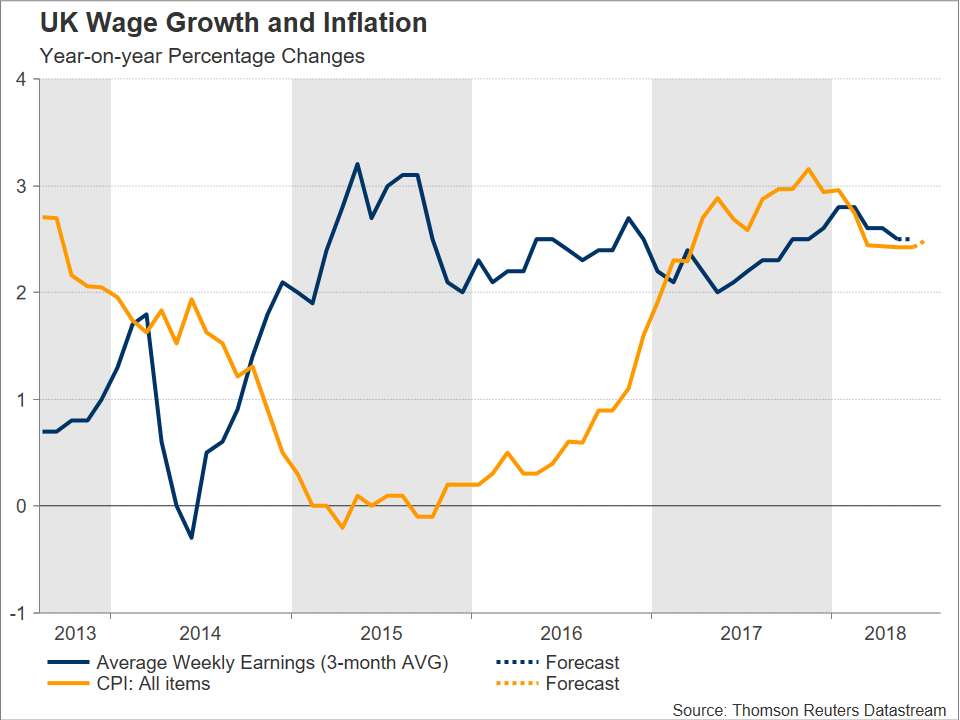
Lastly, with Brexit gloom weighing considerably on sterling over the last couple of weeks, any updates on this front are most likely to prove market sensitive; should the cliff-edged Brexit story receive additional traction, then the pound could be in for further losses, and vice versa.
US retail sales and Canadian inflation to be North American highlights
It’s going to be a little busier for US data after the past week’s lull. But it’s going to be a slow start with only July import & export prices on Tuesday to keep traders preoccupied, with things not picking up until Wednesday when there will be a barrage of releases. Among which, the more notable ones will be the New York Fed’s Empire State manufacturing index for August, labour costs and productivity figures for the second quarter, as well as July industrial and manufacturing production numbers. However, the more eagerly awaited release will be the retail sales figures for July as they will provide the first look at the strength of consumer spending going into the third quarter.
Retail sales are forecast to have increased by 0.1% month-on-month in July, slowing from the prior 0.5%. However, the alternative ‘retail control’ measure of sales, which is used in GDP calculations, is forecast to rebound by 0.4% m/m in July after being flat in June. On Thursday, attention will turn to the housing market as both building permits and housing starts are released for July. The Philly Fed manufacturing index is also due on Thursday and there will be more survey data on Friday, this time on consumer confidence in the form of the University of Michigan’s preliminary consumer sentiment reading for August.
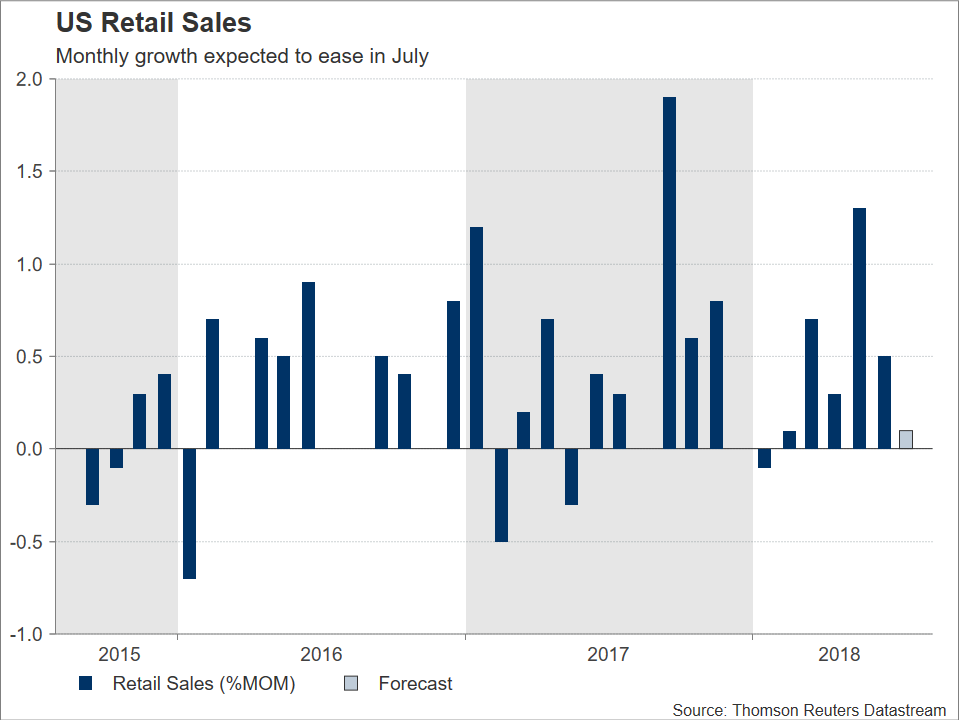
A strong set of data could help the dollar index maintain this week’s strong positive momentum, which saw it pierce through the 96 level, rising to a 13-month high.
Turning to the Canadian dollar, which came under pressure this week from a broadly stronger greenback, weaker oil prices and a major diplomatic dispute between Canada and Saudi Arabia, it is likely to prove sensitive to inflation numbers due from Canada on Friday. The 12-month rate of CPI is expected to grow by 2.4% in July, down from June’s 2.5%. Core CPI, as well as the measures of inflation monitored by the Bank of Canada – median, common and trimmed CPI – will also be attracting interest. A data beat is likely to reinforce expectations that the Bank of Canada is the only major central bank that can somewhat keep up with the Fed in terms of rate normalization, subsequently boosting the loonie.
In the big picture, trade tensions and EM considerations which led to a tumble in the Turkish lira and the Russian ruble, having widespread effects on other currencies such as the euro as well, will likely continue attracting attention.
Weekly Focus: Trade War and US Sanctions Dominating Markets
Market movers ahead
- In Norway, we do not expect Norges Bank to raise its policy rate. The upcoming meeting is one of the small meetings without an updated monetary report and press conference.
- In Denmark, the GDP indicator for Q2 is due. We estimate decent growth of 0.5% q/q. In Sweden, we get housing price data from Mäklarstatistik and Valueguard.
- In China, many interesting economic indicators are due next week. Chinese data have weakened, so they are interesting to follow, also in the light of the escalating trade war with the US and the policy easing in China.
- In the US, we are set to get housing and retail sales data.
- In the UK, the jobs report for June and CPI inflation for July are due out next week.
Global macro and market themes
- The trade war between China and the US is escalating, with Donald Trump now wanting to impose 25% tariffs instead of 10% and China retaliating. It is difficult to see a deal between the two countries, at least on this side of the US midterm elections in November.
- The Fed and the ECB are on autopilot; China is easing.
- The US has slapped sanctions on Iran, Turkey and Russia, leading to a slump in the RUB and TRY.
Another Month, Another Firm U.S. CPI Print in July
Highlights:
- All items CPI rose 0.2% on month-over-month basis in July with the year-over-year rate holding steady at 2.9%
- Energy prices dipped slightly lower from June but were still up 12% from a year ago — little changed from the annual increase in June.
- Year-over-year food price growth held steady at 1.4%.
- Core (ex-food & energy) prices rose 0.2% on a month-over-month basis. That was enough to push the year-over-year rate up to a new cycle high of 2.4% in July.
Our Take:
U.S. CPI growth continued to firm in July. The headline year-over-year rate held steady at 2.9% — and is still being boosted by higher energy prices which were still up 12% from a year ago despite a monthly dip. Growth in the core (ex-food & energy) measure ticked modestly higher on a year-over-year basis for a third straight month, inching up to a new post-recession high at 2.4%. Shelter price growth bounced back as expected to a 0.3% month-over-month rate after a 0.1% increase in June. A 2.7% monthly jump in airline fares could be related to higher energy prices although prices were still below year-ago levels in July.
To be sure, there is still little evidence that inflation is at risk of coming seriously unhinged on the upside in the near-term. The firming at rates slightly above the Fed’s stated 2% inflation objective, though, coupled with strong labour market and GDP data should only reinforce expectations that policymakers will continue to push interest rates gradually higher.