Sample Category Title
EUR/USD Bearish ABC After Failure To Break Resistance
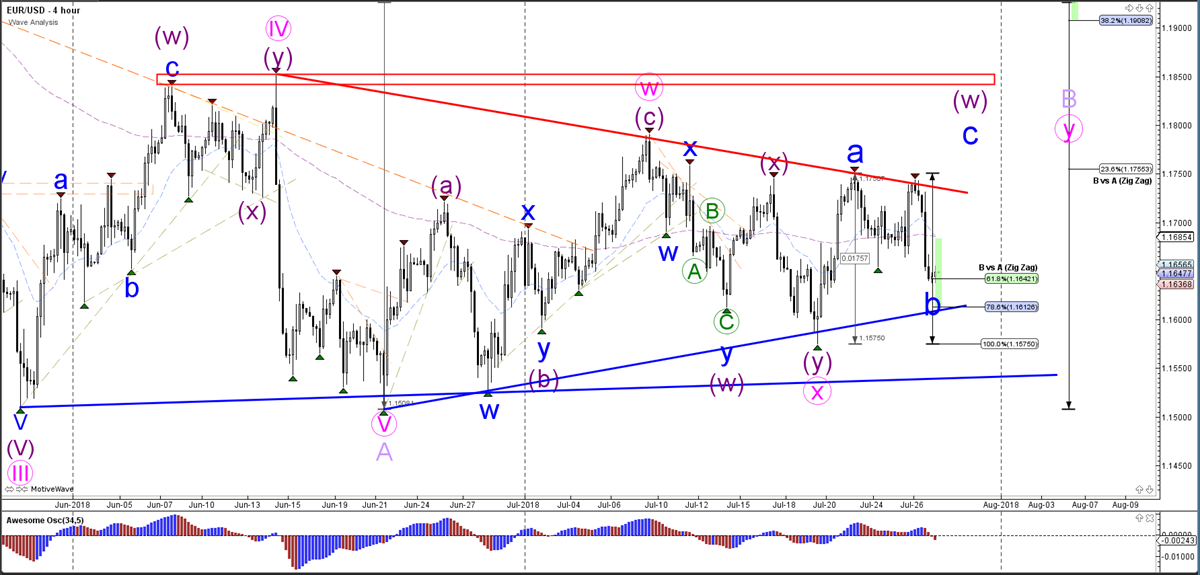
The EUR/USD failed to break the resistance trend line (red) which could indicate a larger correction within wave B (blue). The Fibonacci levels of wave B vs A could act as potential support levels for a bullish bounce and reversal within wave C (blue) of wave W (purple) and wave Y (pink). A break below the 100% Fib invalidates the ABC (blue).
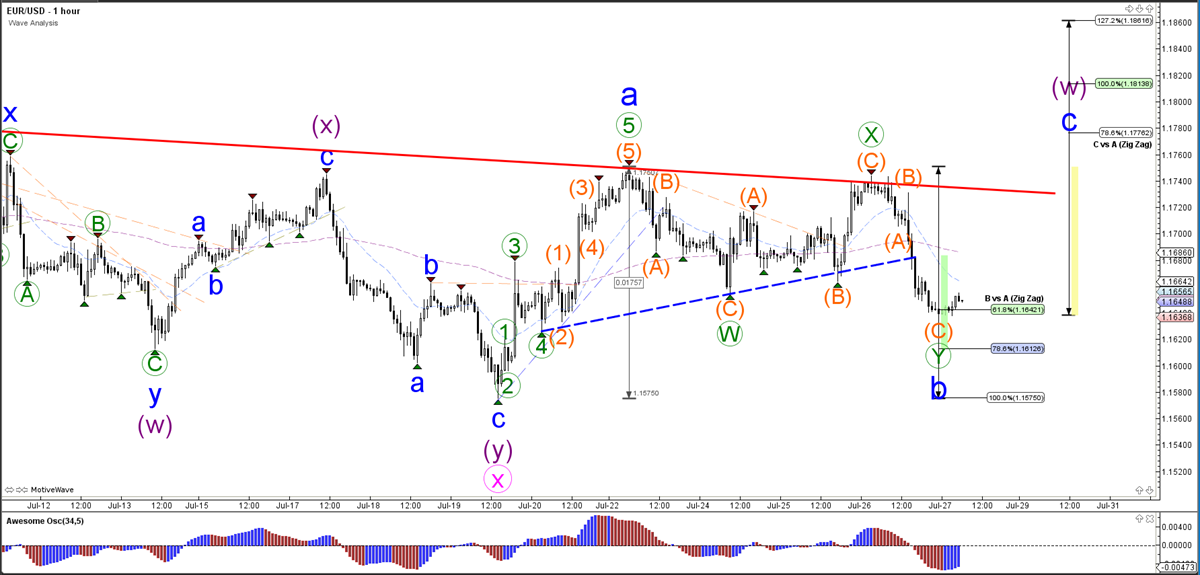
The EUR/USD broke below the support trend line (dotted blue) and seems to be completing a wave C (orange) zigzag pattern within wave B (blue).
USD/JPY Completes 5 Waves & Prepares For Bullish ABC
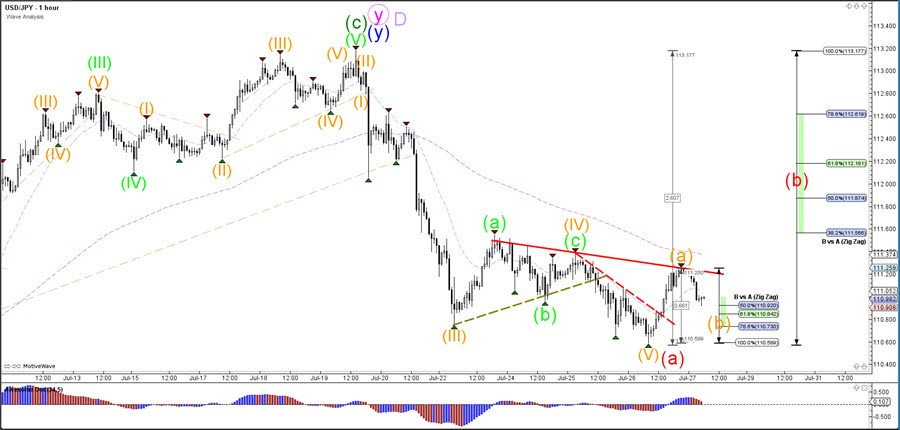
The USD/JPY made a bullish bounce after showing a new low and hitting the support trend lines, which seems to indicate a completed wave A (red) and the start of a new wave B (red) correction.
A bullish breakout above the resistance trend line (red) would confirm the development of a wave B (red) whereas a bearish breakout below the support trend lines (blue) indicates an extension of the wave A (red).
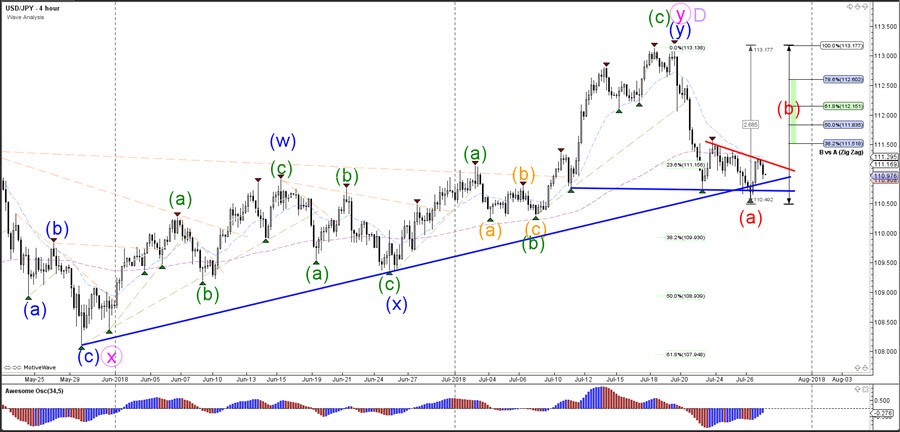
The USD/JPY seems to be building a bullish ABC (orange) correction within wave B (red) after completing 5 bearish waves (orange) within wave A (red). A break below the 100% Fibonacci level invalidates the wave B (orange).
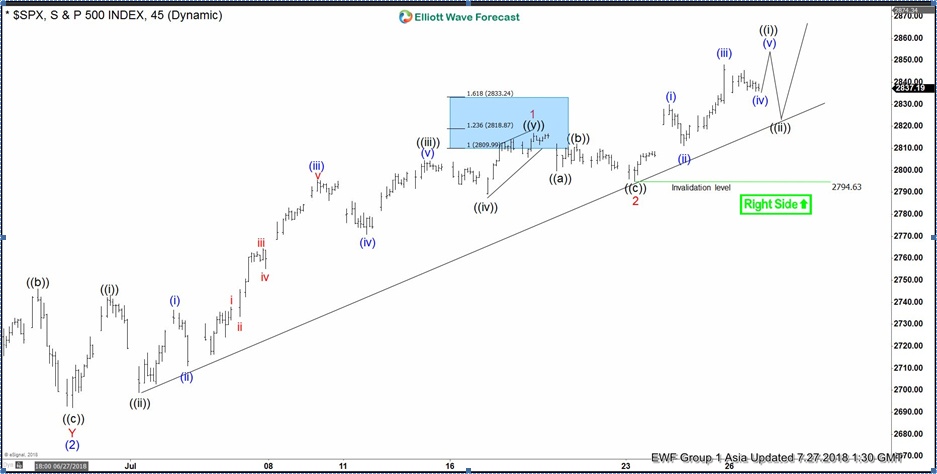
Elliott Wave Analysis: SPX Next Leg Higher May Have Started
SPX short-term Elliott Wave analysis suggests that the decline to $2691.99 low ended intermediate wave (2) pullback. Above from there, the rally is taking the form of an impulse Elliott wave structure. The internal subdivision of each leg higher unfolded in 5 waves (i.e Minor wave 1, 3 and 5). On the other hand, Minor wave 2 & 4 are expected to take the form of any 3 wave corrective sequence i.e zigzag, double three, Flat etc.
Up from $2691.99 low, the rally higher to $2743.26 high ended Minute wave ((i)) in 5 waves. The pullback in Minute wave ((ii)) ended at $2698.95, Minute wave ((iii)) ended in 5 waves at $2804.53 high. Then the pullback in Minute wave ((iv)) ended at $2789.24 low. And Minute wave ((v)) rally ended as ending diagonal at $2816.76 high. This rally also completed Minor wave 1. Down from there, the pullback to $2794.63 low ended Minor wave 2 as Elliott wave Zigzag correction.
Above from there, the index has managed to make a new high above $2816.76 peak confirming the next extension higher in Minor wave 3. Near-term, while dips remain above $2794.63 low and more importantly the pivot from $2691.99 low stays intact the index is expected to see more upside extension. We don’t like selling it and expect dips to remain supported in 3, 7 or 11 swings against $2794.63 low in the first degree.
SPX 1 Hour Elliott Wave Chart
The ECB Leaves Key Interest Rate Unchanged, Draghi Says Outlook For The Economy Remains Solid
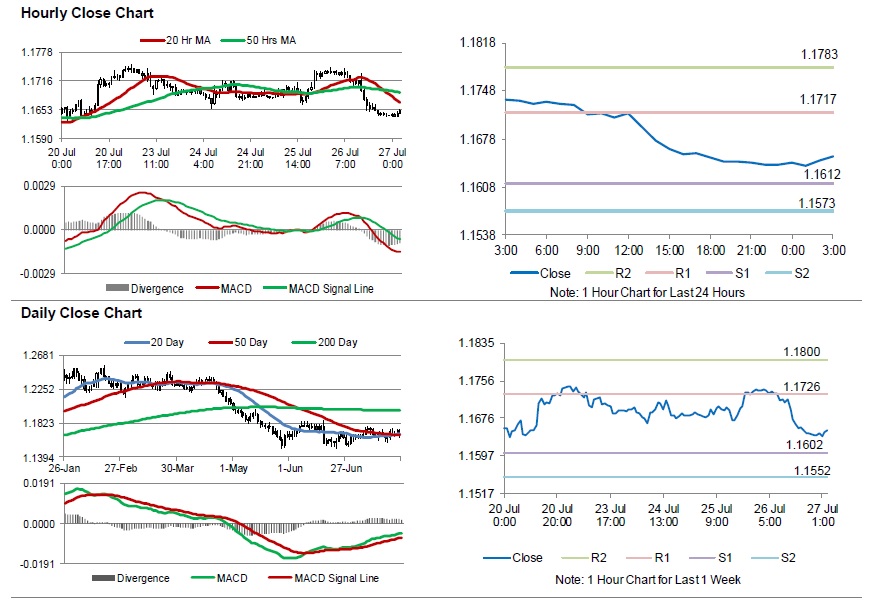
For the 24 hours to 23:00 GMT, the EUR declined 0.78% against the USD and closed at 1.1641, after ECB confirmed to end its bond purchases in December 2018.
The European Central Bank (ECB), at its July monetary policy meeting, decided to keep the benchmark interest rate steady at 0.00%, in line with expectations and reiterated its guidance for its asset purchases. Meanwhile, the officials expect the key interest rates to remain at their present levels at least through the summer of 2019 and inflation close to 2.0% over the medium term. In a statement post-meeting, the ECB President, Mario Draghi, stated that euro area economic recovery is proceeding along its solid and broad-based path However, the risk of persistent heightened financial market volatility requires monitoring.
Macroeconomic data showed that Germany’s Gfk consumer confidence index unexpectedly eased to a level of 10.6 in August, compared to market consensus for an unchanged reading. In the prior month, the index had registered a reading of 10.7.
In the US, data indicated that seasonally adjusted initial jobless claims rose to 217.0K in the week ended 21 July 2018, compared to a revised level of 208.0K in the prior week. Market participants had anticipated initial jobless claims to rise to 215.0K. Moreover, advance goods trade deficit widened to $68.3 billion, more than market expectations for a deficit of $67.0 billion. In the preceding month, advance goods trade had recorded a deficit of $64.8 billion. Meanwhile, the nation’s preliminary durable goods orders rallied 1.0% on a monthly basis in June, undershooting market expectations for a gain of 3.0%. Durable goods orders had recorded a revised drop of 0.3% in the previous month. In the Asian session, at GMT0300, the pair is trading at 1.1652, with the EUR trading 0.09% higher against the USD from yesterday’s close.
The pair is expected to find support at 1.1612, and a fall through could take it to the next support level of 1.1573. The pair is expected to find its first resistance at 1.1717, and a rise through could take it to the next resistance level of 1.1783.
Later in the day, investors would look forward to the release of US Q2 GDP data and the Michigan consumer sentiment index for July.
The currency pair is trading below its 20 Hr and 50 Hr moving averages.
Sterling Trading A Tad Higher In The Morning Session
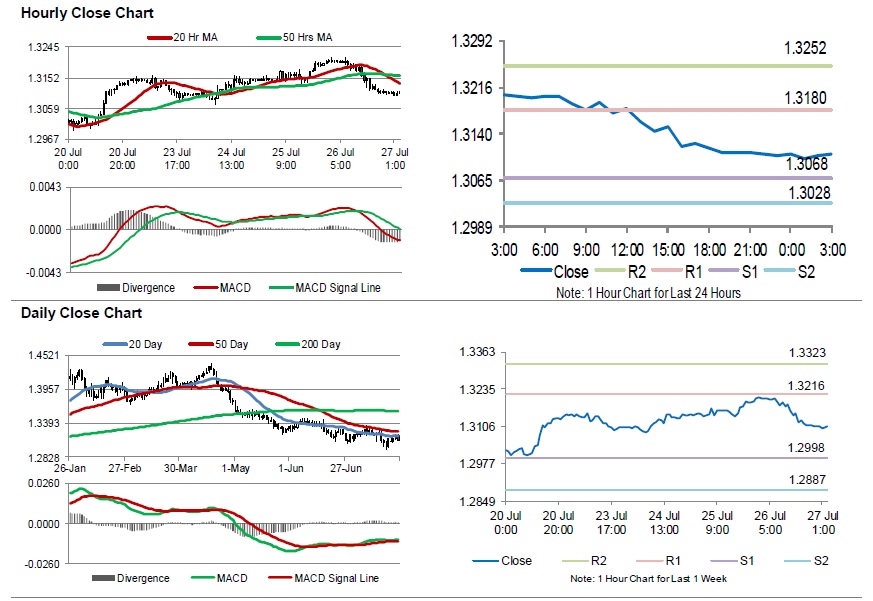
For the 24 hours to 23:00 GMT, the GBP declined 0.67% against the USD and closed at 1.3106.
In the Asian session, at GMT0300, the pair is trading at 1.3108, with the GBP trading slightly higher against the USD from yesterday’s close.
The pair is expected to find support at 1.3068, and a fall through could take it to the next support level of 1.3028. The pair is expected to find its first resistance at 1.3180, and a rise through could take it to the next resistance level of 1.3252.
With no macroeconomic releases in Britain today, investor sentiment would be governed by global macroeconomic events.
The currency pair is trading below its 20 Hr and 50 Hr moving averages.
Japanese Yen Trading On A Stronger Footing This Morning
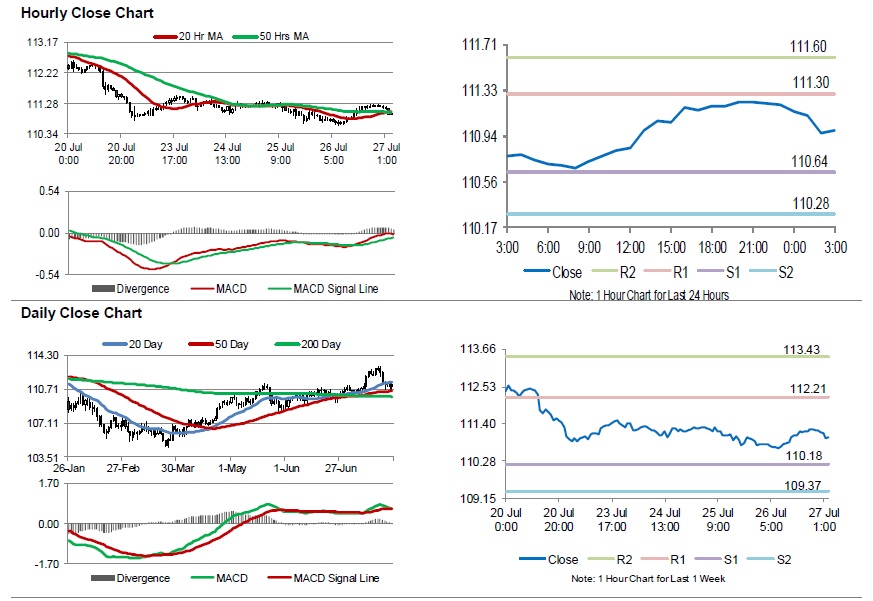
For the 24 hours to 23:00 GMT, the USD rose 0.29% against the JPY and closed at 111.21.
In the Asian session, at GMT0300, the pair is trading at 110.99, with the USD trading 0.20% lower against the JPY from yesterday’s close.
The pair is expected to find support at 110.64, and a fall through could take it to the next support level of 110.28. The pair is expected to find its first resistance at 111.30, and a rise through could take it to the next resistance level of 111.60.
In absence of key economic releases in Japan today, traders would keep an eye on global macroeconomic releases for further direction.
The currency pair is showing convergence with its 20 Hr and 50 Hr moving averages.
Swiss Franc Trading Slightly Higher In The Asian Session
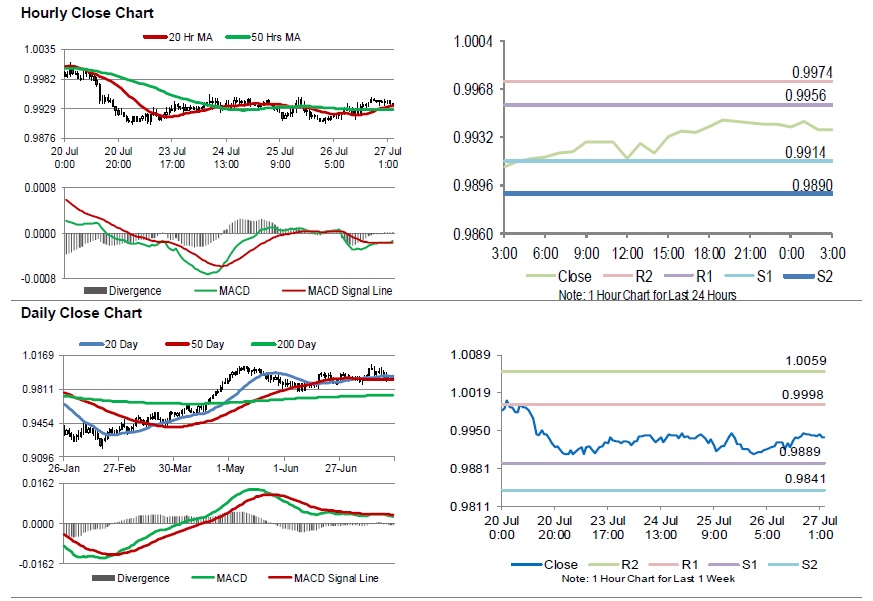
For the 24 hours to 23:00 GMT, the USD rose 0.31% against the CHF and closed at 0.9942.
In the Asian session, at GMT0300, the pair is trading at 0.9938, with the USD trading marginally lower against the CHF from yesterday’s close.
The pair is expected to find support at 0.9914, and a fall through could take it to the next support level of 0.9890. The pair is expected to find its first resistance at 0.9956, and a rise through could take it to the next resistance level of 0.9974.
With no macroeconomic releases today, investors will focus on Switzerland’s consumer price index, KOF leading indicator and real retail sales, scheduled to release next week. The currency pair is showing convergence with its 20 Hr moving average and trading above its 50 Hr moving average.
Loonie Reverses Its Losses In The Asian Session
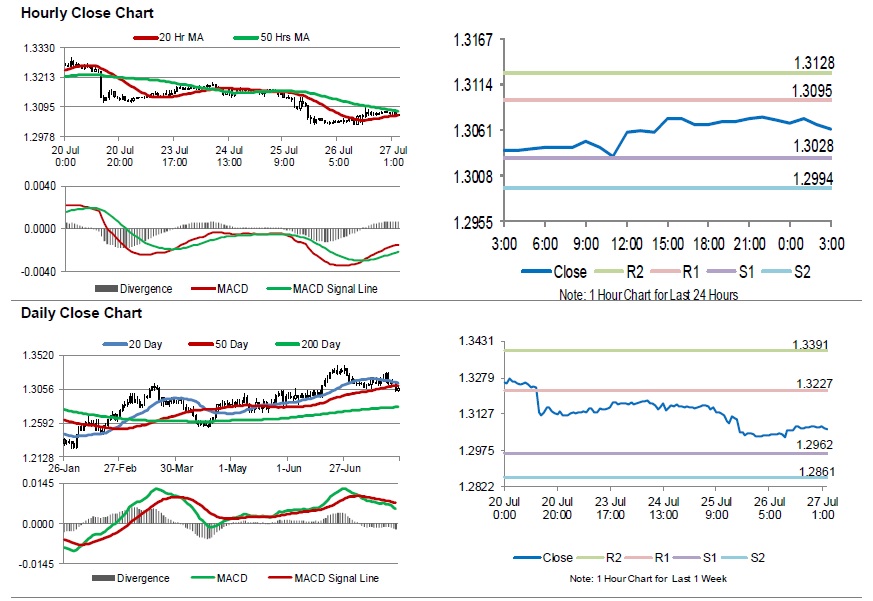
For the 24 hours to 23:00 GMT, the USD rose 0.24% against the CAD and closed at 1.3073.
In the Asian session, at GMT0300, the pair is trading at 1.3063, with the USD trading 0.08% lower against the CAD from yesterday’s close.
The pair is expected to find support at 1.3028, and a fall through could take it to the next support level of 1.2994. The pair is expected to find its first resistance at 1.3095, and a rise through could take it to the next resistance level of 1.3128.
Next week, investors would closely monitor Canada’s gross domestic product (GDP), manufacturing PMI and leading indicator data.
The currency pair is showing convergence with its 20 Hr moving average and trading below its 50 Hr moving average.
Aussie Trading Higher In The Asian Session
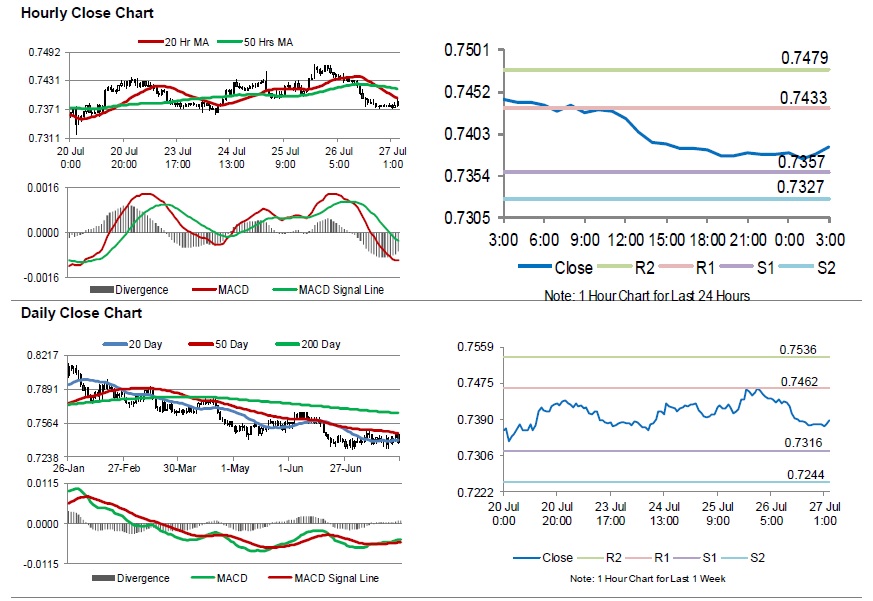
For the 24 hours to 23:00 GMT, the AUD declined 0.99% against the USD and closed at 0.7378.
LME Copper prices rose 0.1% or $3.0/MT to $6255.0/MT. Aluminium prices declined 0.1% or $2.5/MT to $2054.0/MT.
In the Asian session, at GMT0300, the pair is trading at 0.7388, with the AUD trading 0.14% higher against the USD from yesterday’s close.
Overnight data showed that, Australia’s producer price index advanced 1.5% on an annual basis in the second quarter of 2018, following a rise of 1.7% in the previous quarter.
The pair is expected to find support at 0.7357, and a fall through could take it to the next support level of 0.7327. The pair is expected to find its first resistance at 0.7433, and a rise through could take it to the next resistance level of 0.7479.
Going ahead, traders will closely monitor Australia’s AiG performance of manufacturing index, trade balance and building approvals, all set to release next week.
The currency pair is trading below its 20 Hr and 50 Hr moving averages.
Gold: Yellow Metal Trading Marginally Higher In The Asian Session
For the 24 hours to 23:00 GMT, Gold declined 0.69% against the USD and closed at USD1232.80 per ounce, as strength in the US dollar, dented demand for the safe haven asset.
In the Asian session, at GMT0300, the pair is trading at 1233.00, with gold trading a tad higher against the USD from yesterday’s close.
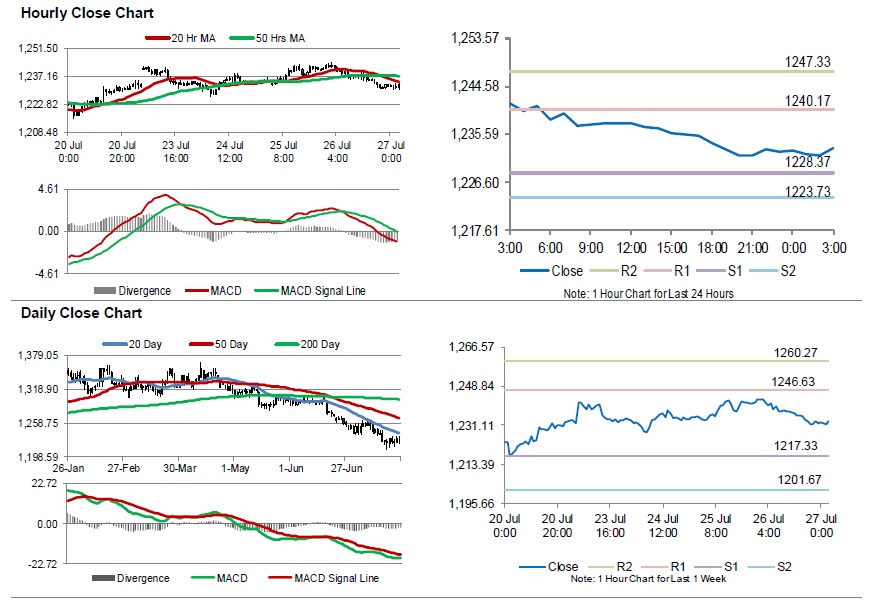
The pair is expected to find support at 1228.37, and a fall through could take it to the next support level of 1223.73. The pair is expected to find its first resistance at 1240.17, and a rise through could take it to the next resistance level of 1247.33.
The yellow metal is trading below its 20 Hr and 50 Hr moving averages.