Sample Category Title
EUR/JPY Daily Outlook
Daily Pivots: (S1) 129.62; (P) 129.94; (R1) 130.48; More....
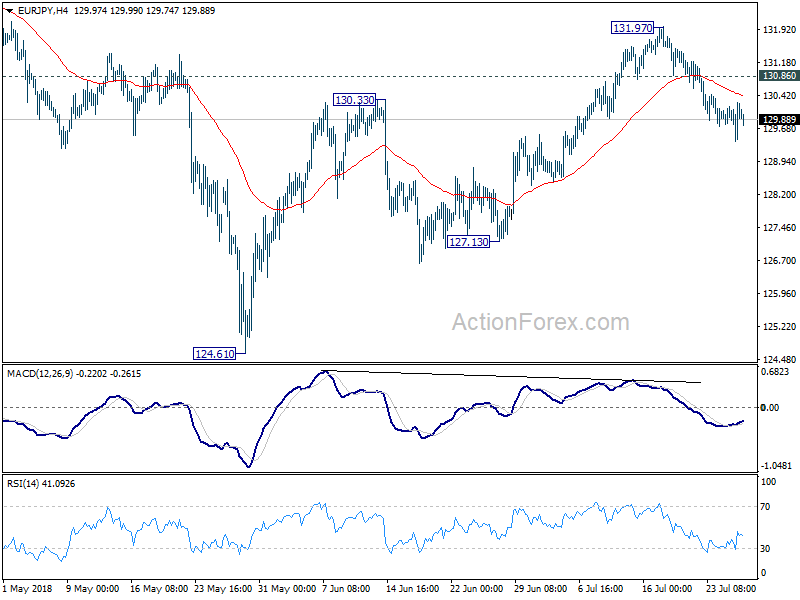
Despite losing downside momentum as seen in 4 hour MACD, deeper fall is expected with 130.86 minor resistance intact. As noted before, EUR/JPY's rebound from 124.61 could have completed at 131.97 already. Break of 127.13 will confirm this bearish case and target 124.61 low. On the upside, though, above 130.86 minor resistance will dampen this bearish cas and bring retest of 131.97 instead.
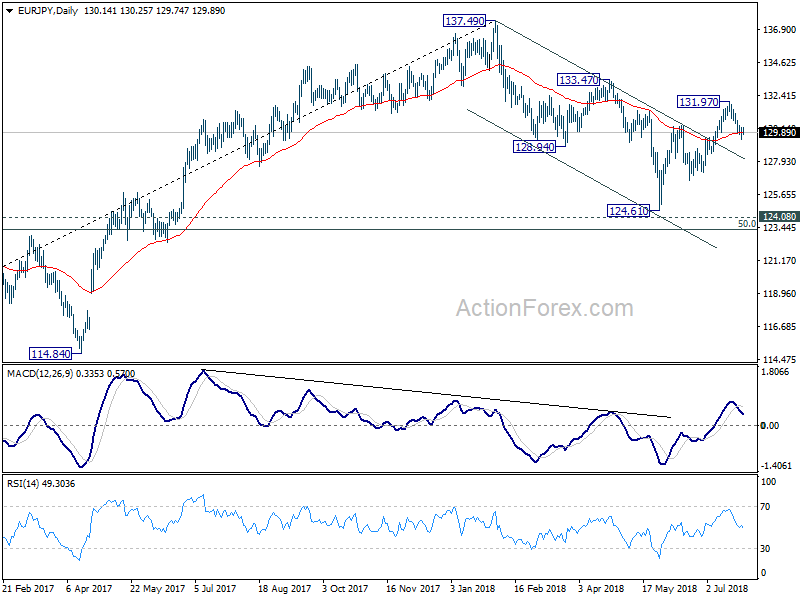
In the bigger picture, the strong break of channel resistance from 137.49 suggests that the decline from there has completed. The three wave structure suggests that it's a correction. With 124.08 key resistance turned support intact, medium term bullishness is also retained. Break of 133.47 will affirm this bullish case and target 137.49 and above. This will now be the favored case as long as 127.13 support holds.
EUR/GBP Daily Outlook
Daily Pivots: (S1) 0.8875; (P) 0.8889; (R1) 0.8906; More...
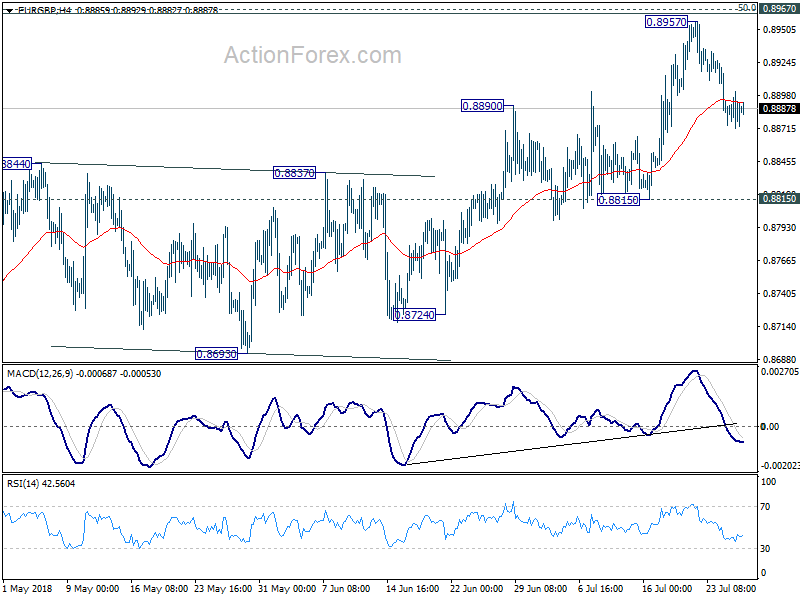
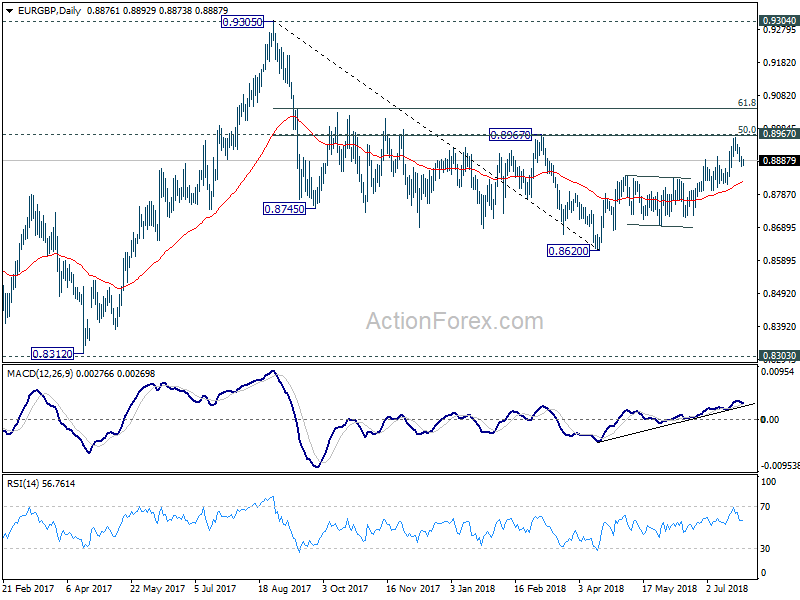
EUR/GBP's corrective pull back from 0.8957 is in progress and could extend lower. But still, with 0.8815 support intact, further rally is expected in the cross. On the upside, sustained break of 0.8967 cluster resistance (50% retracement of 0.9305 to 0.8620 at 0.8963) should confirm completion of whole decline from 0.9305. EUR/GBP should then target 61.8% retracement at 0.9043 next.
In the bigger picture, EUR/GBP is staying in long term range pattern from 0.9304 (2016 high). The corrective structure of the fall from 0.9305 to 0.8620 is raising the chance that rise from 0.8312 to 0.9305 is an impulsive move. But we're not too confident on it yet. In any case, we'd stay cautious on strong resistance from 0.9304/5 to limit upside in case of further rally. Meanwhile, if there is another medium term decline, strong support will likely be seen from 0.8303 to contain downside.
EUR/AUD Daily Outlook
Daily Pivots: (S1) 1.5686; (P) 1.5747; (R1) 1.5793; More....
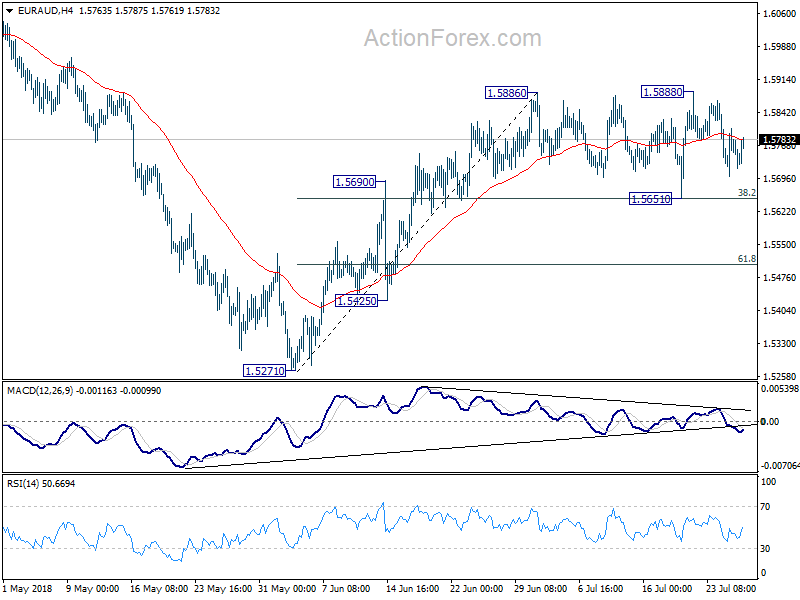
No change in EUR/AUD's outlook as consolidation from 1.5886 is in progress. Intraday bias remains neutral at this point. With 1.5651 minor support intact, further rise would be seen. On the upside, break of 1.5888 resistance will extend the rally towards 1.6139/89 resistance zone. However, break of 1.5651 cluster support (38.2% retracement of 1.5271 to 1.5886 at 1.5651) will indicate near term reversal and turn bias back to the downside for 1.5271.
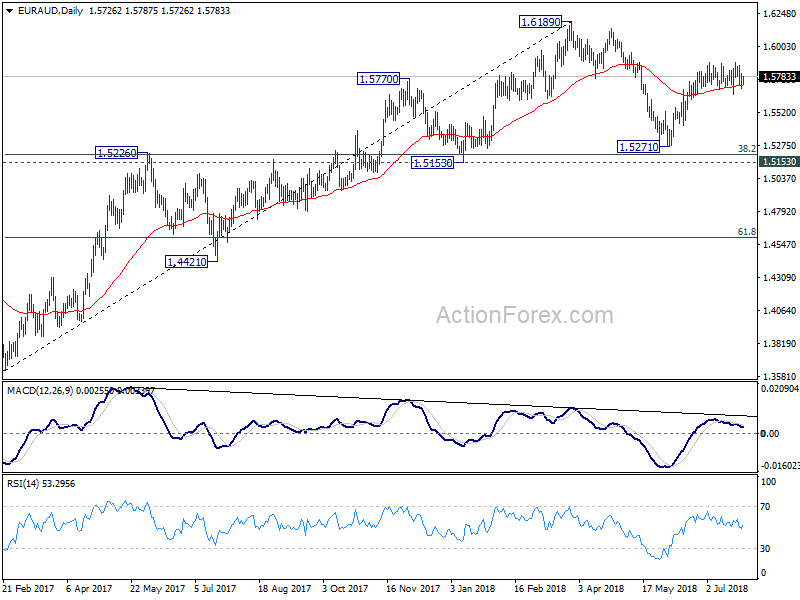
In the bigger picture, current development suggests that fall from 1.6189 is a corrective move and has completed at 1.5271 already. Key support levels of 1.5153 and 38.2% retracement of 1.3624 to 1.6189 at 1.5209 were defended. And medium term rise from 1.3624 (2017 low) is still in progress. Break of 1.6189 will target 1.6587 key resistance (2015 high).
EUR/CHF Daily Outlook
Daily Pivots: (S1) 1.1605; (P) 1.1621; (R1) 1.1646; More...
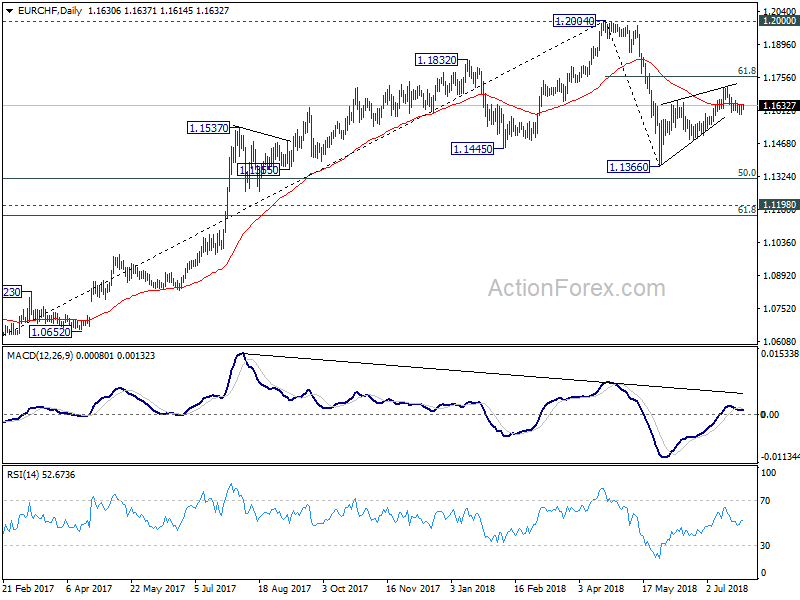
Intraday bias in EUR/CHF is turned neutral with current recovery. But another fall is still in favor with 1.1653 minor resistance intact. We're holding on to the view that corrective rebound from 1.1366 has completed with three waves up to 1.1713 already. Below 1.1593 will target 1.1478 support to confirm this case. However, above 1.1653 minor resistance will bring another rise. But in that case, we'd expect strong resistance from 61.8% retracement of 1.2004 to 1.1366 at 1.1760 to bring near term reversal.
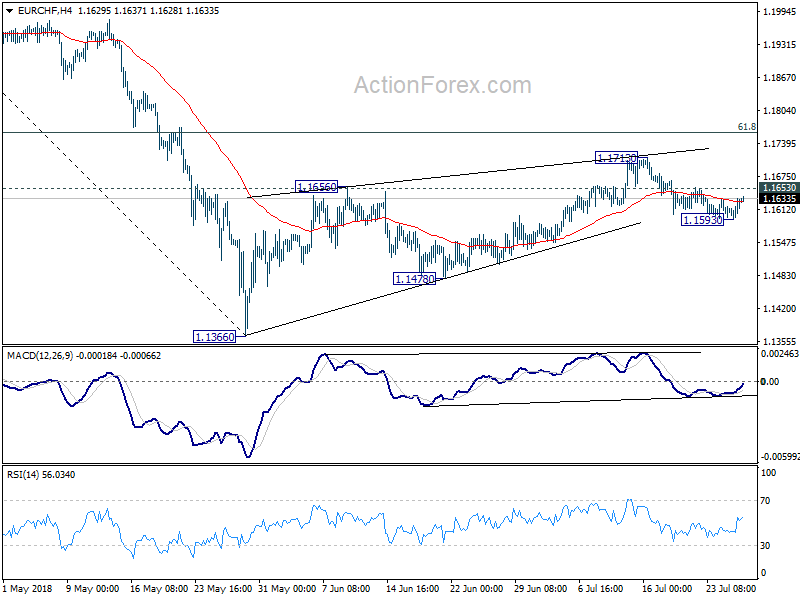
In the bigger picture, 1.2004 is seen as a medium term top with bearish divergence condition in daily and weekly MACD. 1.2000 is also an important resistance level. Hence, the corrective pattern from 1.2004 is expected to extend for a while before completion. We're not anticipating a break of 1.2004 in near term. Another decline cannot be ruled out yet. But in that case, strong support should be seen at 1.1198 (2016 high), 61.8% retracement of 1.0629 to 1.2004 at 1.1154 to contain downside.
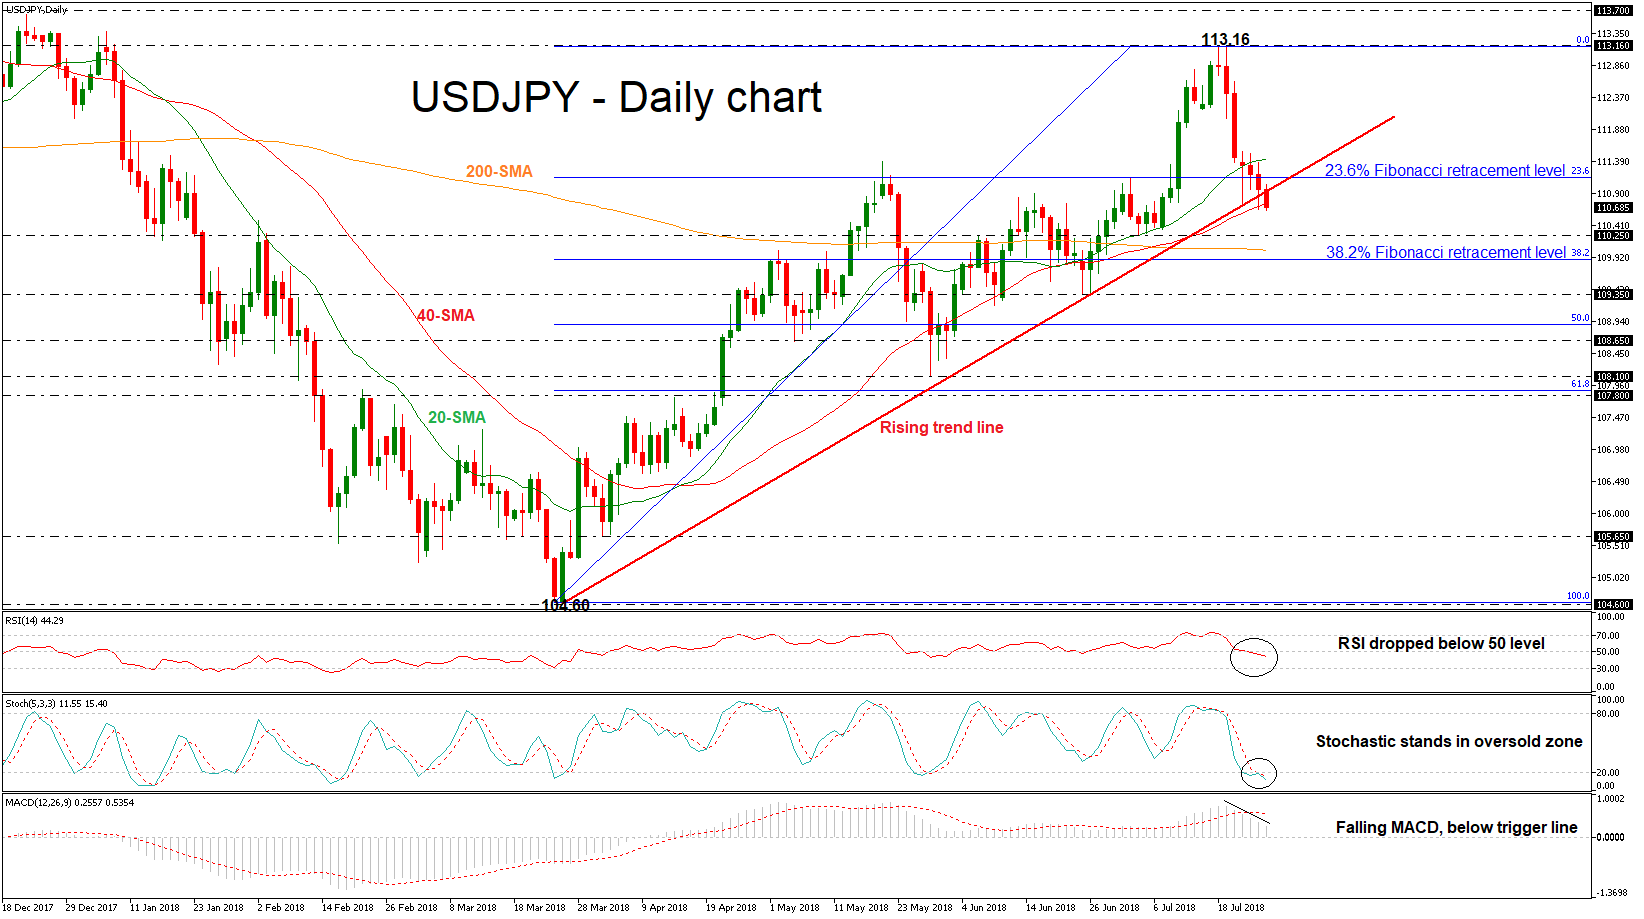
USDJPY Seems To Be In Progress For Further Bearish Pressure, Stands Below Uptrend Line
USDJPY has been underperforming in the past six days following the pullback on the six-month high of 113.16, achieved last Thursday. The prices seem to be in a negative correction mode as it dived below the 20- and 40-simple moving averages (SMAs) in the daily timeframe, suggesting bearish pressure. The short-term technical indicators are bearish and point to more weakness in the market.
Having a look at the momentum indicators, the RSI is moving south below the threshold of 50 and is approaching the 30 level. Moreover, the stochastic oscillator continues the bearish movement and holds in the oversold zone, while the MACD oscillator dropped below its trigger line and is falling in the positive territory with strong momentum.
If price action remains below the short-term moving averages and the 23.6% Fibonacci retracement level of the upleg from 104.60 to 113.16, around 111.14, there is scope to hit the 110.25 support level. Clearing this level would see additional losses towards the 38.2% Fibonacci mark of 109.10 but the price would first need to slip below the 200-day SMA, near the 110.00 psychological level.
However, if the 23.6% Fibonacci resistance fails, then the focus would shift to the upside again towards the 113.16 peak. This is considered to be a strong resistance area which has been rejected a few times in the past. Rising above it would see prices re-testing the 113.70 barrier, taken from high on December 2017.
To sum up, USDJPY is trying to break below the medium-term ascending trend line, which has been holding since March 23 and if there is a closing day below that obstacle would open the way for a new bearish rally.
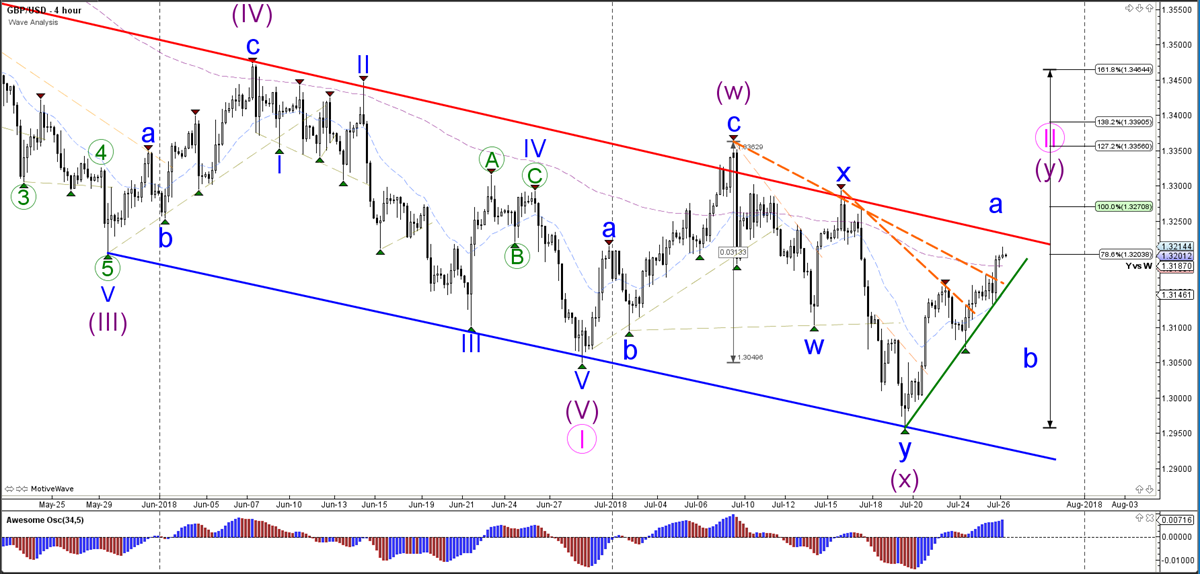
GBP/USD Bullish Breakout Aims At Fib Targets Of Wave 5
The GBP/USD broke above the resistance trend lines (dotted orange) and price is now challenging the top of the downtrend channel (red). A bearish bounce is more likely as price could be completing a wave A of a larger ABC zigzag pattern. A break below the support trend line could confirm the completion of wave A and the start of wave B. Eventually a larger bullish correction is expected to take place within wave Y (purple) if this is wave pattern is correct.
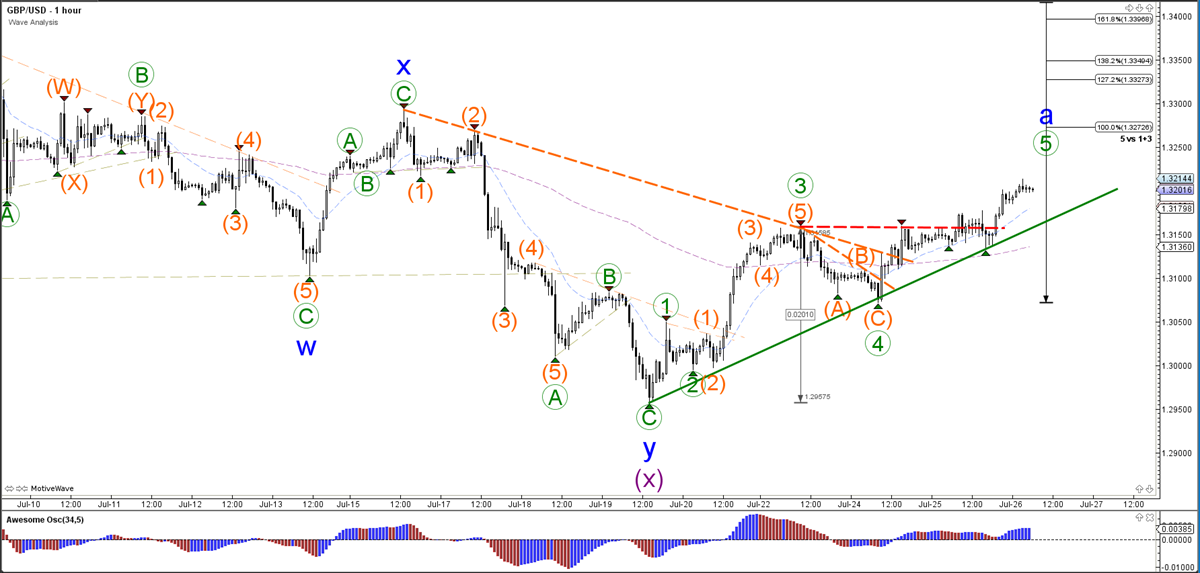
The GBP/USD confirmed the bullish wave 5 (green) pattern when price broke above the resistance trend line (red) yesterday. The bullish break makes an ABC (blue) zigzag pattern likely. Price could move up to the Fibonacci targets of wave 5 if price continues above the consolidation (purple box).
USD/JPY Breaks Supports Line And Starts Wave 5
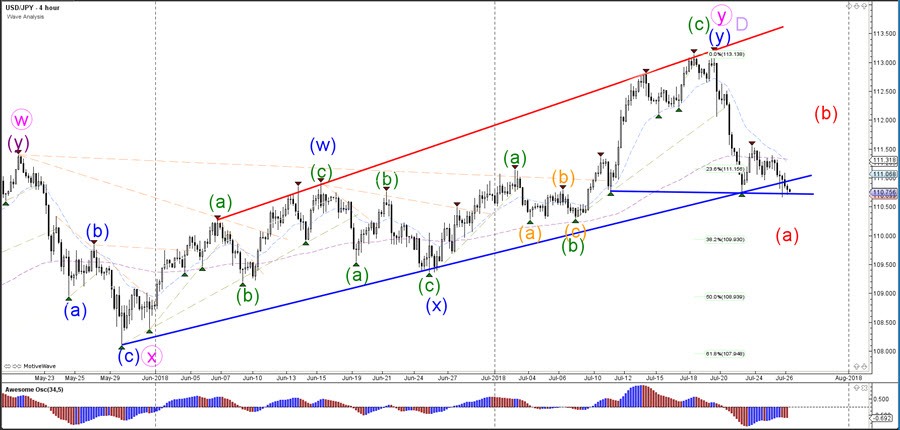
The USD/JPY bearish push lower is indicating that a wave A (red) is most likely still active. Price is now challenging key support trend lines and a breakout could indicate a push lower towards the next Fibonacci level (38.2% Fib).
A bullish bounce however could indicate that wave A (red) has been completed and price could then start an ABC correction within wave B (red). A bearish ABC (red) is expected to complete a larger wave E swing of a larger triangle after price completed wave D (purple) at the recent high.
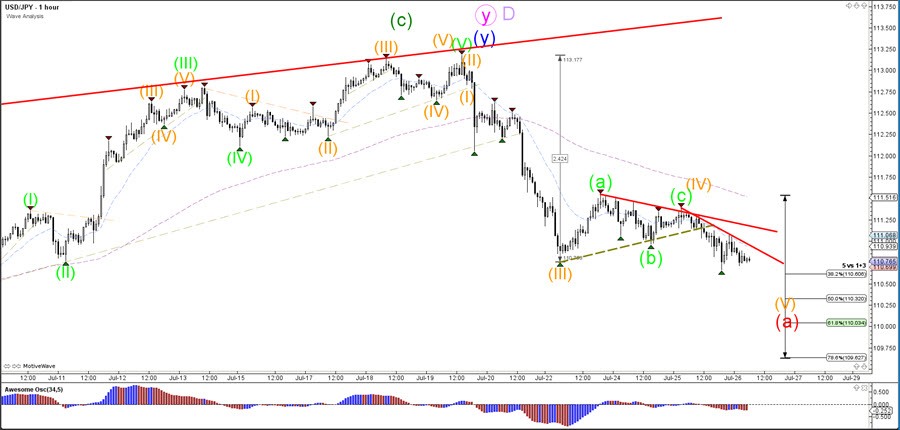
The USD/JPY seems to have completed an ABC (green) sideways correction with wave 4 (orange), which was shallow as it typical for wave 4s. The bearish breakout below the support trend line (dotted green) confirms the bearish continuation within wave 5 (orange) of wave A (red).
The Key Event Later Today Will Be The ECB Meeting
Market movers today
This morning, European markets are set to digest the result of the meeting between EU Commission President Jean-Claude Juncker and US President Donald Trump, see below.
The key event later today will be the ECB meeting. We expect little news but some focus on the uncertainty from trade tensions with the US. We do not expect any big market reaction on the back of the meeting.
In the US, we have releases for durable goods orders, initial jobless claims and trade balance.
In Sweden, NIER consumer and business confidence for June is due to be released. While manufacturing confidence has held up pretty nicely, consumer confidence has weakened significantly in recent months. To be honest we don't really fully understand why consumers have become less upbeat. Some claim that it could have something to with tighter amortisation requirements, but we doubt it since only a relatively small proportion of consumers are affected by that. Other than that, we've seen a pretty big jump in retailers' price plans over the latest couple of months, something that coincides with actual goods prices moving higher too as a result of a weaker SEK. Also, June unemployment data will be released today. We estimate s.a unemployment at 6.0% (prev. 6.1%). June has a big positive seasonal factor so n.s.a unemployment will probably rise to 6.9% (prev. 6.5%).
Norwegian LFS labour market data is also due out. We alongside Norges Bank have for some time preferred the NAV release, as the LFS report has exhibited a large degree of volatility. With above-trend growth, we expect both unemployment rate measures to continue falling.
Selected market news
US President Donald Trump and European Commission President Jean-Claude Juncker have announced that the eurozone and the US will launch a new round of trade negotiations. In a joint statement, the two stated that the negotiations are aimed at (1) eliminating all tariffs, trade barriers and subsidies related to non-auto industrial goods, (2) reforming the WTO and (3) reducing trade barriers in general across the Atlantic. Importantly, all new tariffs (incl. automobile tariffs) will be suspended during the negotiation period thereby dampening near-term trade war fears. The eurozone also pledged to raise its imports of US soybeans and US liquefied natural gas. The announcement was somewhat surprising giving recent rhetoric from both Trump and Juncker. It is, however, still much too early to call this announcement more than a semi-truce even if US equities jumped and USD FX/FI sold off on the announcement.
EUR/GBP has stabilised just below the 0.89 figure after GBP gained on Tuesday on the news that the UK Prime Minister relegated the Brexit Department. We expect EUR/GBP to trade slightly lower going into the Bank of England meeting next week where we expect the BoE to hike the Bank Rate by 25bp. However, given that a rate hike is almost fully discounted in the market, we would expect any rally in GBP to prove short-lived. Hence, we look for EUR/GBP to remain range bound near term with Brexit uncertainty expected to remain a key source of volatility. Longer term, we still expect EUR/GBP to eventually trade lower driven by Brexit clarifications and fundamental valuations. We target EUR/GBP at 0.8650 in 3M, 0.84 in 6M and 0.83 in 12M
EUR/USD Daily Outlook
Daily Pivots: (S1) 1.1682; (P) 1.1711 (R1) 1.1758; More.....
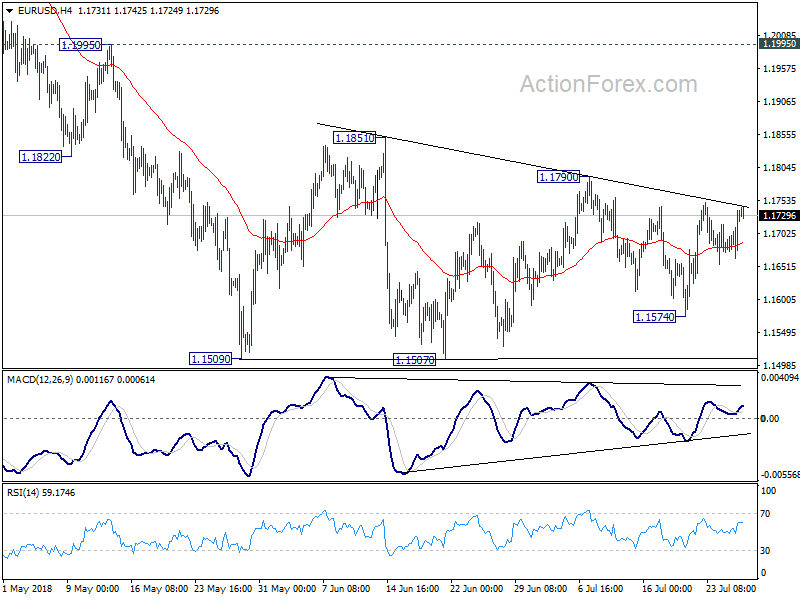
EUR/USD is staying in range above 1.1507/9 and intraday bias remains neutral at this point. Stronger recovery cannot be ruled out as the consolidation extends. But in that case, upside should be limited by 1.1851 resistance to bring fall resumption eventually. On the downside , firm break of 1.1507 will resume larger down trend through 50% retracement of 1.0339 to 1.2555 at 1.1447.
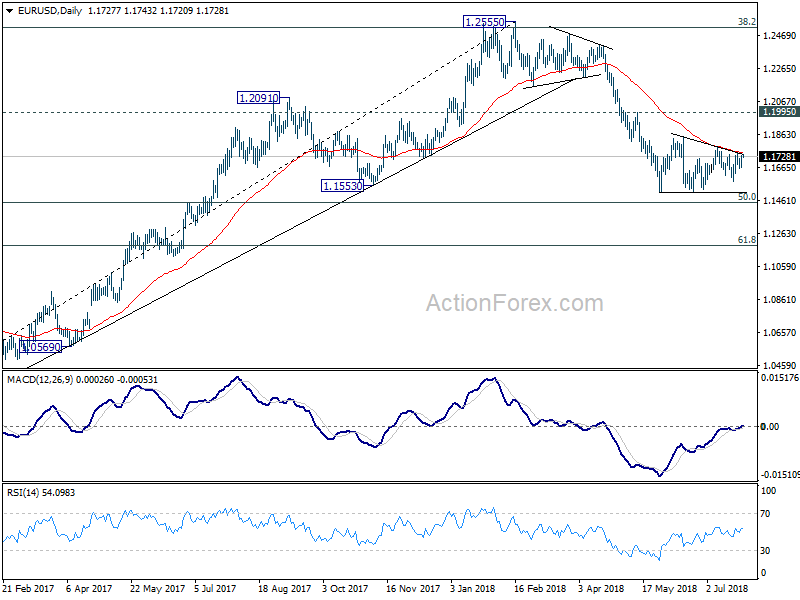
In the bigger picture, EUR/USD was rejected by 38.2% retracement of 1.6039 (2008 high) to 1.0339 (2017 low) at 1.2516. And, a medium term top was formed at 1.2555 already. Decline from there should extend further to 61.8% retracement of 1.0339 to 1.2555 at 1.1186 and below. For now, even in case of rebound, we won't consider the fall from 1.2555 as finished as long as 1.1995 resistance holds.
GBP/USD Daily Outlook
Daily Pivots: (S1) 1.3149; (P) 1.3175; (R1) 1.3217; More...
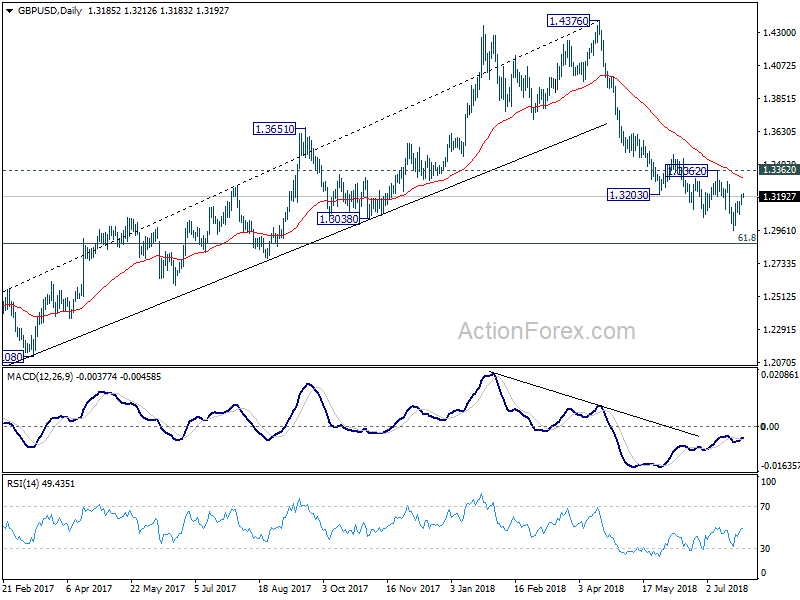
Intraday bias in GBP/USD is mildly on the upside as rebound from 1.2956 is extending. Nonetheless, as it's seen as a corrective move, upside should be limited below 1.3362 resistance to bring fall resumption eventually. On the downside, below 1.3070 minor support will bring retest of 1.2956 first. Break of 1.2956 low will resume the decline from 1.4376 to 1.2874 fibonacci level.
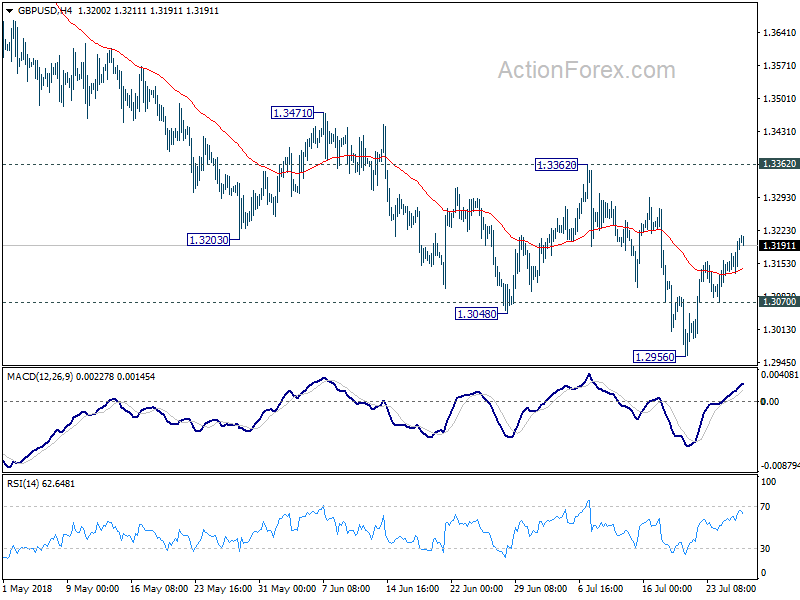
In the bigger picture, whole medium term rebound from 1.1946 (2016 low) should have completed at 1.4376 already, after rejection from 55 month EMA (now at 1.4179). Fall from 1.4376 should extend to 61.8% retracement of 1.1946 (2016 low) to 1.4376 at 1.2874 next. Decisive break of 1.2874 will raise the chance of long term down trend resumption through 1.1946 low. On the upside, break of 1.3362 resistance is needed to be the first indication of medium term bottoming. Otherwise, outlook will remain bearish even in case of strong rebound.