

Sample Category Title
The Analytical Overview of the Main Currency Pairs
The EUR/USD currency pair
Technical indicators of the currency pair:
Prev Open: 1.16417
Open: 1.17261
% chg. over the last day: +0.66
Day's range: 1.17142 – 1.17360
52 wk range: 1.0571 – 1.2557
On Friday, aggressive purchases were observed on the EUR/USD currency pair. The US currency went down after the bold statements by Donald Trump. The growth of quotations exceeded 100 points. At the moment, the key levels of support and resistance are: 1.17100 and 1.17500 respectively. We recommend opening positions from these marks. The further growth of the trading instrument is not excluded.
The news feed on 2018.07.23:
Existing home sales in the US at 17:00 (GMT+3:00).
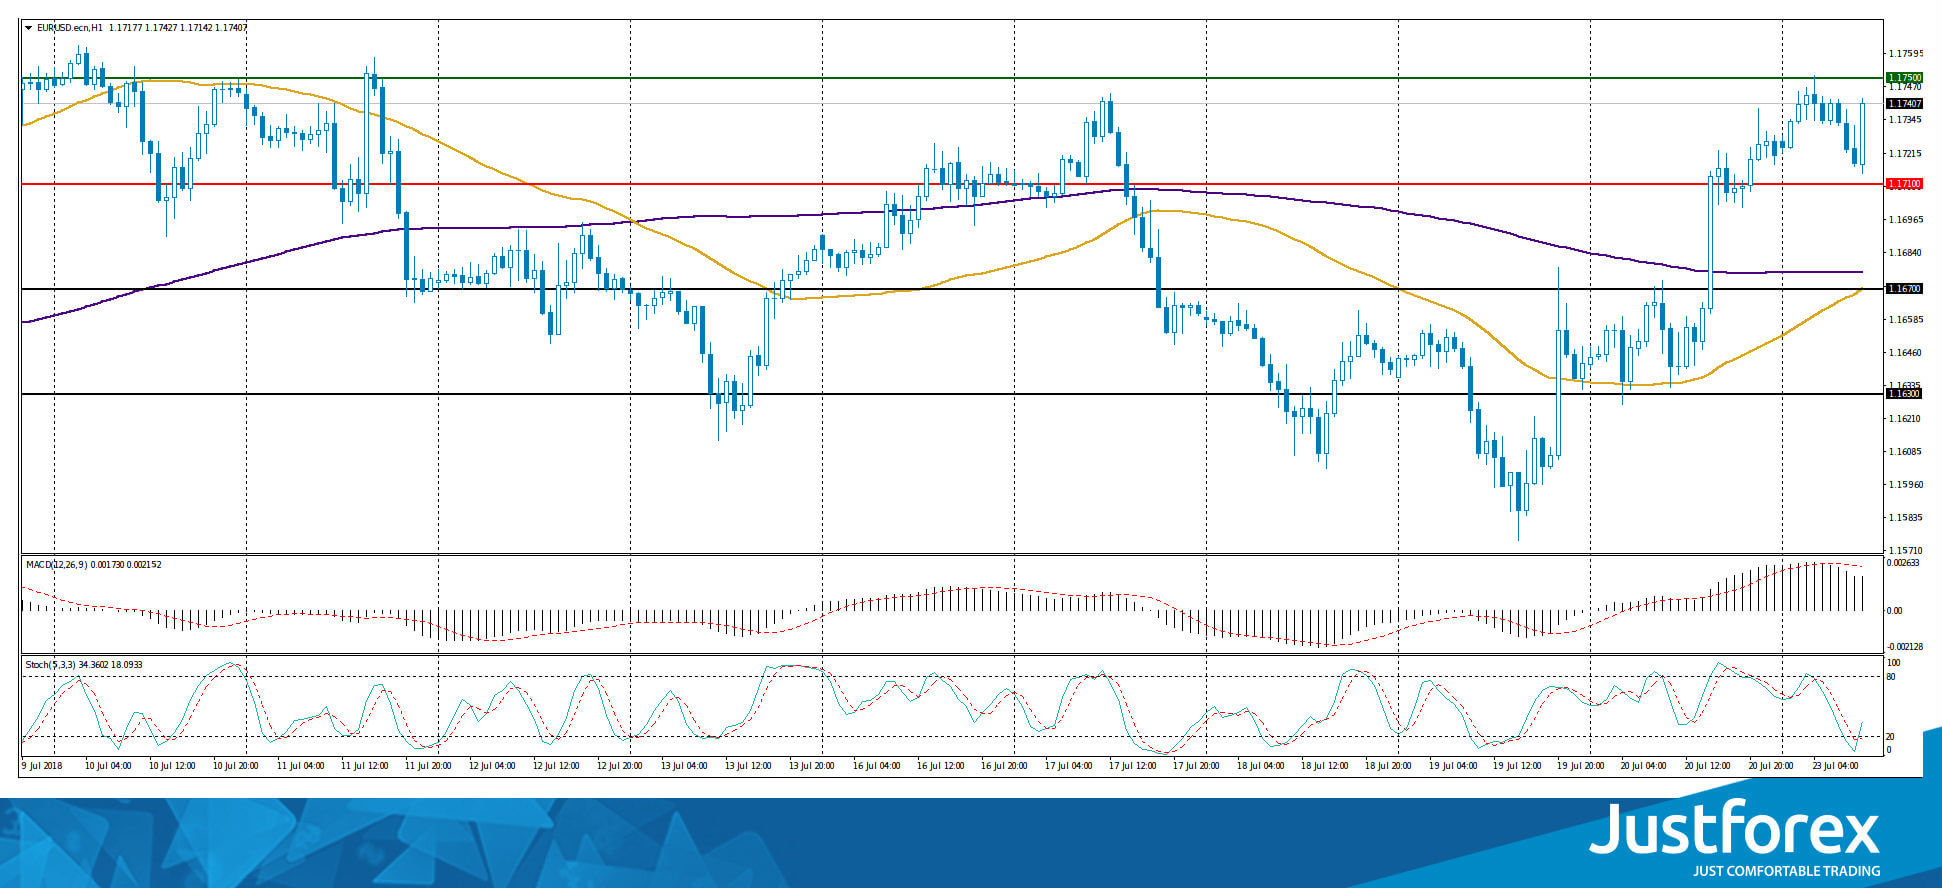
Indicators point to the power of buyers: the price has fixed above 50 MA and 200 MA.
The MACD histogram is located in the positive zone, but below the signal line, which gives a weak signal to buy EUR/USD.
Stochastic Oscillator is in the oversold zone, the %K line is above the %D line, which also indicates the growth of the EUR/USD currency pair.
Trading recommendations
Support levels: 1.17100, 1.16700, 1.16300
Resistance levels: 1.17500, 1.18000
If the price fixes below 1.17100, the EUR/USD correction is expected. The movement is tending to 1.16700-1.16500.
Alternative option. If the price fixes above the resistance level of 1.17500, it is necessary to consider buying EUR/USD. The movement is tending to the round level of 1.18000.
The GBP/USD currency pair
Technical indicators of the currency pair:
Prev Open: 1.30131
Open: 1.31136
% chg. over the last day: +0.92
Day's range: 1.31135 – 1.31311
52 wk range: 1.2361 – 1.4345
On Friday, aggressive purchases were observed on the GBP/USD currency pair. The growth of quotations exceeded 110 points. At the moment, the trading instrument is in a sideways trend. The key support and resistance levels are: 1.31200 and 1.31700, respectively. Positions must be opened from the key levels. The further growth of quotations is not excluded.
The news feed on the UK economy is calm.
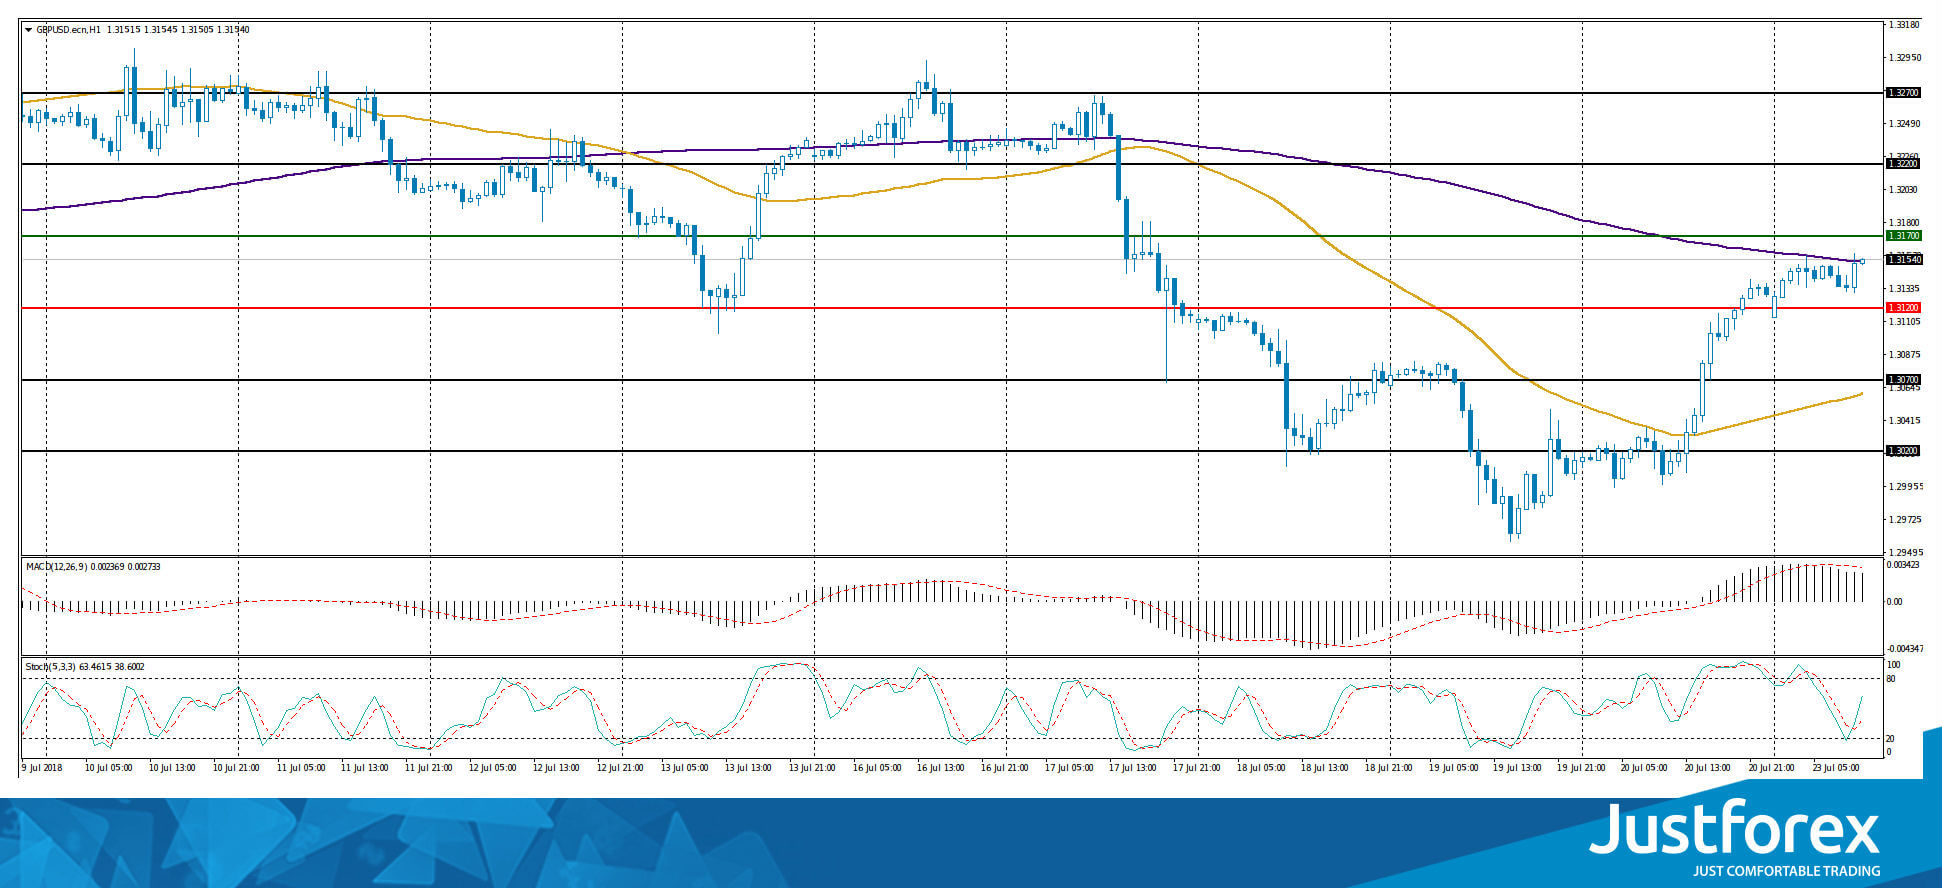
Indicators do not send accurate signals: the price is testing 200 MA.
The MACD histogram is in the positive zone, but below the signal line, which gives a weak signal to buy GBP/USD.
Stochastic Oscillator is located in the neutral zone, the %K line is above the %D line, which also gives a signal to buy GBP/USD.
Trading recommendations
Support levels: 1.31200, 1.30700, 1.30200
Resistance levels: 1.31700, 1.32200, 1.32700
If the price falls below the 1.31200 level, the GBP/USD quotes correction is expected. The potential for movement to 1.30700-1.30500.
Alternative option. If the price fixes above 1.31700, it is necessary to consider buying GBP/USD. The movement is tending to 1.32200-1.32500.
The USD/CAD currency pair
Technical indicators of the currency pair:
Prev Open: 1.32706
Open: 1.31273
% chg. over the last day: -0.90
Day's range: 1.31321 – 1.31421
52 wk range: 1.2059 – 1.3795
On Friday, aggressive sales were observed on the USD/CAD currecny pair. The decrease in quotations exceeded 150 points. Last week, a number of economic reports were published in Canada. The core consumer price index in June was 0.1%. The core retail sales index rose to 1.4% and was above the forecasted value of 0.7%. At the moment, the quotes are in a sideways trend. The key trading range is 1.31200-1.31500. In the near future, a technical correction is not ruled out. Positions need to be opened from the key levels of support and resistance.
Important news from Canada is not expected today.
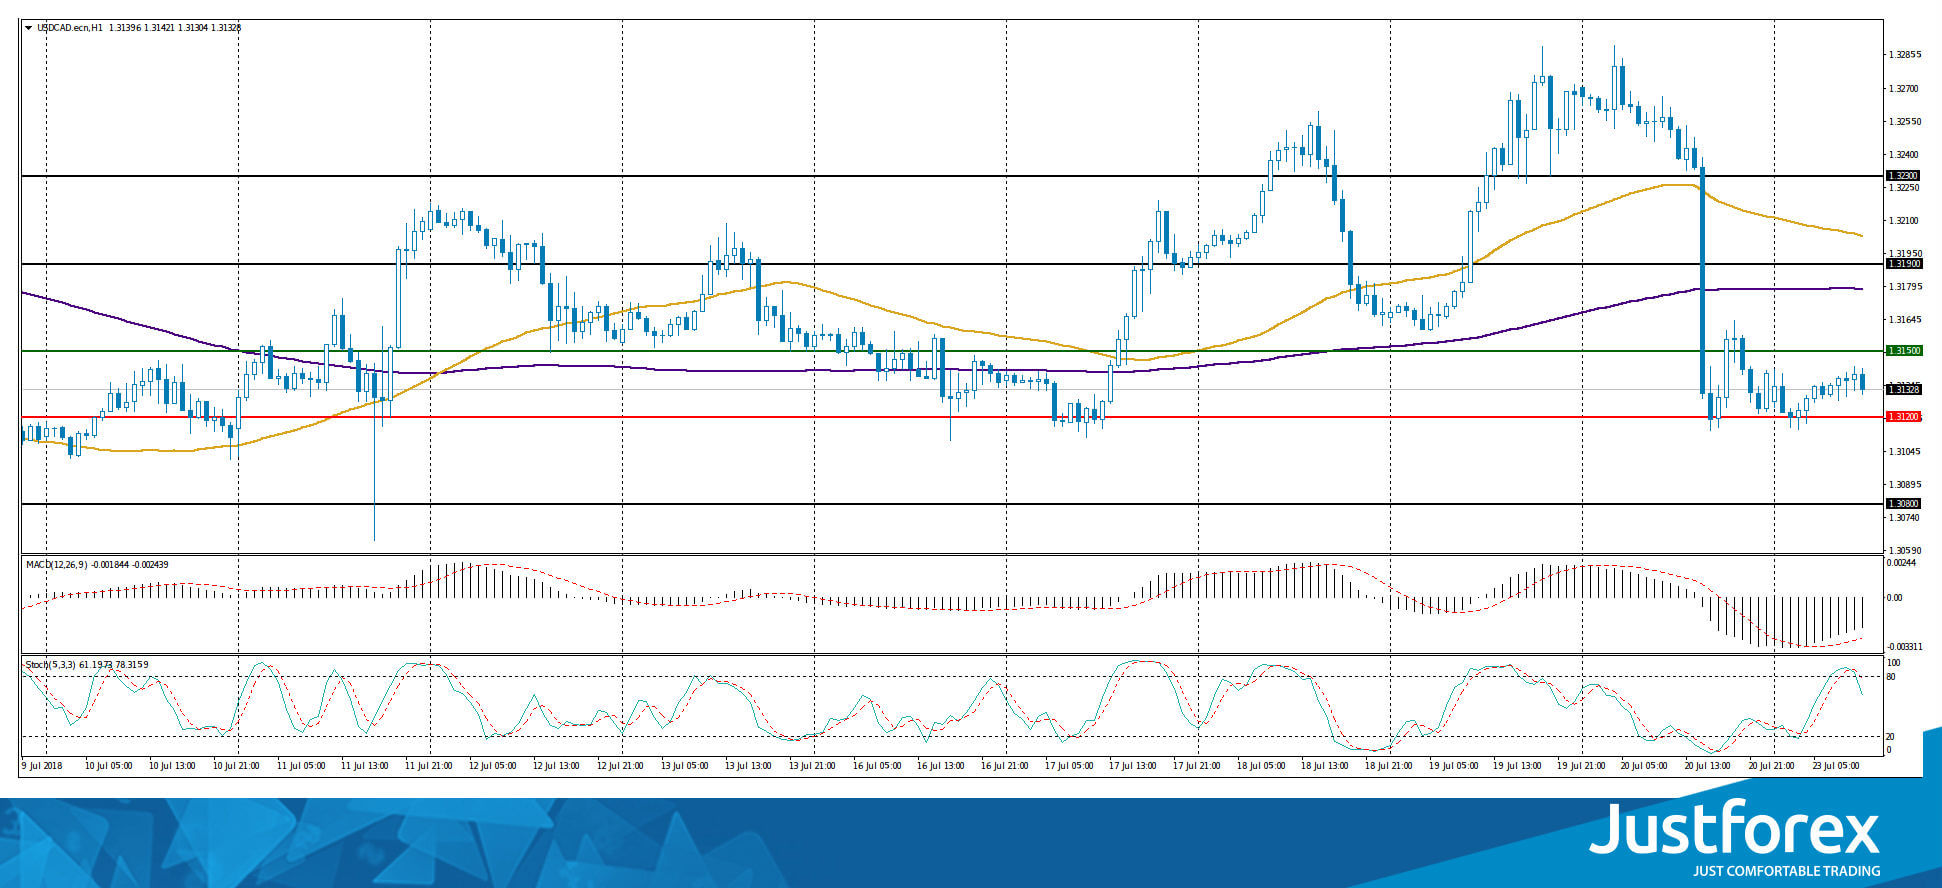
The price has fixed below 50 MA and 200 MA, which indicates the power of sellers.
The MACD histogram is in the negative zone, but above the signal line, which gives a weak signal to sell USD/CAD.
Stochastic Oscillator is leaving the overbought zone, the %K line is below the %D line, which indicates the bearish sentiment.
Trading recommendations
Support levels: 1.31200, 1.30800
Resistance levels: 1.31500, 1.31900, 1.32300
If the price fixes below the support level of 1.31200, further reduction of the currency pair is expected. The movement is tending to 1.30800-1.30600.
If the price fixes above the level of 1.31500, you need to look for entry points to the market to open long positions. The target movement level is 1.31900-1.32100.
The USD/JPY currency pair
Technical indicators of the currency pair:
Prev Open: 112.430
Open: 111.371
% chg. over the last day: -0.94
Day's range: 110.913 – 110.973
52 wk range: 104.56 – 114.74
On Friday, the USD/JPY quotes dropped significantly. The decrease in the currency pair exceeded 150 points. At the moment the quotes are consolidating in the range of 110.800-111.150. In the near future, a technical correction is not ruled out. We recommend opening positions from the key support and resistance levels. It is also necessary to pay attention to the yield of US 10-year government bonds.
The news feed on the economy of Japan is calm.
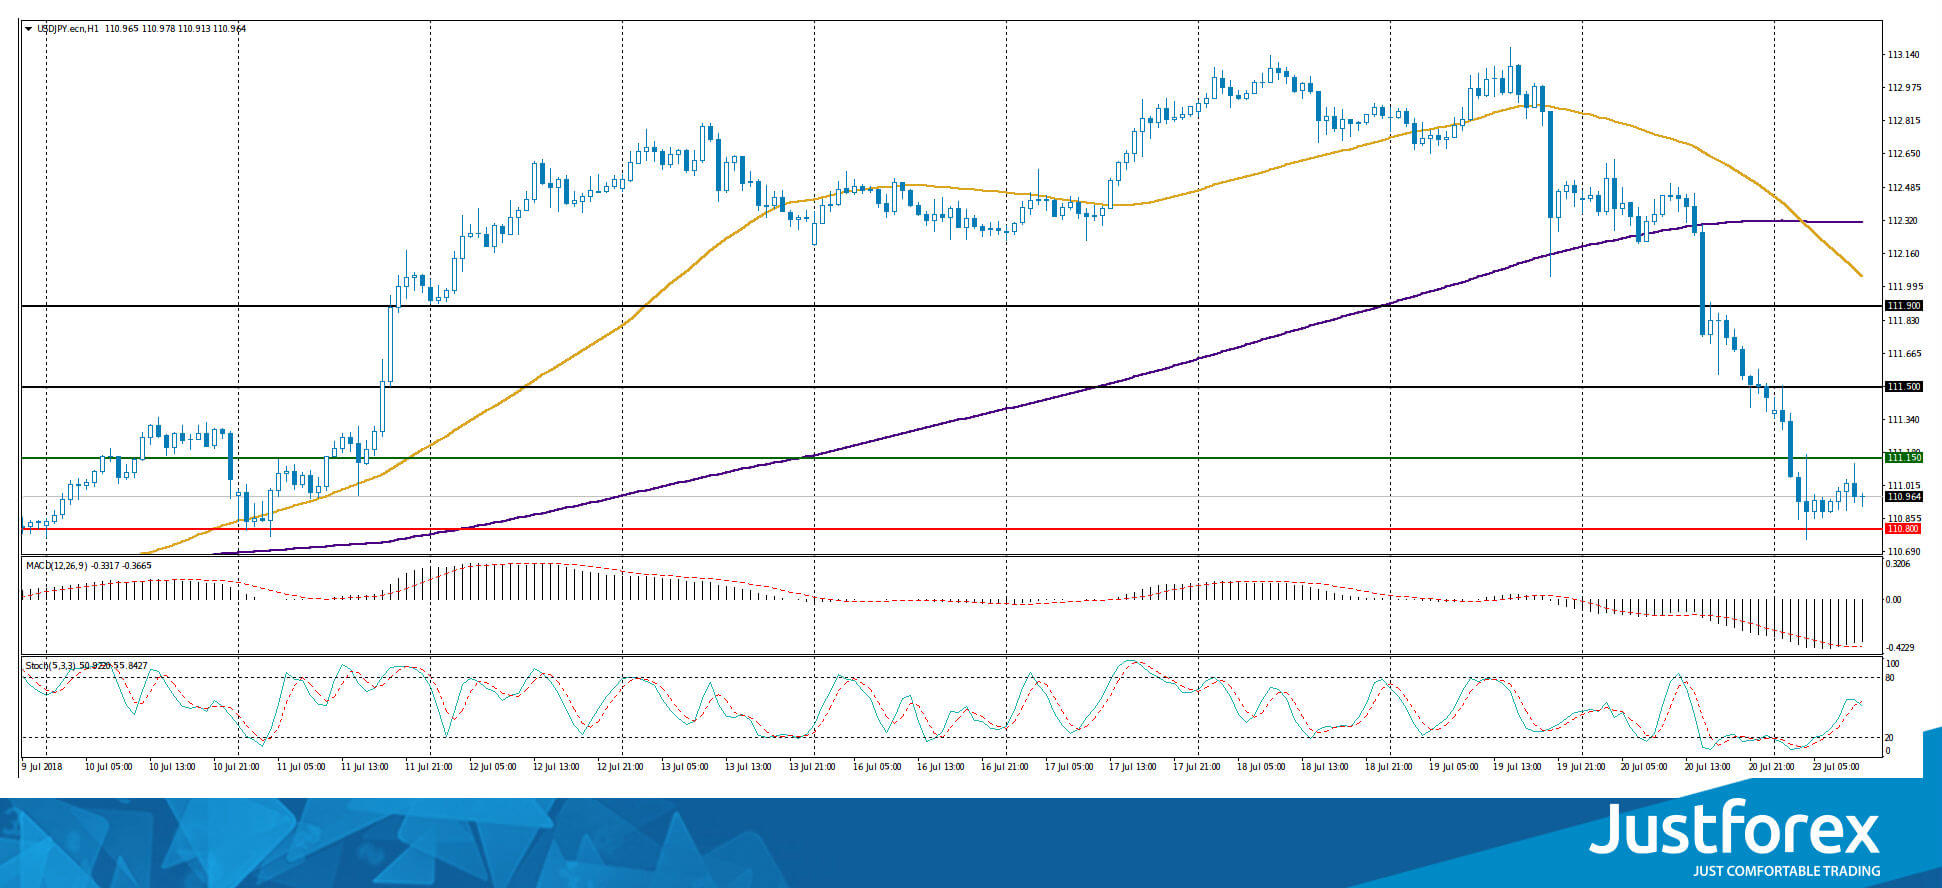
The price has fixed below 50 MA and 200 MA, which indicates the power of buyers.
The MACD histogram is in the negative zone, but above the signal line, which gives a weak signal to sell USD/JPY.
Stochastic Oscillator is located in the neutral zone, the %K line has crossed the %D line. There are no accurate signals.
Trading recommendations
Support levels: 110.800, 110.400
Resistance levels: 111.150, 111.500, 111.900
If the price fixes below the 110.800 level, further decrease of the USD/JPY currency pair is expected. The movement is tending to 110.400-110.200.
Alternative option. If the price fixes above the level of 111.150, it is necessary to consider buying USD/JPY. The movement is tending to 111.500-111.700.
EUR/USD Approaches Trend-Line
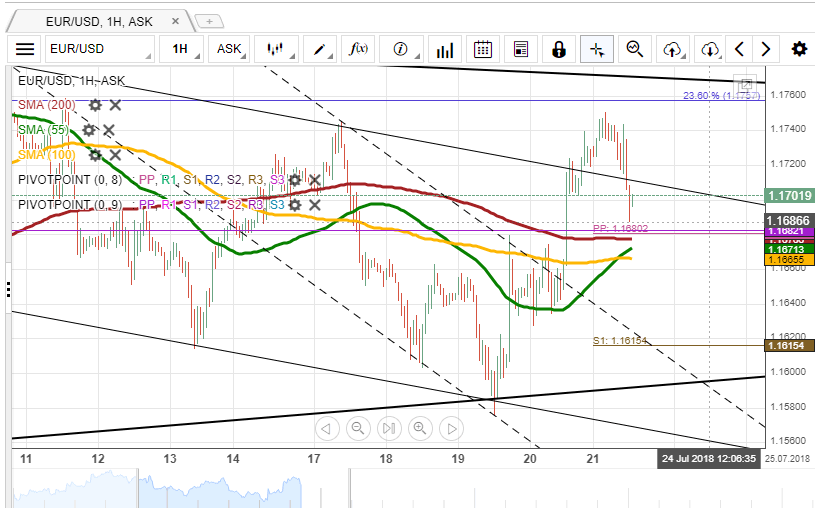
The last two trading days were beneficial for the EUR/USD exchange rate, with it edging 1.36% higher. During this time, the pair surpassed the 55-, 100– and 200-hour SMAs and breached a two-week channel down. This bullish sentiment was strengthened on Friday following the US President Donald Trump's comments of the strong US Dollar.
By Monday morning, the Euro had reached the combined resistance of the 23.60% Fibonacci retracement, a trend-line and the weekly R1 in the 1.1755/1.1800 range. Technical indicators flash bearish signals, demonstrating that the rate should respect this cluster and move lower.
Given that no important fundamental releases are scheduled today, it is unlikely that the 1.1680 mark is breached due to various SMAs located there.
GBP/USD Allays After Surge
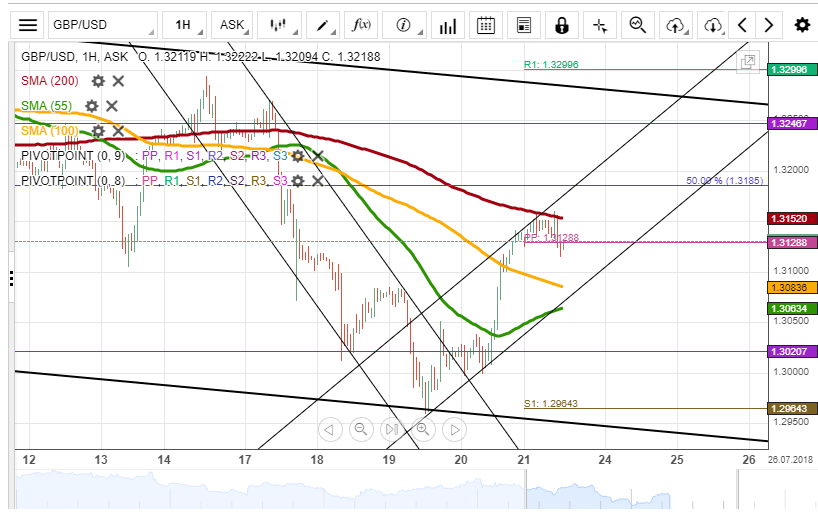
The combined resistance of the 55-hour SMA and the monthly S1 restricted the Pound from moving above 1.3050 early on Friday.
The necessary bullish sentiment was provided during the second part of the day caused by comments from the President Donald Trump on the strong US Dollar. This allowed the pair to surge 1.10%, being stopped solely early on Monday when it hit the 200-hour and 55-period (4H) SMAs at 1.3155.
The pair being unable to move past this cluster might point either to a decline or a movement sideways in this session. Technical indicators being located in the overbought territory support the bearish scenario.
In case of a fall, the Sterling would be sent back to the 55– and 100-hour SMAs at 1.3050. The monthly S1 is likewise located nearby.
USD/JPY Likely To Edge Upwards
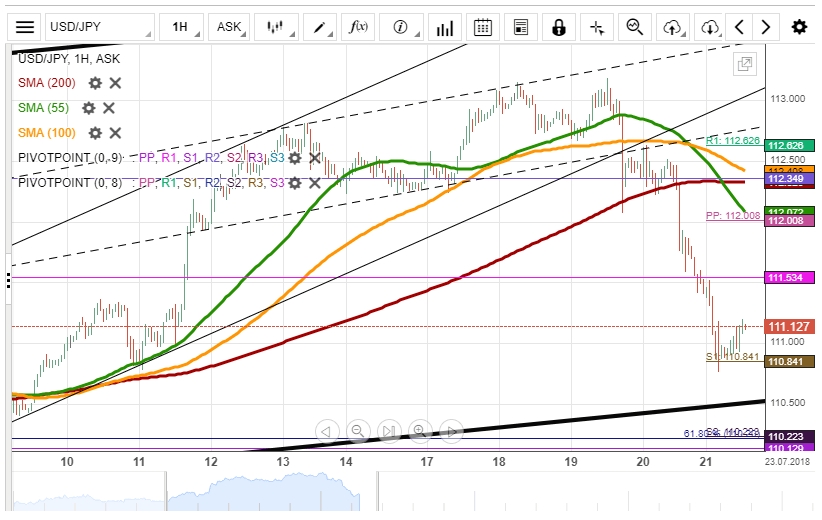
The global weakening of the US Dollar caused a 0.90% plunge for the USD/JPY exchange rate on Friday. This bearish sentiment did not allay this morning, thus adding 62 pips to the full decline.
At the time of this analysis, the rate was lingering near the weekly S1 and the 200-period (4H) SMA at 110.85. The bottom boundary of a four-month channel is likewise located near this area. The given plunge has sent technical indicators in the strongly oversold territory, thus giving bulls the opportunity to regain some of their lost positions.
If no fundamentals pressure the rate, it is unlikely that the US Dollar falls even lower. The nearest resistance is the 100-period SMA and the monthly R1 at 111.50, while the ultimate goal for this session is the 112.35 area.
XAU/USD Recovers From 1,215.00
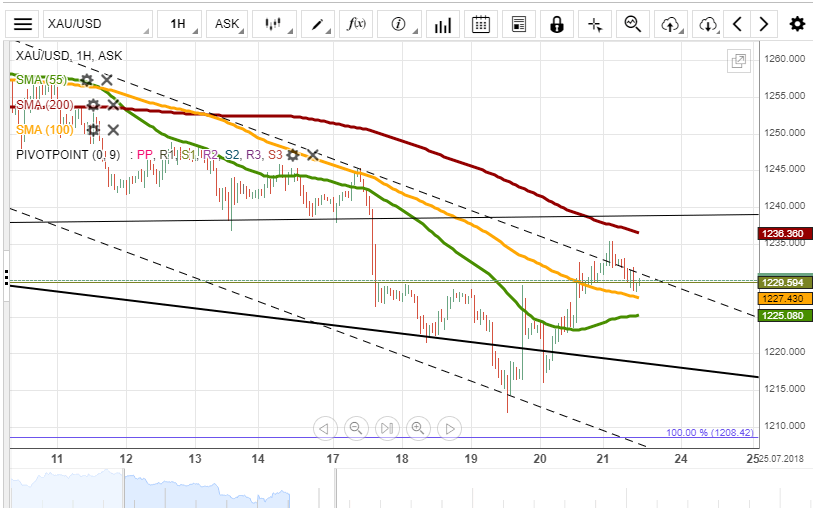
Gold grew stronger against the US Dollar on Friday, being boosted by fundamental events. As a result, it returned in the breached senior channel and subsequently surpassed the 55– and 100-hour SMAs.
It is likely that the yellow metal edges higher during the following hours, supported by the 100-hour SMA. This appreciation might not be long-lived due to the 55– and 100-period (4H) and the 200-hour ones located in the 1,240.00 area. This resistance cluster is expected to pressure the pair south down to the aforementioned 55– and 100-hour moving averages circa 1,225.00.
In case 1,240.00 is breached to the upside, no resistance is apparent until 1,265.00.
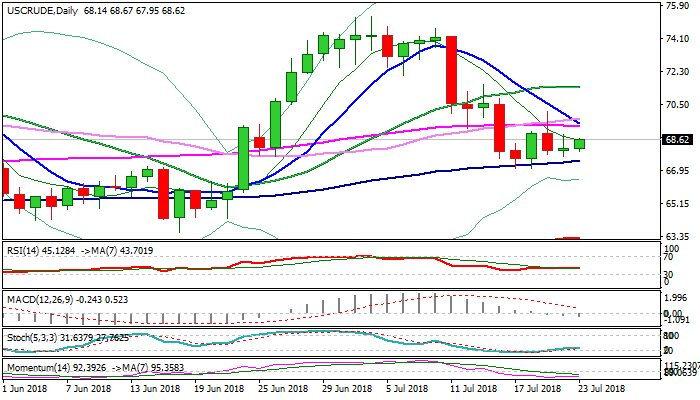
WTI Oil Outlook: Downside Pressure Eases But Directionless While Between 100/55SMA’s
WTI oil price moved higher on Monday after Friday's trading ended in Doji with long upper shadow, signaling stabilization and sidelining downside risk.
Oil price rose after weekend's G20 meeting pointed on rising concerns about global growth risks which would hit demand, as well significant cut in US oil rigs (the biggest since March).
However, near-term action is still directionless and holding within congestion between 100SMA ($67.46) and 55SMA ($69.34), with break of either side required to generate firmer direction signal.
Overall negative daily techs keep the downside at risk, while improving sentiment underpins near-term action.
Bullish scenario on sustained break above converging 55/10SMA's would neutralize downside risk and expose pivotal barriers at $70.00/20 (psychological / Fibo 38.2% of $75.34/$67.03 bear-leg).
Break here would signal bullish extension towards next breakpoint at $71.44 (20SMA).
Conversely, violation of rising 100SMA ($67.46) and thin daily cloud ($67.34/$67.11) would risk break through $67.02 double-bottom and continuation of downtrend from $75.34 (04 July high).
Res: 68.89, 69.34, 70.00, 70.20
Sup: 67.95, 67.46, 67.02, 66.36
Forex Technical Analysis: EUR/USD, USD/JPY, GBP/USD
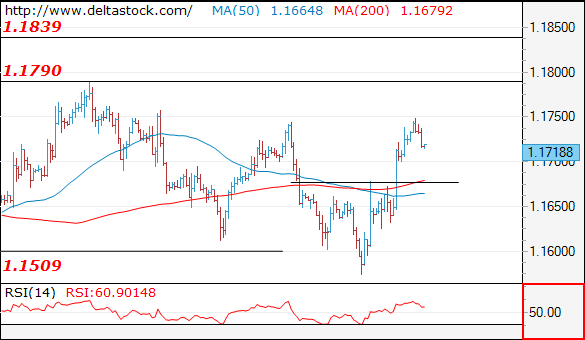
EUR/USD
Current level - 1.1718
Friday's rise peaked at 1.1750 resistance and the outlook remains positive above 1.1670 static support, for another leg upwards, to 1.1790 and even 1.1830.
| Resistance | Support | ||
| intraday | intraweek | intraday | intraweek |
| 1.1750 | 1.1750 | 1.1670 | 1.1510 |
| 1.1790 | 1.1830 | 1.1570 | 1.1300 |
USD/JPY
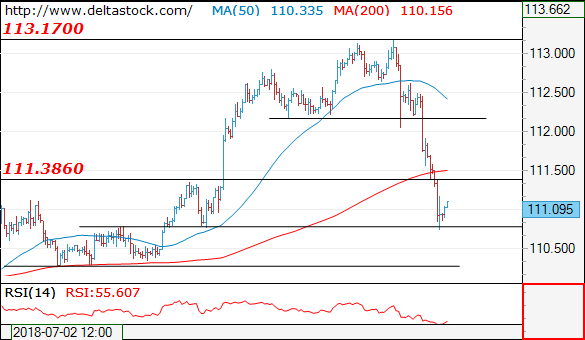
Current level - 111.09
The massive sell-off broke through 111.40 support, reaching a temporary low at 110.70. The bias remains bearish below 111.40, for 110.25.
| Resistance | Support | ||
| intraday | intraweek | intraday | intraweek |
| 111.40 | 114.50 | 110.70 | 110.25 |
| 112.10 | 114.50 | 110.25 | 109.30 |
GBP/USD
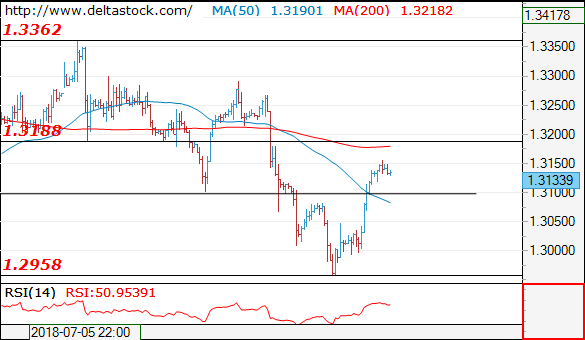
Current level - 1.3133
The violation of 1.3080 crucial peak signals a positive bias, for a test of 1.3190.
| Resistance | Support | ||
| intraday | intraweek | intraday | intraweek |
| 1.3190 | 1.3460 | 1.3080 | 1.2960 |
| 1.3360 | 1.3620 | 1.2960 | 1.2770 |
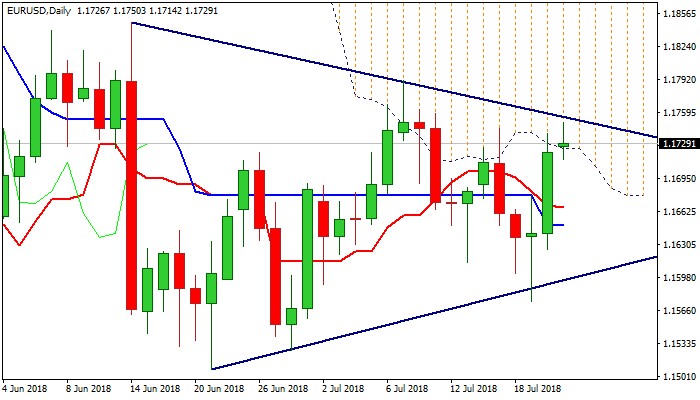
EURUSD Outlook: Extension Of Friday’s Strong Rally Probes Into Thick Daily Cloud
The Euro probes into thick daily cloud on Monday, in extension of strong rally last Friday which completed Doji reversal pattern on daily chart.
Extended weakness of the dollar keeps the single currency supported, along with bullish techs, but bulls need close in the cloud (cloud base lays at 1.1724) and break above 1.1754 (triangle resistance), to generate bullish signal for recovery extension.
Risk of recovery stall exists as very thick falling daily cloud continues to weigh heavily and has already capped several attempts to break higher.
Broken 55SMA (1.1708) holds today's action and marks pivotal support, loss of which would generate initial bearish signal.
Res: 1.1754, 1.1790, 1.1848, 1.1873
Sup: 1.1708, 1.1686, 1.1663, 1.1621
Yen Up As Japan Re-Thinks QE Bond Buying
JPY better bid as BoJ is expected to re-think its QE program
The week gets off to a slow start as investors continue to focus on trade war developments. Donald Trump did not just sit around over the weekend. Indeed, beside the fact that he showed no sign of backing down in its trade rhetoric with China and Europe, President Trump responded violently to Iranian President Rouhani in an all-caps tweet. Market participants appeared to be not too concerned about rapid escalation in rhetoric. After all, the market is used to Trump’s sense of exaggeration. Last summer, he promised “fire and fury” to North Korea, a year later Kim and Donald are best friends and North Korea has not shut down nuclear production yet.
Within the G10 complex, the Japanese yen rose the most against the USD with USD/JPY easing to 110.75, the lowest level since July 11th. Over the last two days, the yen appreciated more than 2% amid rumours that the BoJ is considering modifications to quantitative easing programme. Indeed, Kuroda has promised that the 2% inflation target would be hit by 2015… USD/JPY bounced back on the 110.77 support (low from July 11th) and consolidated around 111. On the downside, the low from July 4th (110.28) will act as next support. The Swiss franc also resisted quite well as USD/CHF slid to 0.9915.
Oil paves the way for a third weekly loss amid oversupply concerns
Rising on Friday due to an OPEC report mentioning that the organization will reduce exports for the month of August, Brent crude and West Texas Intermediate (WTI) closed the week at USD 73.07 and 70.46 respectively amid easing concerns of oversupply in the marketplace. However, the trend is changing now, as crude oil prices are on track for a third weekly loss.
Indeed, as G20 Finance Ministers warn of downside risk on global growth due to imposing tariffs from both US and China side, fears of lower oil demand is rising. US oil rigs targeting declined most since March 2018, thus strengthening the tendency of lower demand from the world’s largest oil users.
Trading below the highs of June, both oil benchmarks as well as other commodity prices are expected to be driven by geopolitics, which is not going to reduce, following Trump’s threats towards Iran and tariffs on all USD 500 billion of Chinese imports.
Currently declining due to further concerns, WTI is trading at 68.14, approaching the 67.95 range. Brent crude futures in Europe and Shanghai Crude trade at USD 73.05 and CNY 491.70 respectively and are heading along USD 73.25 and CNY 495.
The American Currency Has Moved Down
Last week, the US dollar started declining against the basket of major currencies. On Friday, US President Donald Trump said in an interview with CNBC that he was ready to impose additional duties on imports of Chinese goods in the amount of $500 billion a year. Also, the US president expressed dissatisfaction with the Fed's monetary policy, noting that the central bank's plans to raise interest rates hamper the strengthening of the US economy. The US dollar index (#DX) finished the week with a significant decrease (-0.75%).
On Friday, a number of economic reports were also published in Canada. The core consumer price index in June was 0.1%. The core retail sales index rose to 1.4% and was above the forecasted value of 0.7%. This week, investors are waiting for a decision on the interest rate by ECB, which will be made on Thursday, July 26.
The "black gold" prices are consolidating. At the moment, futures for the WTI crude oil are testing the mark of $68.00 per barrel.
Market Indicators
On Friday, sales were observed on the US stock market: #SPY (-0.11%), #DIA (-0.14%), #QQQ (-0.02%).
At the moment, the yield of 10-year US government bonds is at the level of 2.88-2.89%.
The news feed on 2018.07.23:
Existing home sales in the US at 17:00 (GMT+3:00).