Sample Category Title
USDJPY Outlook: Holds In Red For The Third Straight Day, Hits Two-Week Low On Trumps Comments
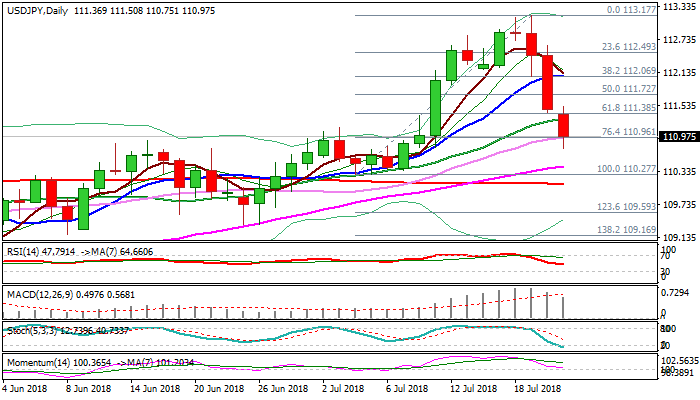
The pair fell to two-week low at 110.75 in early Monday's trading, extending last Thu/Fri strong weakness, sparked by President Trump's criticism of high dollar Fed's tightening. Trump's messages over the weekend, when he criticized the Fed and global monetary policy, as well as accusing the European Union and China of manipulating their currencies, put the greenback under fresh pressure. Extension of last week's strong fall broke below pivotal supports at 111.38/30 (Fibo 61.8% / 20SMA) and stretched below 76.4% of 110.27/113.17 bull-leg. Near-term focus turns towards key supports at 110.10 (200SMA), 110.00 (psychological) and 109.90 (daily cloud top), but oversold conditions signal bears may take a breather before attack. Broken 20SMA marks initial resistance, with extended upticks expected to hold below 112.00 (broken daily Tenkan-sen / 10SMA) to keep bears in play. Close below 110.38/30 would generate fresh bearish signal and risk further weakness, as techs are bearish and near-term sentiment remains negative.
Res: 111.30, 111.72, 112.07, 112.62
Sup: 110.75, 110.42, 110.10, 109.90
GBPUSD Outlook: Bullish Engulfing Underpins Recovery But Plethora Of MA’s Mark Strong Barriers
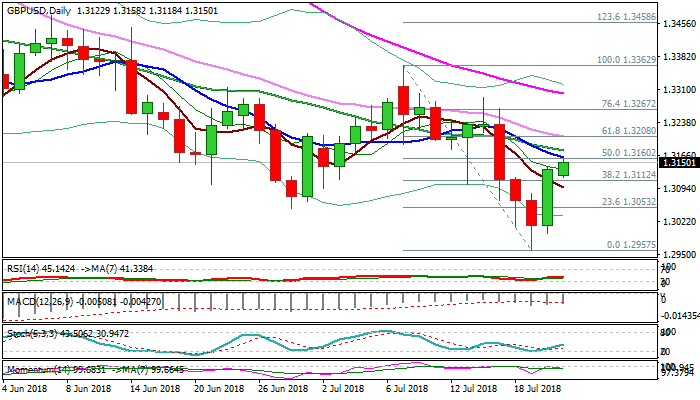
Cable holds firm tone on Monday and extends last Friday's strong rally, which formed bullish engulfing pattern on daily chart and underpinning the advance. Sentiment is mixed as Brexit talks continue to weigh while further dollar's weakness underpins in the near-term. Monday's rally was so far capped by falling 10SMA (1.3163, also 50% of 1.3362/1.2957 bear-leg) which also marks the lower side of a cluster of MA's (10;20;30) between 1.3163 and 1.3207. Bulls need to clearly break above 1.3207 (30SMA/Fibo 61.8%) to generate fresh bullish signal for extension of recovery from 1.2957. Mixed daily studies provide no clear signal but risk of recovery stall exists as falling thick daily cloud continues to weigh. Return and close below falling 5SMA (1.3096) would signal an end of recovery phase and shift focus lower.
Res: 1.3163, 1.3207, 1.3267, 1.3301
Sup: 1.3118, 1.3096, 1.3049, 1.3000
XAUUSD Intraday Analysis
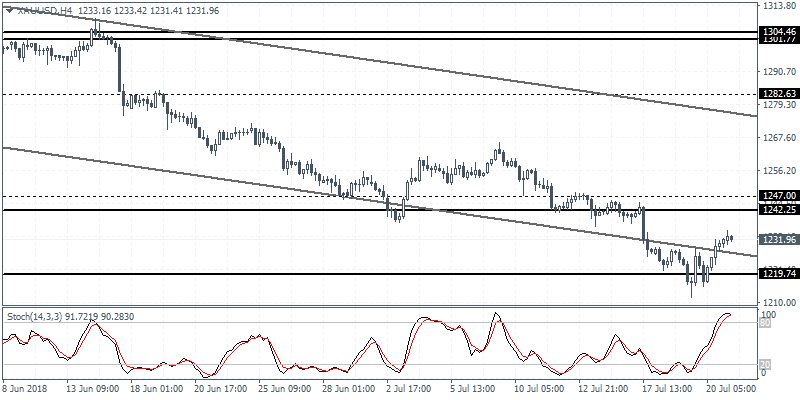
XAUUSD (1231.96): Gold prices were seen extending the gains after the doji pattern that was formed last week. After a modest period of consolidation near the 1219 level, gold prices eventually broke back into the falling price channel. With the 4-hour chart signaling a possible hidden bearish divergence, we expect price action to push lower. However, the declines are likely to be limited. To the upside, the major resistance level at 1242 - 1247 is likely to be the upside target.
USDJPY Intraday Analysis
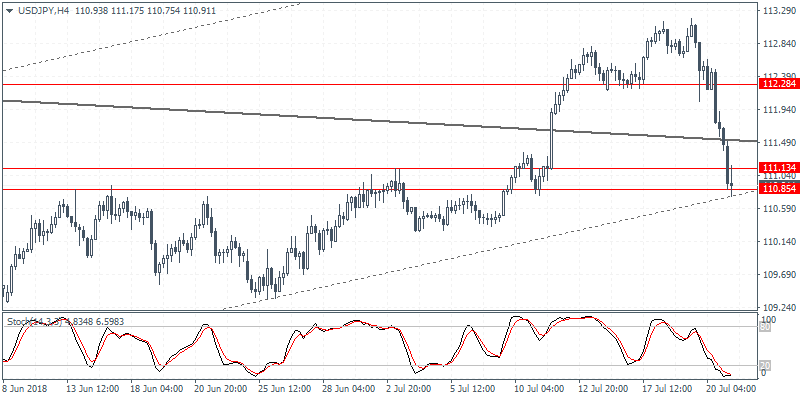
USDJPY (110.91): The USDJPY extended strong losses on Friday as anticipated. The break down below the 112.28 level saw price action posting strong declines as a result. Friday's price action saw prices testing the major falling trend line that was breached. This is likely to act as a dynamic support in the near term. A break down below this level is required which could push the currency pair lower to the next main support at 111.13 - 110.85 level.
EURUSD Intraday Analysis
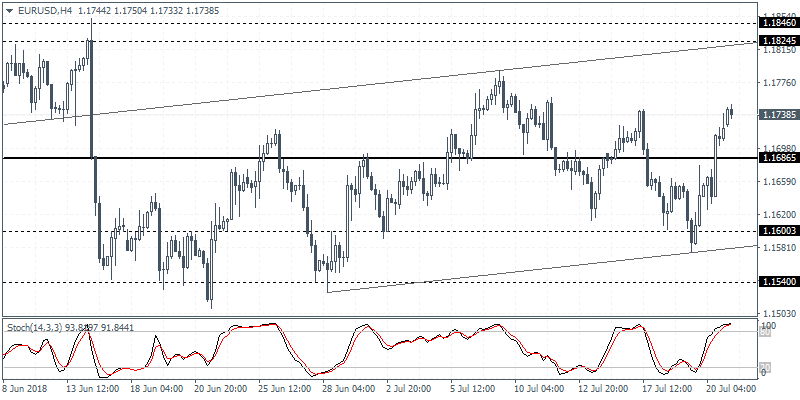
EURUSD (1.1728): The EURUSD currency pair was seen closing near the previous resistance level of 1.1730 on Friday before slightly pulling back. The currency pair is expected to breakout from this resistance level in the near term if the bullish momentum continues. To the upside, the common currency could be seen extending the gains toward the next main resistance level of 1.1960 - 1.1920 level. On the 4-hour chart time frame, price action continues to remain trading sideways. The breach of the minor support/resistance level suggests a pull back to 1.1686 ahead of further gains.
USD Slips After Trump’s Comments On Friday
The U.S. dollar was seen weakening on Friday after the U.S. President Trump commented about the currency's strength. Trump said that China and the EU, among other countries were manipulating their currencies and interest rates lower. In contrast he said that the U.S. was hiking interest rates while the dollar gets stronger with each passing day.
Earlier last week, Trump also expressed his views about the Federal Reserve noting that the central bank should stop tightening monetary policy.
Economic data from Friday revealed that Canada's inflation rate advanced 1.4%, beating estimates of a 0.6% increase.
Looking ahead, the economic data for the day is relatively quiet. The U.S. existing home sales report is due today with forecasts showing an increase of 5.46 million. In the Eurozone, the consumer confidence report is expected to remain unchanged at -1.
EURUSD Rises Back Above SMAs But Limited Gains Are Expected
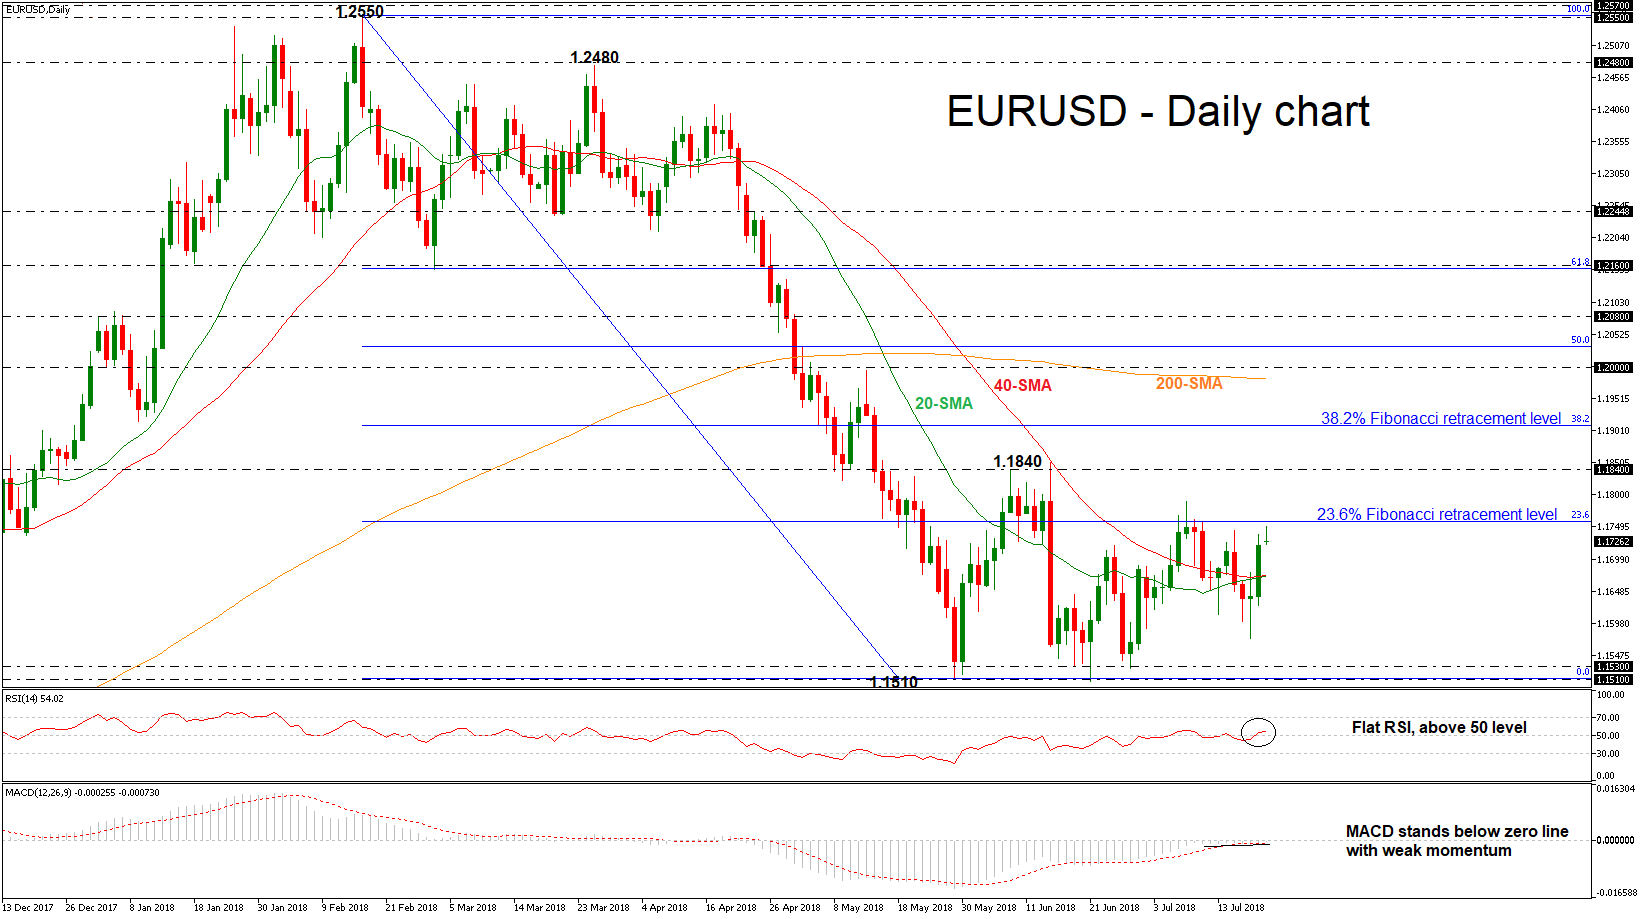
EURUSD is holding below the strong resistance obstacle of the 23.6% Fibonacci retracement level around 1.1760, over the last month. However, over Friday’s trading session the world’s most traded currency surpassed the 20- and 40-simple moving averages (SMAs) in the daily timeframe, indicating a possible upside correction.
Having a look at the technical indicators, the RSI is flattening slightly above the threshold of 50, while the MACD oscillator failed to jump into the positive territory but still stands above the trigger line. It is worth mentioning that the moving averages are in the process of posting a bullish crossover in the near term indicating further possible gains.
A bullish rally is likely to find resistance at the aforementioned strong barrier of the 23.6% Fibonacci mark (1.1760) before being able to re-challenge the 1.1840 key level, taken from the June 7 high. Rising above this area would help shift the focus to the upside towards the 38.2% Fibonacci of 1.1910. Breaking this level could see a touch of the 1.2000 psychological level, which stands near the 200-SMA in the medium-term.
Conversely, if the price dives below the short-term moving averages, the bearish phase would remain in play especially if the price hit again the 1.1510 – 1.1530 support zone. Clearing this area would see additional losses towards the 1.1300 handle, identified by the high on November 2016.
To sum up, EURUSD would be stuck in a sideways channel in the short term if it hits again the 1.1840 resistance and reverses lower again. Though, a climb above this level could endorse the scenario for a period of gains.
Gold Retreats Below 40-SMA, Bearish Picture Remains In Long Term
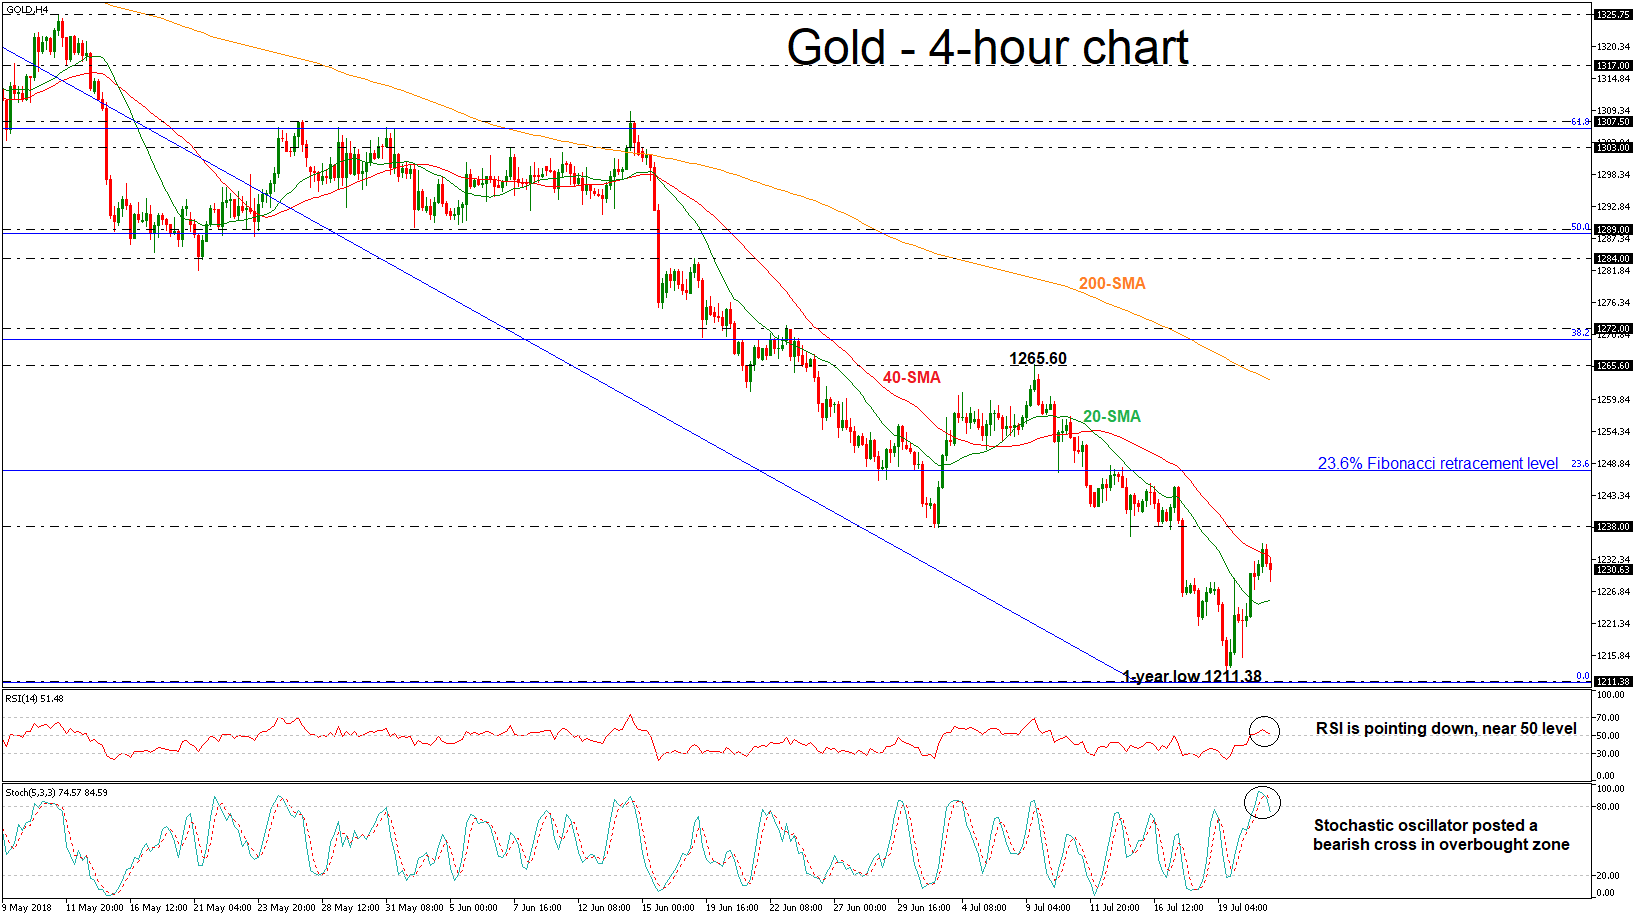
Gold eases on Monday's session after an aggressive buying interest in the previous day after the rebound on the one-year low of 1211.38. The precious metal dipped below the 40-simple moving average (SMA) in the 4-hour chart pointing to a continuation of the bearish outlook.
From the technical point of view, the Relative Strength Index (RSI) is sloping to the downside, slightly above the threshold of 50, while the %K line dipped below the %D line in the overbought zone, creating a strong bearish case and suggesting further losses.
If price action remains below the 40-SMA, there is scope to challenge the 20-SMA near 1225.44. A drop below this area would take the price closer to the one-year low (1211.38). Further losses would open the way towards the 1204 support level, taken from the low on July 2017.
However, if the market extends gains to the upside, the next level to have in mind is the 1238 resistance barrier, identified by the troughs during July 2018. A jump above this area could drive the price until the 23.6% Fibonacci retracement level of the downleg from 1365 to 1211.38, around 1247.58.
Overall, the precious metal has been holding within a significant downward movement since April 11, indicating that the price remains in a bearish mode in the long term.
Dollar Drops On Trump Comments, Yen Rallies On Safe-Haven Demand, Possible BOJ Moves
Here are the latest developments in global markets:
FOREX: The US dollar continued to find itself under pressure following the comments by President Trump criticizing the Fed's rate hike plan and also characterizing the dollar as too strong and other countries as currency manipulators. The yen posted impressive gains because on the one hand there was some risk-off sentiment and on the other hand there were rumors that the Bank of Japan was thinking how to modify its monetary stimulus program so as to make it more sustainable and let markets play a bigger role.
STOCKS: Following a flat session on Wall Street on Friday, Asian stocks were mixed during Monday's trading with Chinese stocks gaining but Japanese and Australian stocks posting losses. Europe was looking to open lower. Stocks are mostly moving positively because of an upbeat US earnings season although worries about trade wars have a limiting effect on their gains.
COMMODITIES: Gold continued to capitalize on the dollar's weakness and managed to trade as high as $1235 an ounce during early Asian trading. It backed off to around $1230 later. There was not much excitement in the oil market as WTI futures were steady but well off Friday's highs. Oil was slightly above $68 a barrel. Friday's Baker Hughes oil rig count showed a drop in rigs in the United States.
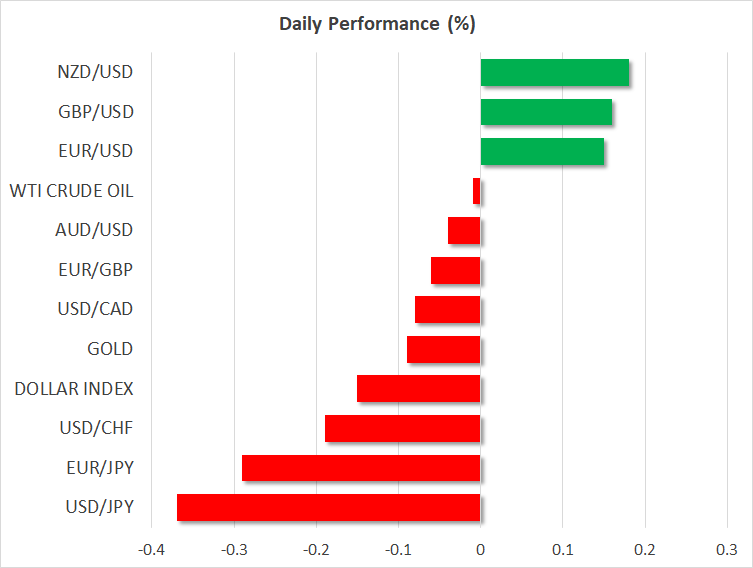
Major movers: Trump comments rattle dollar; Yen gains on rumors that BOJ may alter stimulus program
President Donald Trump was yet again one of the main market movers, as this time he criticized the Federal Reserve about its rate hikes. Trump also accused countries such as Japan and the Eurozone of manipulating their currencies lower. It is difficult to determine how serious Trump's comments are and the impact they are going to have in the medium-term. However, as was the case with the rhetoric about trade protectionism, it could be a mistake to disregard Trump's comments as pure rhetoric. True, Trump does not have the constitutional power of affecting monetary policy directly but through his appointments on the Fed's Board of Governors and by making interest rate policy a political debate, it could create problems for the Fed to carry out its mission in an independent way. This is, of course, a factor worth watching in the future but it is still unlikely to derail the current US dollar rally or to dissuade the Fed from raising interest rates further – at least in the short-term.
The yen, on the other hand, rallied on rumors that the Bank of Japan is considering revisions to its quantitative easing program. Any alteration to the Quantitative Easing program would almost certainly involve a tightening of conditions. The BoJ has been doing massive monetary stimulus for so long without achieving its desired goal of raising inflation, that one is justified in wondering whether a change is called for. The next monetary policy meeting is on July 30. There was an increase in Japanese Government Bond (JGB) yields that helped the yen climb higher. Another factor that was perhaps supporting safe havens such as the yen was a fresh tweet by President Trump that warned Iran with strong language against threatening the United States.

Day ahead: Eurozone flash Consumer Confidence Index in focus; trade developments eyed
On Monday, July's flash figures on consumer confidence due at 1400 GMT will attract the most attention in the Eurozone as investors are eagerly looking for signs showing that the bloc's economic slowdown in the first quarter was a temporary blip. The European Commission, however, is expected to say that the measure remained in negative territory for the second month running, with analysts predicting the index to deteriorate to -0.7 from -0.5 in June, a bearish growth evidence that could keep growth prospects for the second quarter pessimistic ahead of the preliminary PMI readings on Tuesday and the ECB monetary policy meeting on Thursday. While the central bank has already announced its decision to terminate its asset purchasing program at the end of this year, a miss in data this week could turn policymakers cautious on future rate hikes as the central bank is planning to shift focus back to rate adjustments after ending its QE program, with markets projecting the first rate rise to come not until the end of 2019. Should today's data indicate that consumers have lower-than-expected prospects on their future spending, euro/dollar could start erasing Friday's gains. On the other hand, a surprising improvement in the numbers could help the pair to continue its recovery.
At the same time (1400 GMT) in the US, the calendar is scheduled to deliver stats on existing home sales for the month of June. After contracting by 0.4% month-on-month (m/m) in May and plunging by 2.7% in April, forecasts are now for a growth of 0.5%. The number of existing residential buildings sold in the previous month is anticipated to inch up from 5.43 million to 5.44mn. Still, new potential developments on the trade front could offset any data impact today as the G20 meeting between finance ministers and central bank delegates during the weekend did little to ease tensions. Instead, the US backed its import tariffs and urged its allies to ease their barriers on US products, a few days after the US president said he was ready to impose tariffs on all goods imported from China. European finance ministers were also on the defensive, claiming that no trade deal is possible with the US unless the US removes its duties. On Wednesday, all eyes will turn to Washington, where Trump and the President of the European Commission, Jean-Claude Junker will meet to discuss on security and economic matters such as tariffs on metals and imported cars, with markets being interested to see whether Junker could achieve some progress in the countries' relations.
Meanwhile in neighboring Canada, May's wholesale trade figures will gather some attention at 1230 GMT.
As of today's public appearances, Bank of England's Deputy Governor Ben Broadbent will give a speech to the Society of Professional Economists in London at 1700 GMT.
In stock markets, earnings releases continue, with Google's parent Alphabet being among companies to report quarterly reports after the market close. The company is expected to report higher earnings per share year-on-year.
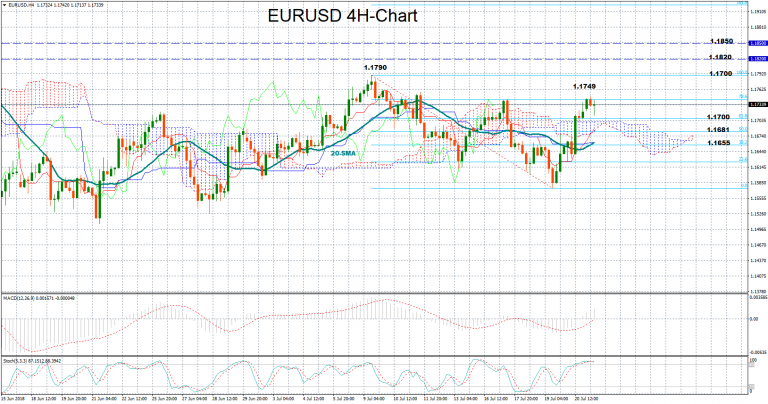
Technical Analysis: EURUSD in bullish mode; stochastics in overbought zone
EURUSD managed to rebound after touching 3-week lows at 1.1574 last week, rallying back above the Ichimoku cloud and the 20-period moving average in the four-hour chart. While the MACD continues to gain strength in positive territory above its red signal line, hinting that the market could maintain bullish momentum, stochastics signal that some weakness in the very-short-term cannot be excluded as the blue %K line is set to cross below the red %D line above 80, in overbought zone.
Still, an upward surprise in Eurozone's consumer confidence readings could help the market to extend its bullish move above today's peak of 1.1749, with scope to test July's 9 top of 1.1790. If this proves a weak resistance, the price could also break the 1.1800 key-level which could be of psychological significance to test the area between 1.1820 and 1.1850 which bulls have failed to overcome since mid-May.
In the alternative scenario, if the numbers show a steeper-than-expected deterioration in consumers' future spending appetite, euro/dollar could fall back below 1.1700, where the 61.8% Fibonacci of the bearish move from 1.1790 to 1.1574 is placed. Even lower, the pair could touch the 50% Fibonacci of 1.1681 before it meets the 20-period and the 38.2% Fibonacci around 1.1655.
USD/CAD Consolidation Between Two Weekly Pivot Points
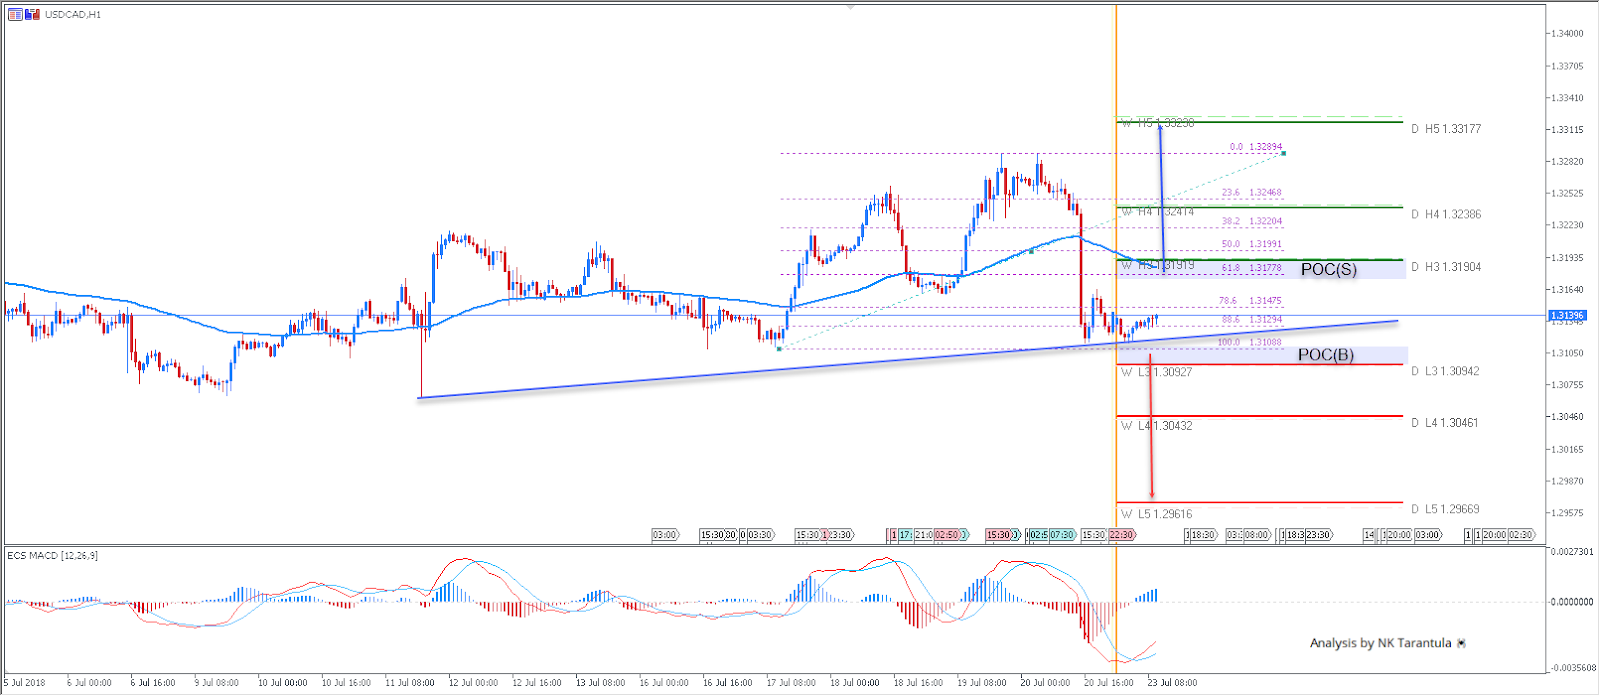
The USD/CAD has been consolidating between two weekly pivot points that are in confluence with daily pivots too. 1.3094 and 1.3190 are support and resistance, respectively. A 4h candle close ot 1h momentum candle below 1.3090 should target 1.3045 followed by 1.2960. On the contrary, a bounce or 4h candle close above 1.3190 should target 1.3238 and 1.3317.
Have in mind that the USD/CAD is exactly at 88.6 right now, so we might see a bounce first.
W L3 - Weekly Camarilla Pivot (Weekly Interim Support)
W H3 - Weekly Camarilla Pivot (Weekly Interim Resistance)
W H4 - Weekly Camarilla Pivot (Strong Weekly Resistance)
D H4 - Daily Camarilla Pivot (Very Strong Daily Resistance)
D L3 – Daily Camarilla Pivot (Daily Support)
D L4 – Daily H4 Camarilla (Very Strong Daily Support)
POC - Point Of Confluence (The zone where we expect price to react aka entry zone)