Sample Category Title
EUR/JPY Daily Outlook
Daily Pivots: (S1) 130.63; (P) 131.03; (R1) 131.35; More....
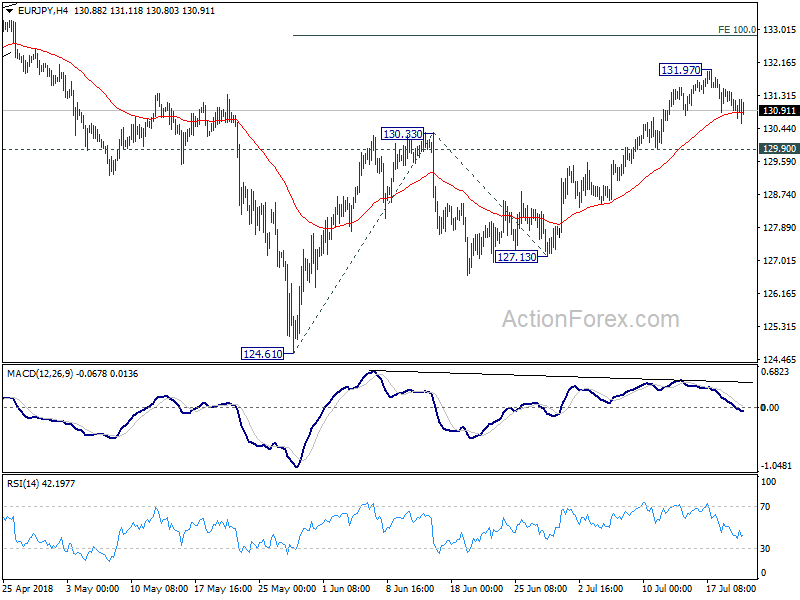
Intraday bias in EUR/JPY remains neutral for consolidation below 131.97 temporary top. Outlook is unchanged that as long as 129.90 minor support holds, further rise is still in favor. Above 131.97 will target 100% projection of 124.61 to 130.33 from 127.13 at 132.85 next. However, break of 129.90 will indicate short term reversal, with bearish divergence condition in 4 hour MACD, and turn bias back to the downside for 127.13 support.
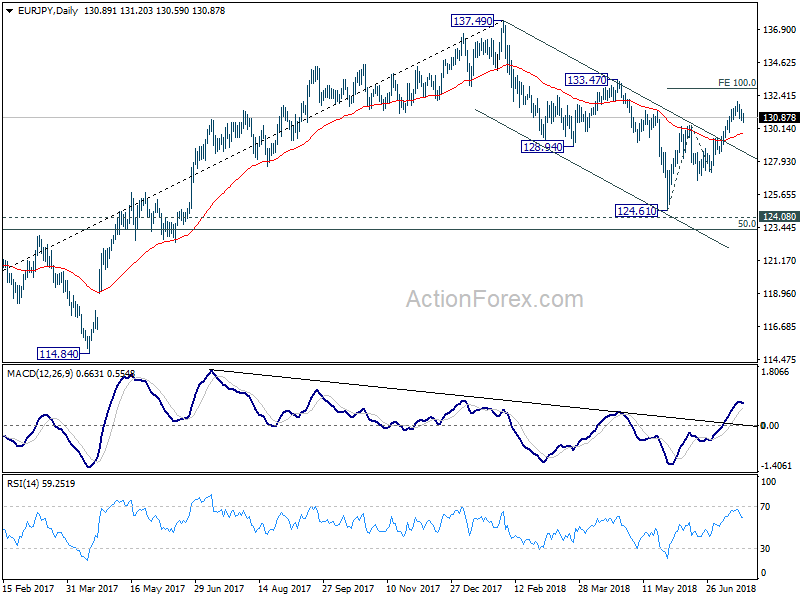
In the bigger picture, the strong break of channel resistance from 137.49 suggests that the decline from there as completed. The three wave structure suggests that it's a correction. With 124.08 key resistance turned support intact, medium term bullishness is also retained. Break of 133.47 will affirm this bullish case and target 137.49 and above. This will now be the favored case as long as 127.13 support holds.
USDCAD Surpasses 20-Day SMA With Strong Rally, 1-Year High Is Next Resistance Hurdle
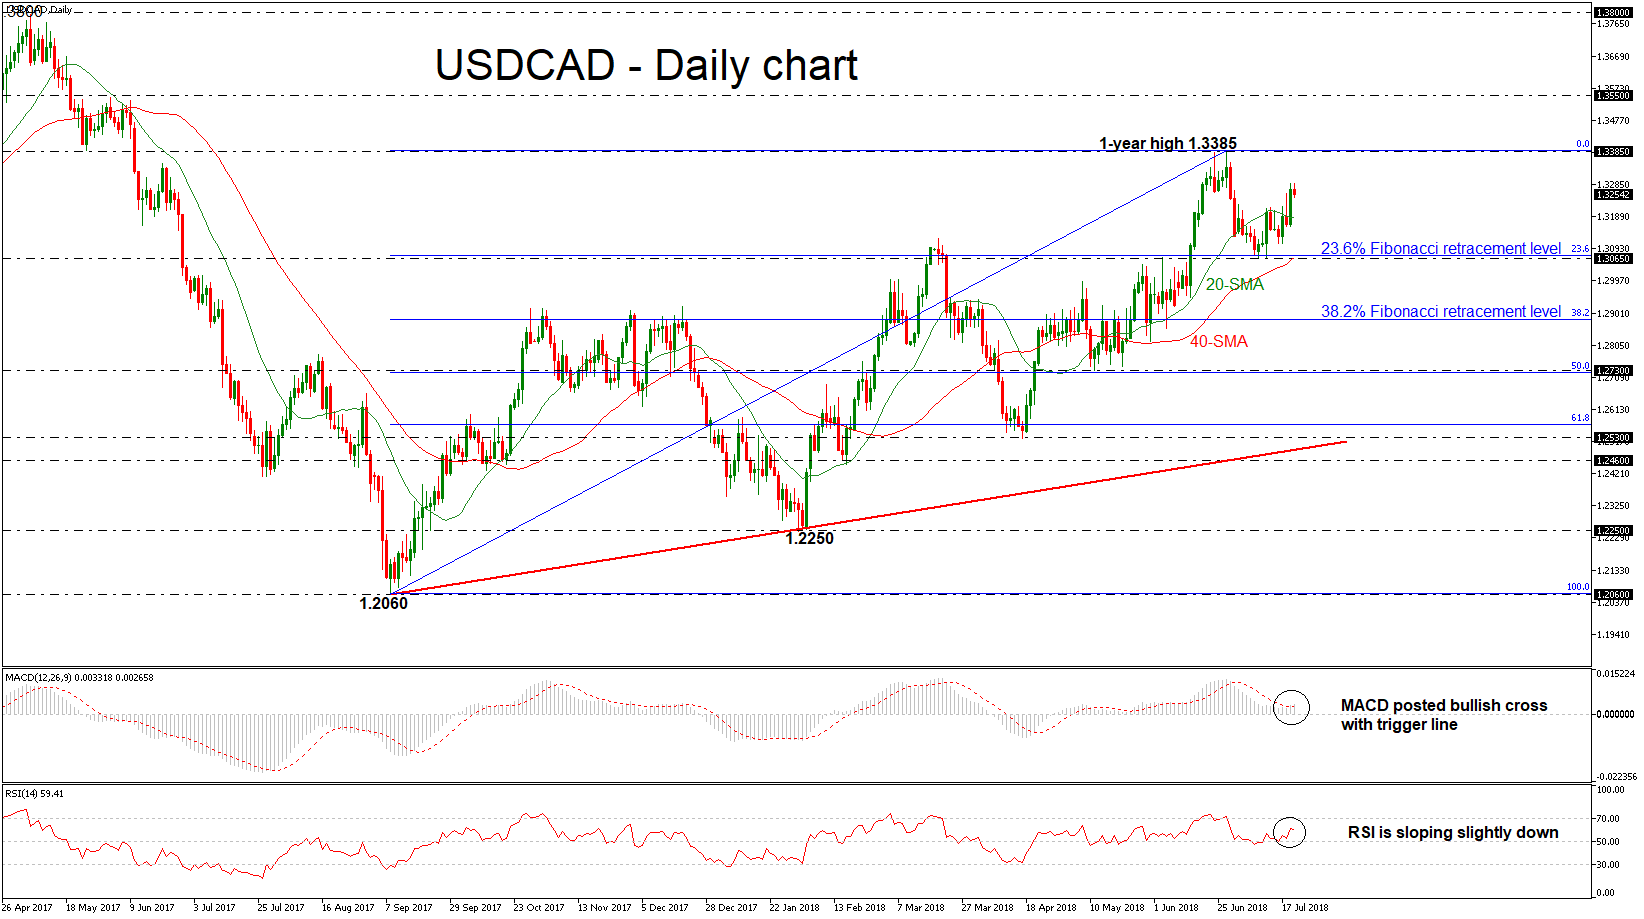
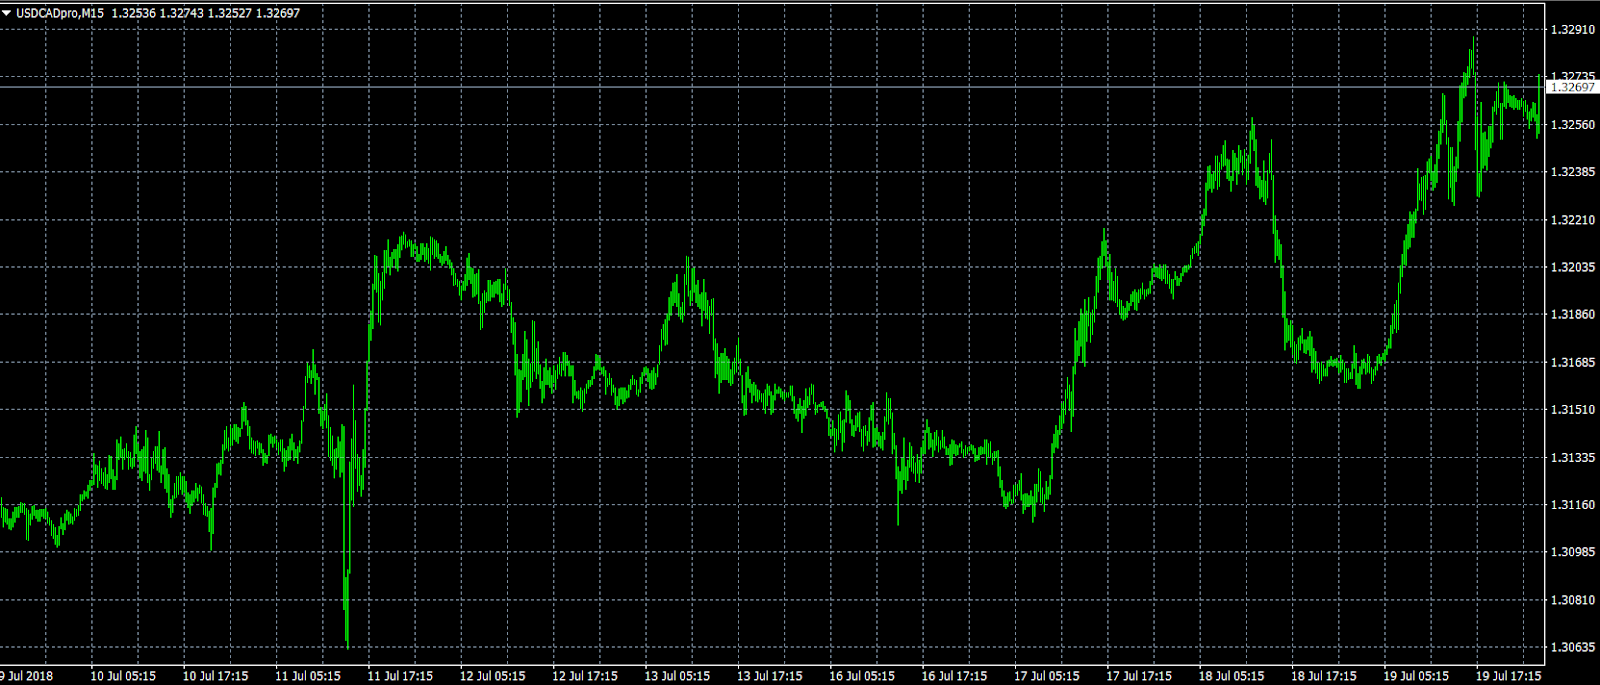
USDCAD recorded a stunning rally on Thursday and continued the buying interest during today’s Asian session towards a three-week high of 1.3289. This week, the pair is in positive territory, so far for the second session in a row, after the rebound near the 1.3065 support that was reached on July 9. However, the momentum indicators seem to be in confusion and the market could ease a little bit in the short-term.
The RSI indicator is currently sloping to the downside, increasing negative momentum. Despite that, the MACD oscillator created a bullish crossover with its trigger line in the positive territory, signaling for a possible upside run.
If the market manages to pick up speed, the one-year high of 1.3385 could offer nearby resistance for the bULLS. A significant close above this level would drive the pair towards the next hurdle of 1.3550 taken from the highs on June 2017.
Conversely, should prices decline, immediate support could be found at the 23.6% Fibonacci retracement level of the upleg from 1.2060 to 1.3385, around the 1.3065 barrier, which overlaps with the 40-day simple moving average (SMA). Then a leg below that level, the price could meet the 38.2% Fibonacci mark of 1.2880.
In the medium-term, the greenback seems to be in a strong bullish rally against the loonie as it has been holding within an ascending movement since September 2017.
EUR/CHF Daily Outlook
Daily Pivots: (S1) 1.1619; (P) 1.1630; (R1) 1.1647; More...
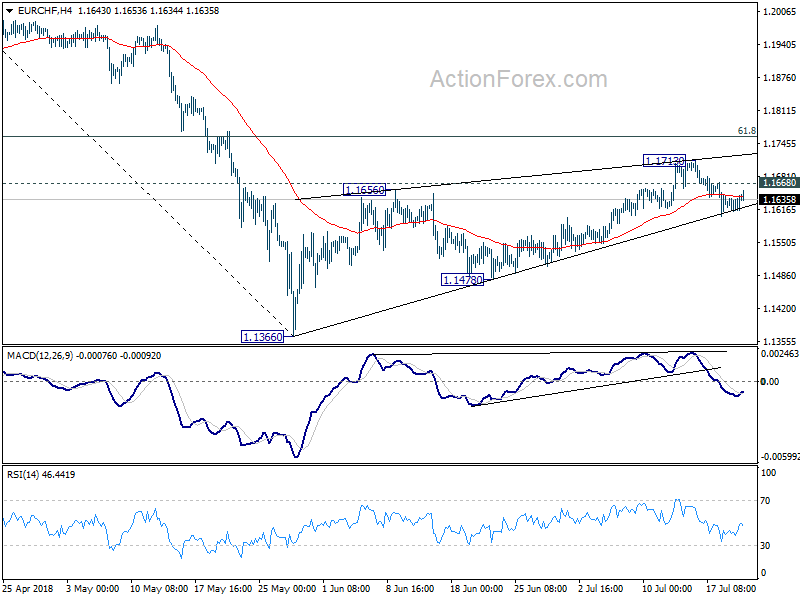
For now, we're favoring the case that corrective rise from 1.1366 has completed with three waves up to 1.1713 already. Deeper decline is expected as long as 1.1668 minor resistance holds, to 1.1478 support first. Break there will likely resume the whole corrective fall from 1.2004 through 1.1366 low. On the upside, above 1.1668 will bring another rise. But in the case, we'd continue to expect strong resistance from 61.8% retracement of 1.2004 to 1.1366 at 1.1760 to bring near term reversal.
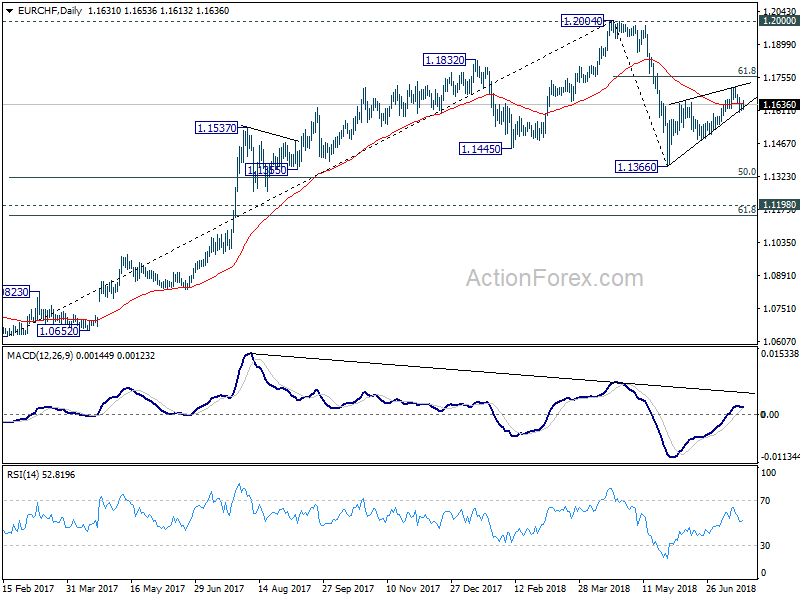
In the bigger picture, 1.2004 is seen as a medium term top with bearish divergence condition in daily and weekly MACD. 1.2000 is also an important resistance level. Hence, the corrective pattern from 1.2004 is expected to extend for a while before completion. Hence, we're not anticipating a break of 1.2004 in near term. Another decline cannot be ruled out yet. But in that case, strong support should be seen at 1.1198 (2016 high), 61.8% retracement of 1.0629 to 1.2004 at 1.1154 to contain downside.
EUR/AUD Daily Outlook
Daily Pivots: (S1) 1.5703; (P) 1.5780; (R1) 1.5902; More....
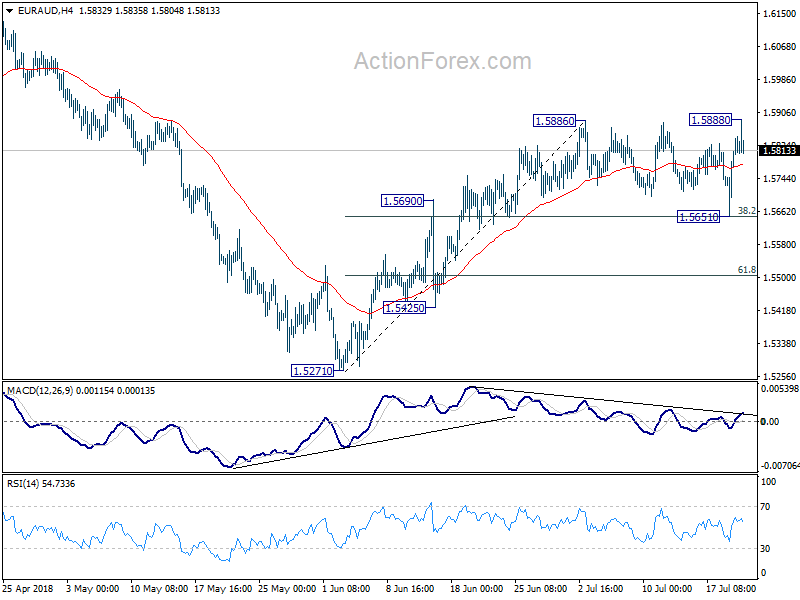
EUR/AUD drew strong support from 38.2% retracement of 1.5271 to 1.5886 at 1.5651 and rebounded. Despite a breach of 1.5886 resistance, there was no follow through selling yet. Intraday bias is neutral first. Now, near term outlook will stay bullish as long as 1.5651 support holds. Break of 1.5888 will resume the rise from 1.5271 and target 1.6139/89 resistance zone.
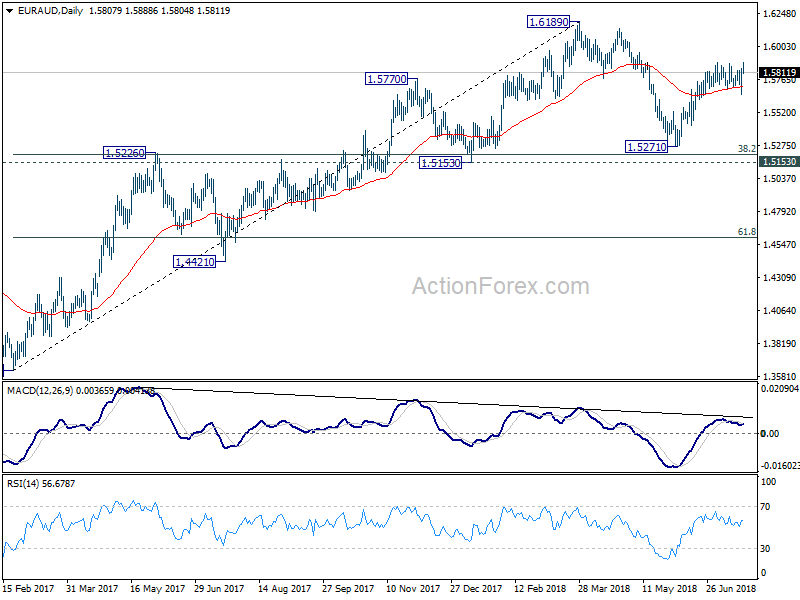
In the bigger picture, current development suggests that fall from 1.6189 is a corrective move and has completed at 1.5217 already. Key support levels of 1.5153 and 38.2% retracement of 1.3624 to 1.6189 at 1.5209 were defended. And medium term rise from 1.3624 (2017 low) is still in progress. Break of 1.6189 will target 1.6587 key resistance (2015 high).
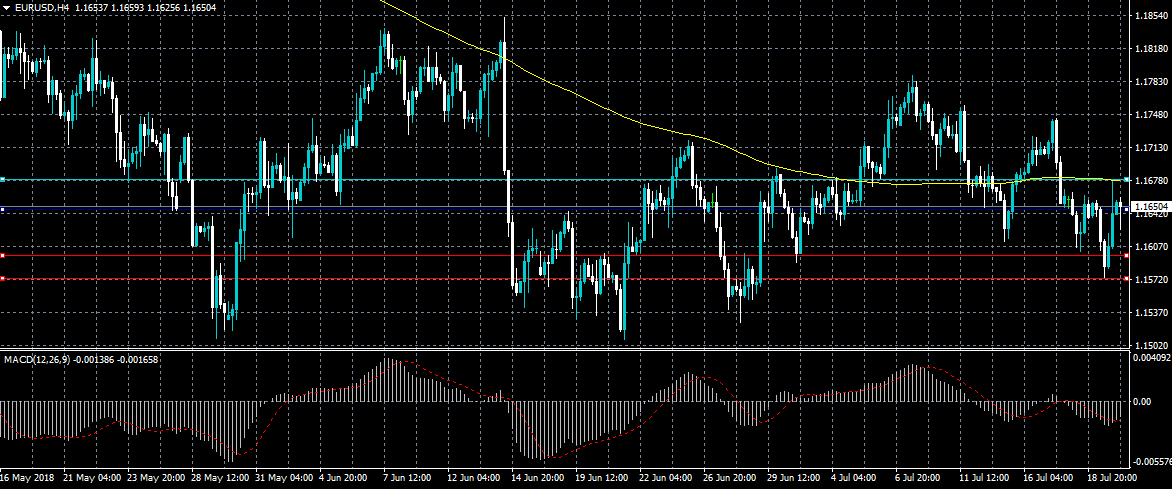
EURUSD Still Under Pressure Below 1.1681
The euro has reversed sharply from the 1.1570 region against the greenback, after the US dollar index suffered a third major technical rejection from the 95.50 level. The EURUSD pair has so far found strong resistance from just below the key 1.1681 level and trades back towards the 1.1650 level once again. Buyers will try to force price above the 1.1681 level, while sellers will target losses below the key 1.1600 support level.
The EURUSD pair is still bearish while trading below the 1.1681 level, key support is found at the 1.1630 and 1.1600 levels.
If the EURUSD pair moves above the 1.1681 level, buyers will attempt to move price towards the 1.1700 and 1.1744 resistance levels.
GBPUSD Under Pressure Below 1.3030 Level
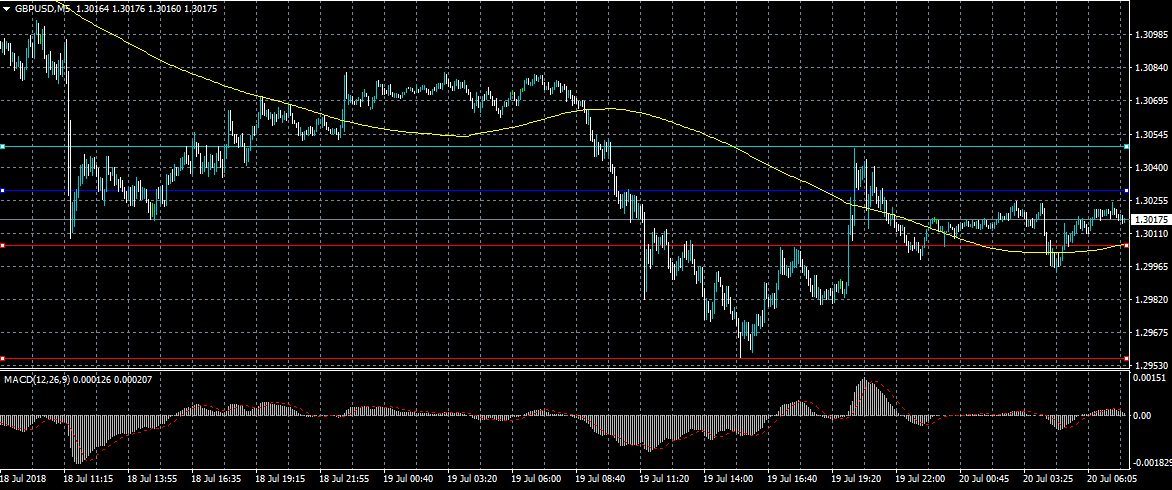
The British pound has recovered back above the 1.3000 level against the US dollar after the US dollar index failed to make traction above the 95.50 level on Thursday. The GBPUSD pair is likely to remain under heavy downside pressure on Friday while trading below the 1.3030 resistance level. Sellers will look for further losses below the 1.3000 level, while buyers will attempt to stabilize price above the 1.3030 level.
The GBPUSD pair is strongly bearish while trading below the 1.3030 level, key technical support is found at the 1.3000 and 1.2954 levels.
If the GBPUSD pair moves above the 1.3030 level, buyers will likely target the key 1.3082 and 1.3100 resistance levels.
Loonie Takes The Spotlight On Friday
A pair of high-profile reports from Canada will headline the economic calendar on Friday, as currency traders wrap up an active week that has been increasingly dominated by the US dollar.
The European session begins in earnest at 06:00 GMT with a report on German producer inflation. The producer price index (PPI) likely rose 0.2% in June following a 0.5% increase the month before. In annualized terms, German PPI is projected to rise 2.9%.
In Brussels, the European Commission's statistical agency will report on the current account balance at 08:00 GMT. The current account surplus is forecast to fall to a seasonally adjusted €27.2 billion in May compared with €28.4 billion in April.
In the United Kingdom, the Office for National Statistics will report on public sector net borrowing at 08:30 GMT. Overall debt levels are projected to rise to £3.6 billion in June compared with £3.35 billion the previous month.
The government of Canada will report on consumer inflation and retail sales in two separate reports at 12:30 GMT. The consumer price index (CPI), a key measure of inflation, likely rose 0.3% for June following a 0.1% uptick the month before. In annualized terms, this translates into a growth rate of 2.5%. Meanwhile, the Bank of Canada's core consumer price index is forecast to read 1.4%.
Retail sales, a proxy for consumer spending, likely flat-lined for May after falling sharply the month before. Excluding the volatile automobile component, receipts are projected to rise 0.5%.
Commodity traders will also be keeping a close eye on Baker Hughes' weekly oil rig count, which is an important indicator of US shale activity.
EUR/USD
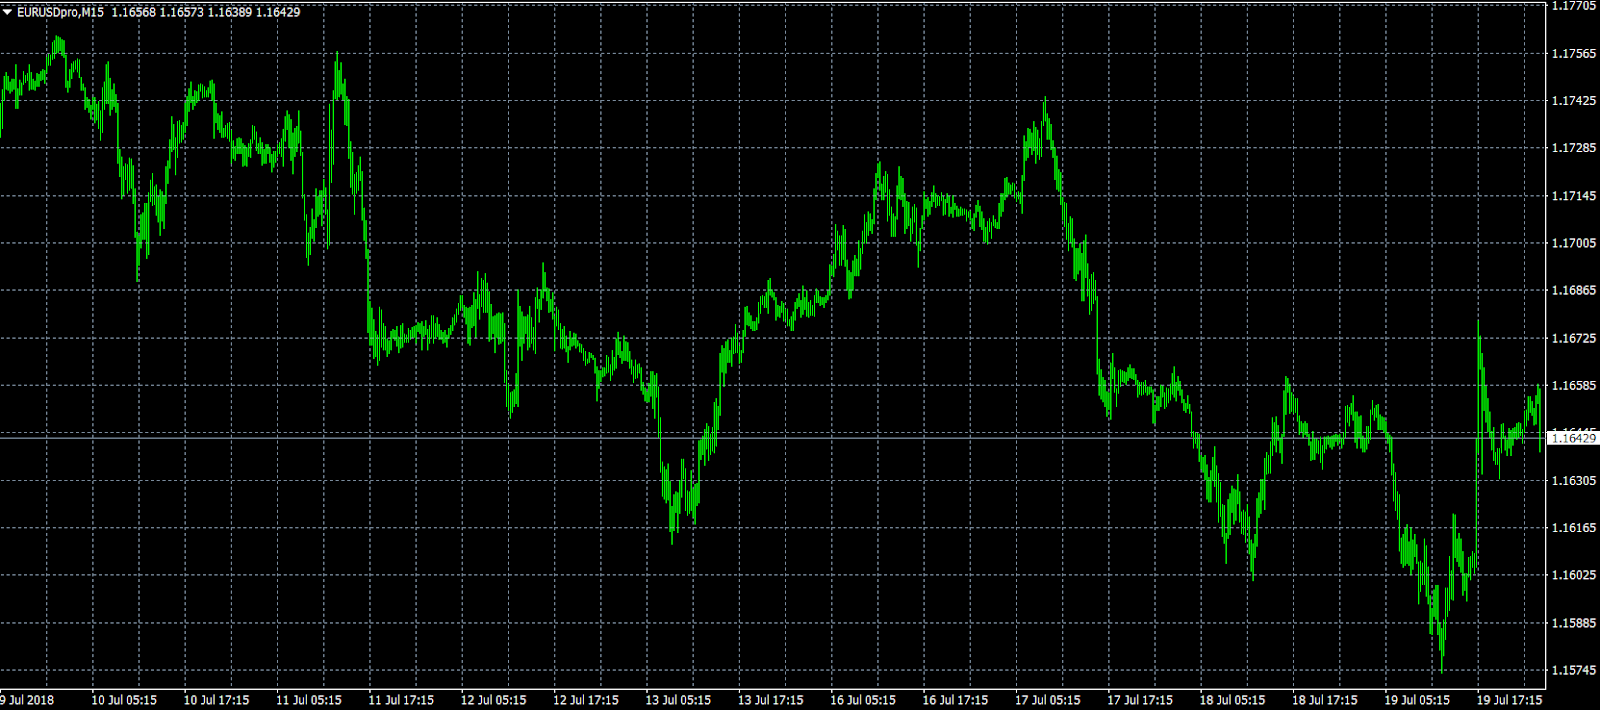
Europe's common currency swung sharply lower in the previous session, with prices falling below 1.1600 for the first time in three weeks. EUR/USD bottomed below 1.1590 before rebounding sharply later in the session. The pair now trades at 1.1639, where it risks a double-top formation. Prices must, therefore, break higher to avoid this ominous setup.
GBP/USD
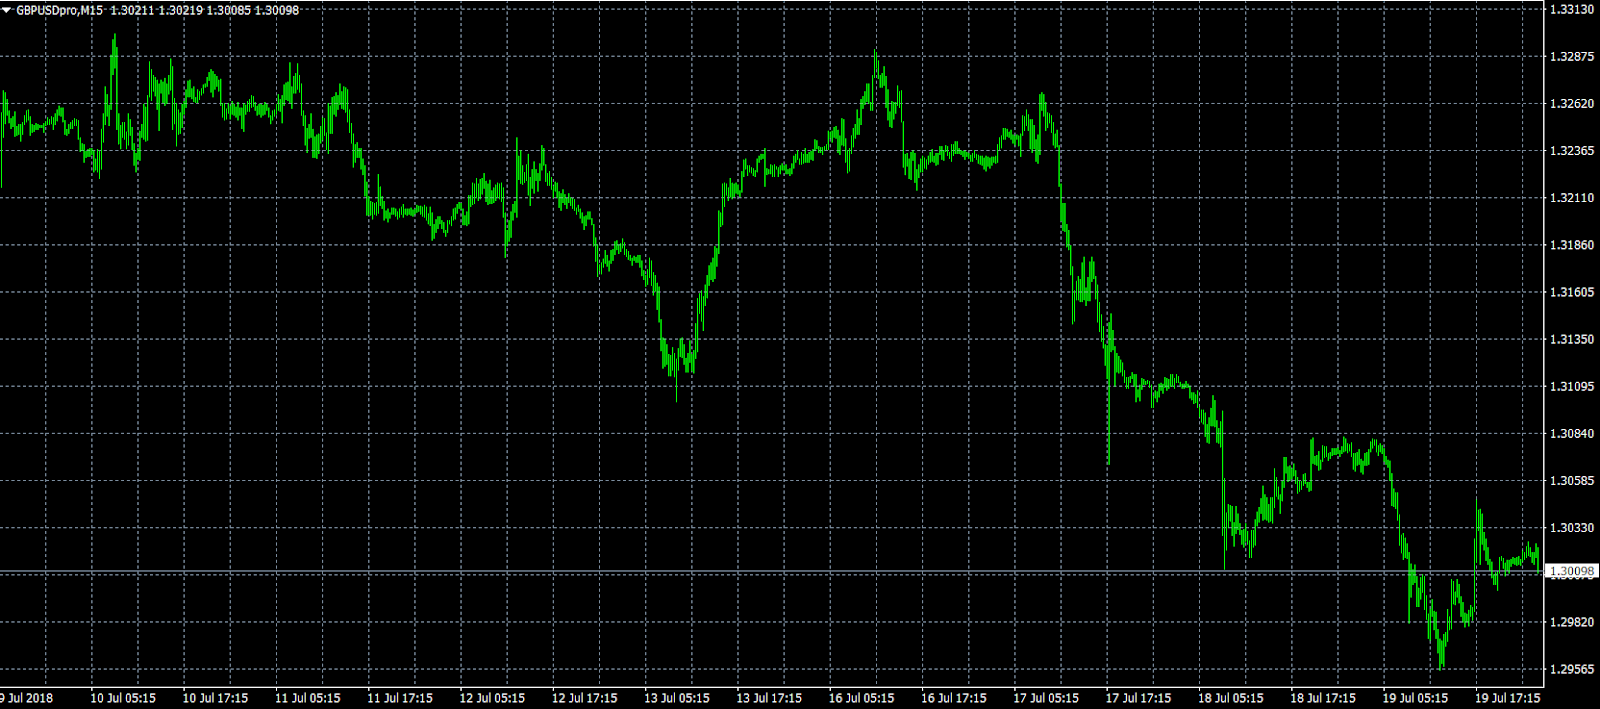
It has been a volatile week for cable, with prices falling toward the lowest levels of the year. GBP/USD broke below 1.3000 on Thursday for the first time since August. The pair has since reclaimed that level, though the general trend remains bearish. Immediate resistance is located at 1.3049, the low from 28 June. On the opposite side of the spectrum, immediate support is located at 1.2957, the current year-to-date low. A breakdown below that level would likely expose the 24 August low of 1.2774.
USD/CAD
The North American cross is beholden to economic data in the final session of the week. The US dollar got the upper hand on its northern counterpart Thursday, as prices edged closer to the 1.3300 handle. USD/CAD is currently trading at 1.3278, with immediate resistance located at the psychological 1.3300.
US Stocks Ended Thursday Mostly Lower
General Trend:
- Asian equity markets pare early gains amid focus on China, US stocks ended Thursday mostly lower
- Taiwan Semi bucks the overall trend and rises after recent earnings report
- Shanghai Composite at risk of declining for 6 straight sessions; Property index underperforms
- Hang Seng trades near 10-month low
- China PBoC set the yuan fixed for the 7th straight session
- The yuan is ‘dropping like a rock’, says US President Trump
- Yuan weakness weighs on Asian and commodity currencies
- China State-Owned Banks said to have been seen selling US dollars (USD) in the yuan market around 6.81 (financial press)
- PBoC to keep ‘loose bias’ in H2, says the China Securities Times
- Japan June CPI data was mixed, core figure rose for the first time since Feb
- Australia 3-month bank bill rate fixed below 2.00%, first time since early June
- The G20 meeting of Finance Ministers and Central Bank Governors is due to be held on July 21-22 (Saturday-Sunday)
- Australia Q2 CPI data due next week (Wed July 25th)
- Tokyo Steel expected to report quarterly earnings after the close
Headlines/Economic Data
Australia/New Zealand
- ASX 200 opened +0.2%
- ASX 200 REIT index +0.8%, Telecom +0.8%, Energy +0.6%, Consumer Discretionary +0.5%, Utilities +0.4%, Financials +0.3%
- (NZ) New Zealand Jun Net Migration SA: 4.8K v 5.1K prior
- (NZ) New Zealand ANZ Q2 Quarterly Business Micro Scope survey noted confidence among small companies hit a 9-year low – US financial press
- (NZ) New Zealand Jun Credit Card Spending M/M: +2.1% v -1.6% prior; Y/Y: 5.7% v 3.7% prior
China/Hong Kong
- Shanghai Composite opened -0.1%, Hang Seng +0.2%
- Hang Seng Industrial Goods index -1.8%, Materials -1.7%, Property/Construction -1.2%, Consumer Goods -1.1%, Info Tech -1%, Financials -0.7%; Utilities +0.9%
- (CN) CHINA PBOC SET YUAN REFERENCE RATE AT 6.7671 V 6.7066 PRIOR (7th straight weaker yuan fix, weakest fix since July 14, 2017)
- (CN) For the week, the PBoC injected a net CNY540B in its OMOs v CNY90B drain w/w
- (CN) China said to plan to tighten supervision of equities market in H2 2018 - China Securities Journal
- (CN) PBoC Stats Dept Head: China at leverage stabilization stage - Chinese Press
- (CN) China Finance Ministry (MOF) sells 30-year bonds: yield 3.97% v 3.93%e; bid to cover 1.68x v 1.75x prior
Japan
- Nikkei 225 opened -0.1%
- TOPIX Marine Transportation index -1.8%, Iron & Steel -1.7%, Securities -1.2%
- (JP) JAPAN JUN NATIONAL CPI Y/Y: 0.7% V 0.8%E; CPI EX FRESH FOOD (CORE): 0.8% V 0.8%E (first rise since Feb)
- (JP) BoJ said to start discussion in Aug on post-Libor benchmark - Japanese Press
- (CN) China and Japan to hold talks on Belt and Road in Sept - Japanese Press
Korea
- Kospi opened flat
- (KR) South Korea Jun PPI Y/Y: 2.6% v 2.2% prior
- (KR) South Korea President Moon said to consider meeting North Korea leader Kim again at the end of Aug - South Korean Press
Other
- (MY) Malaysia Finance Ministry said to cut 2018 GDP growth forecast to 5%
- For the week, the PBoC injected a net CNY540B in its OMOs
North America
- US equity markets ended mostly lower: Dow -0.5%, S&P500 -0.4%, Nasdaq -0.4%, Russell 2000 +0.5%
- S&P500 Financials -1.5%, Telecom -0.7%; Real Estate +1%, Utilities +0.9%
- (US) Commerce Sec Ross: too soon to say if auto market trade probe will result in a national security ruling - hearing on auto imports
- (US) Weekly Fed Balance Sheet Total Assets for week ending July 18th: $4.34T, +$5.2B w/w, -$183.3B y/y; Reserve Bank Credit $4.26T, +$5.4B w/w, -$184.2B y/y
Europe
- (DE) Germany H1 Tax Revenue Y/Y: +7.3% - Finance Ministry Monthly Report
- (DE) Germany Bundesbank Beermann: Target2 balances are not at risk - German Press
Levels as of 01:30ET
- Nikkei 225 -0.5%, ASX 200 +0.3%, Hang Seng -0.1%; Shanghai Composite +0.6%; Kospi +0.2%%
- Equity Futures: S&P500 -0.1%; Nasdaq100 +0.2%, Dax -0.2%; FTSE100 flat
- EUR 1.1626-1.1660 ; JPY 112.27-112.64 ; AUD 0.7317-0.7377 ;NZD 0.6720-0.6756
- Aug Gold -0.5% at $1,218/oz; Aug Crude Oil -0.2% at $68.14/brl; Jul Copper -0.6% at $2.701 /lb
Chinese Assets Are In Focus As The CNY Continues To Weaken
Market movers today
A quiet week ends with no important data releases in the calendar.
There are a few sovereign rating reviews, as France and Austria are up for review by Fitch and Greece is up for review by S&P. We do not expect either France or Austria to see a change in their rating or the outlook. Greece was recently upgraded by S&P (25 June) due to the creation of a liquidity buffer and debt maturity extension following the agreement between the euro group and Greece on 22 June. This happened outside the normal rating calendar. Hence, we do not expect a change in Greece's rating at today's review.
Selected market news
Chinese assets are in focus as the CNY continues to weaken. USD/CNY moved above 6.80 overnight for the first time in more than a year after the People's Bank of China weakened the USD/CNY fixing by 0.9% to 6.7671. This was the largest daily weakening of the CNY fixing in two years. USD/CNH has increased to 6.8133 and that CNH is now trading quite a bit weaker than CNY is a clear sign of depreciation pressure. With exports under pressure, China is probably happy with a weaker currency and there is no sign yet of a strong attempt to stop the depreciation, as offshore money-market rates are not pushed markedly higher to 'defend the currency'. We continue to see downside pressure on the CNY, as there are no signs of a thawing in the trade war (no negotiations) and we expect to see more monetary policy easing to support the economy going into the trade war with the US.
Base metal markets sold off yesterday, with the price of LME copper briefly falling below USD6,000/metric ton. The main driver was the trade war led rise in USD/CNY. Oil prices found some support in comments from Saudi Arabia, which it is not about to flood the market with supplies.
Global equity markets trade lower as concerns about tariffs and Chinese growth weigh on risk appetite. The S&P 500 index closed 0.4% lower in the US and most regional equity indices in Asia are also lower this morning, with the biggest declines in Hong Kong (Hang Seng) and Japan (Nikkei).
The 2Y10Y US yield curve flattened yesterday, driven by a rally in the long end, with yields on 10Y US Treasuries declining 5bp from a high of 2.895% to 2.845%.
In the FX market, the USD sold off significantly and EUR/USD initially bounced to 1.1678 after US President Donald Trump criticised the Fed in an interview with CNBC by saying that he is 'not thrilled' with the Fed rate hikes. He also said he would not interfere with the Fed and we doubt the Fed will change its course due to the well-known Trump view. Yesterday's sell-off in the USD seems a bit overdone in our view. We have argued that a trade war is more likely to be USD positive due to the less open US economy and we still expect EUR/USD to trade at the low end of 1.15-1.21 in coming months. Technically, the 100-day EUR/USD moving average has broken below the 200-day moving average, which is usually a bearish sign for the cross.
Elliott Wave Analysis: Oil Larger Correction Taking Place?
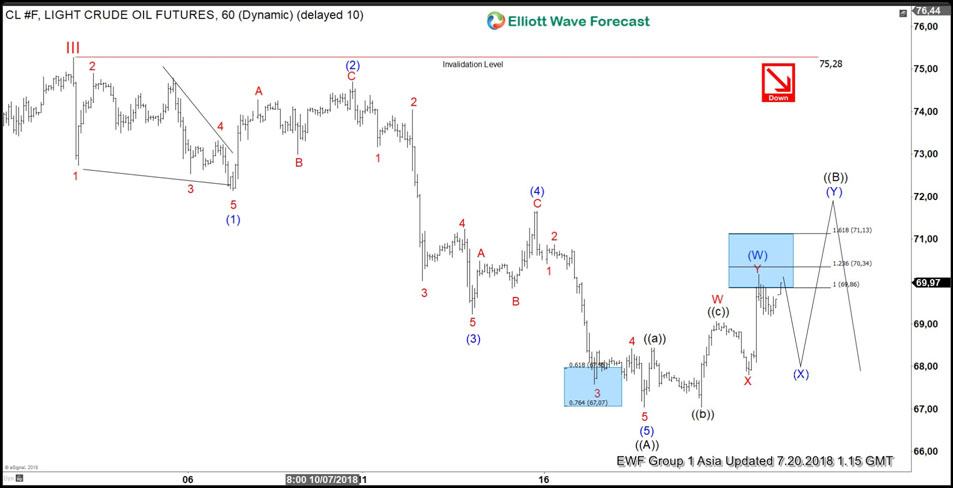
OIL short-term Elliott wave analysis suggests that the rally to $75.28 high ended cycle degree wave III. Down from there, the larger correction in cycle degree wave IV is taking place in 3, 7 or 11 swings before Oil resumes higher. The internal of the first leg of the decline from $75.28 high took place in 5 waves impulse with internal distribution of 5 waves structure in lesser degree cycle. This suggests that the five waves down from $75.27 is part of a larger Elliott wave Zigzag correction within cycle degree wave IV pullback.
Down from $75.28 high, the decline to $72.14 low ended intermediate wave (1) as a leading diagonal structure. Above from there, the bounce to 74.70 high ended intermediate wave (2) bounce as a Zigzag correction. Below from there, the decline to $69.23 low ended intermediate wave (3) in another 5 waves. Then the bounce to $71.66 high ended intermediate wave (4) bounce in 3 swings. The final decline from there unfolded in 5 waves structure which ended intermediate wave (5) at $67.04 low & also completed the primary wave ((A)).
Up from there, the instrument is doing the primary wave ((B)) recovery against 7/03 high ($75.28) in 3, 7 or 11 swings before further decline is seen. So far instrument already made the 3 waves recovery & reached the $69.86 – $70.34 100%-123.6% Fibonacci extension area of Minor W-X to complete intermediate wave (W). The instrument is expected to do a 3 waves pullback in intermediate wave (X) then another leg higher in intermediate wave (Y) of ((B)) can be seen before instrument resumes lower again. We don’t like selling it.
OIL 1 Hour Elliott Wave Chart