

Sample Category Title
Yuan’s Fall Extends To A Fourth Straight Day
PBOC weakens yuan by most in two years at daily fix
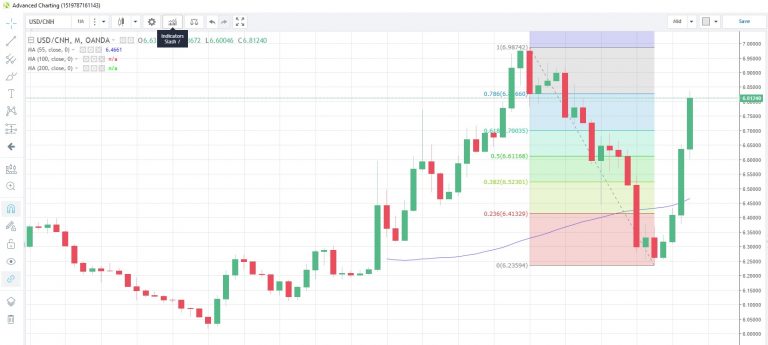
China's central bank weakened the yuan by the biggest single daily devaluation since June 2016. While the direction of spot USD/CNH could in some way be attributed to the rampant US dollar, there is some conjecture in the market that the devaluation is part of a plan to combat the effect of the imposition of US tariffs on Chinese goods. Trump seems not impressed and continues to blast Chinese officials for “not doing enough”.
The offshore yuan has tumbled as much as 3% versus the US dollar,so far this month, and is down almost 10% since March. USD/CNH is now trading at 6.81510 after touching the highest level in just over a year.
Trump criticizes Fed's hawkish rate policy
For the first time in two decades a US President broke with tradition and openly criticized the country's central bank. Trump said he was concerned about the potential impact on the US economy of rising rates and a surging dollar. Though, whilst saying he was not thrilled, he did say” I'm letting them do what they feel is best”. His comments pushed the US dollar and US yields lower, though there wasn't much follow through during today's Asian session.
Japan inflation nowhere near BOJ's target
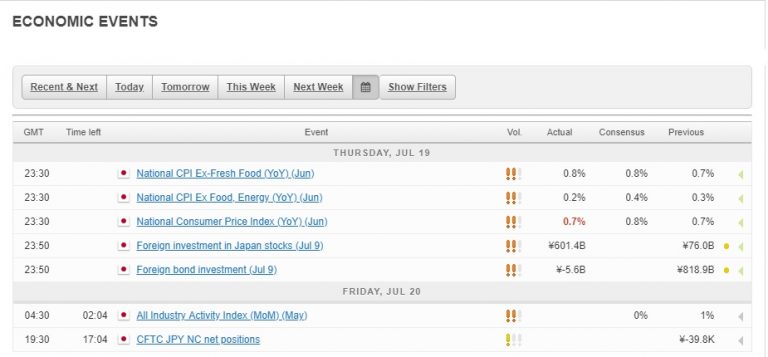
This morning's release of Japan inflation numbers for June came in below estimate, rising 0.7% y/y, the same rate as in May, versus forecasts of a 0.8% increase. In recent months there has been some debate whether the 2% target set by the BOJ is realistic in the current environment. According to results of a Reuters corporate survey published today, two-thirds of respondents reckon inflation between 0% and 1% is “appropriate” while 27% deemed the 2% inflation target as simply unreachable. Watch out for more BOJ deliberations on this topic.
Data in the headlights
It's a slow data session to close of the week with the only major releases the Euro-zone current account balance for May and for the UK Public Sector Borrowing and the NIESR's 3-month rolling GDP estimate. The North American calendar is populated with Canada's retail sales for May and inflation data for June.
Dollar rally halted on Trump’s senseless comments on Fed
Dollar's rally was took to a halt by Trump's verbal interference on Fed's policies. Trump criticized in a CNBC interview that "I don't like all of this work that we're putting into the economy and then I see rates going up." And he complained that "because we go up and every time you go up they want to raise rates again ... I am not happy about it." Trump also added Fed's rate hikes and strength of US Dollar are putting the US at a disadvantage. Though, he added that "at the same time I'm letting them do what they feel is best" and Fed chair Jerome Powell is a "very good man".
There are criticism on Trump's comments as being intervention on Fed's independence. But so far, Powell has given enough confidence to the market of carrying out his job in a "strictly nonpolitical way". What matters most to some economists is that Trump's comments just do not make sense. The US economy is on course for near 4% GDP growth in Q2, lowest jobless claims in nearly 50 years and inflation at around target. The strength of Dollar is merely reflecting strong fundamentals.
And remember that Trump's top economic adviser Larry Kudlow just said earlier this week that "it's possible that a real growth cycle is in front of us for the next four, five or six years." And, Kudlow added that "there's no recession in sight." So, is it time to remove monetary policy accommodation to, at least, bring interest rate back to "neutral' level?
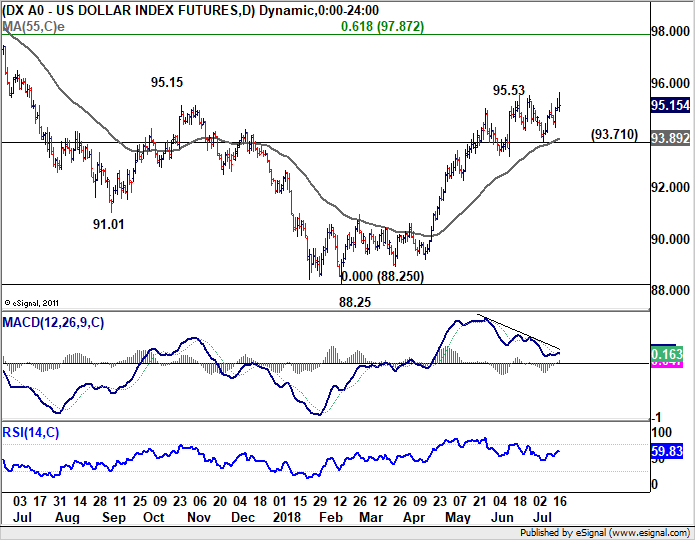
Dollar index edged through 95.53 resistance to 95.65 yesterday but quickly retreated. The rise from 88.25 should be resuming but momentum is no convincing yet. As long as 93.71 support holds, we'd expect further rally to 61.8% retracement of 103.82 to 88.25 at 97.87. However, a break of 93.71 will indicate a deeper and lengthier correction is underway.
Market Morning Briefing: Dollar Index Tested A 1 Year High
STOCKS
Dow (25064.50, -0.53%) saw a slight dip yesterday as daily candle resistance near 25250 seems to be holding. The current dip could extend towards 24750 before resuming the up move.
Dax (12686.29, -0.62%) has immediate support near 12650 and while that holds, the index could gradually move up towards 13000 in the near to medium term.
Nikkei (22652.42, -0.49%) is also down a bit but could again move up from 22600 back to higher levels of 23000. A break below 22600, if seen could indicate near term bearishness targeting 22400 or lower on the downside. Watch if immediate bounce is seen from current levels.
Shanghai (2774.62, +0.075%) may test 2750 on the downside before bouncing back again towards 2800-2850 levels in the medium term. Overall sideways trade in the next few sessions looks more likely.
Nifty (10957.10, -0.21%) is stuck in the 11100-10900 region since the past 5-sessions. While above 10900, upside chances still remain open towards 11200 which is a near term resistance from where a sharp corrective dip seems possible. For now we may expect support near 10900 to hold.
COMMODITIES
Nymex WTI (68.10, -0.21%) and Brent (72.56, -0.03%) are stuck just above immediate support levels. Brent could spend some time in the 74-71 region with important support in the 71-70 zone. WTI on the other hand has room on the downside till 66.0-65.50 levels which is likely to hold in the medium term. We could see some initial dip or range-trade for a few sessions before the crude prices moves higher.
Gold (1217.70, -0.51%) is looking weak just now and could fall towards 1200 or even lower in the coming sessions.
Copper (2.6995, +0.15%) has also been falling and has surprised with a break below immediate support near 2.70. The fall if continues, could pull down Shanghai also in the near term. Downside targets of 2.60-2.55 is a medium term possibility.
FOREX
Euro (1.1649): Against our expectation, Euro dipped further to test the support on 3 day candle chart (1.1575: earlier mentioned as 1.16) and has again risen from there. As mentioned yesterday, 1.1715 continues to be a crucial resistance level, whose breach could take Euro higher towards 1.18+. A break below 1.1575 would open up lower support near 1.15-1.145 on daily line chart. 1.149 corresponds to the 89 weeks MA as well and could be a strong support in the next 1-2 weeks.
Dollar Index (95.17): Dollar Index tested a 1 year high (95.65) yesterday and then dipped, possibly after Trump’s comments that he is unimpressed by the US Fed’s rate hikes. It has moved above horizontal resistance on daily line chart and could target channel resistance near 96 in the next 1-2 weeks. A rise towards 96 could correspond with Euro falling towards 1.15. With crucial support for the Euro near 1.15, Dollar Index might also face resistance near 96 (or, 97).
Dollar Yen (112.44): Dollar Yen saw a low near 112.06 yesterday. We are still bullish on Dollar Yen towards 114 (resistance on 3 day line chart). Dips, if they happen, might be restricted till support on weekly candles near 111.5. After a test of 114-115 in the next couple of weeks, Dollar Yen could become bearish.
Euro Yen (130.98): Euro Yen could dip a little more to test support on daily line chart near 130.0-129.5 in the coming week. If this support breaks (less preferred), it would be quite bearish for Euro Yen.
Pound (1.3017): Pound saw a low near 1.296 yesterday and thereby tested support on 3 day and weekly candles. Previous support near 1.3050 might now act as resistance for the Pound as it possibly becomes bearish in the weeks ahead.
Dollar Rupee (69.05): Crucial Resistance at 69.10 on Dollar-Rupee for today. There is a chance it might hold, producing a dip to 68.90-80. BUT, if it breaks, then we see 69.50.
INTEREST RATES
US yields have again dipped after Trump's comments that he wasn't too impressed by the US Fed's rate hikes.
US 10 year yield (2.845%), 30 Year (2.966%), 5 Year (2.74%), 2 Year (2.595%):
US 10 Year yield has again dipped to test the horizontal support zone near 2.84%-2.82%. A break of this support would be important to make the 10 year yield bearish towards our forecasted target of 2.70%-2.65%.. A breach above 2.9% on the other hand, could negate the downside possibility. Recent US economic data releases have continued reflecting a strong US economy, which supports a rise in yields. A lot could hinge upon whether USA would go ahead with the proposed tariffs on $200 billion worth of Chinese imports - if that happens, a flight to quality by investors and a consequent fall in yields would be very likely.
US 10 year - Japanese 10 Year yield spread (2.808%) looks like it could dip towards 2.75%-2.70% in the next 1-2 weeks..
With the Japanese 10 Year yield (0.037%) looking like it could dip from resistance on short term chart towards 0.025%-0.03%; a fall in the US Japan spread indicates that the US 10 Year could also be bearish below 2.8%.
Japan core CPI rose 0.8% yoy but mainly driven by energy
Released from Japan, the all items CPI rose 0.1% mom, 0.7% yoy in June. Core CPI, all item less fresh food, rose 0.1% mom, 0.8% yoy. Core core CPI, all item less fresh food and energy, has indeed dropped -0.1% mom and rose 0.2% yoy.
The set of data should be rather disappointing for the BoJ. The decline in core core CPI suggests that inflation was mainly driven by the surge in energy costs. There wasn't much of press pressure elsewhere. It's remains a long road to meet its 2% inflation target. And there is no light on when the central could withdraw the massive stimulus.
USD/JPY’s Big Picture And Significant Uptrend
Key Highlights
- The US Dollar broke an important resistance near 111.00 against the Japanese Yen.
- There was a break above a significant contracting triangle at 111.30 on the weekly chart of USD/JPY.
- The US Initial Jobless Claims for the week ending July 14, 2018 declined from 215K (revised) to 207K.
- Japan's National CPI in June 2018 increased 0.7% (YoY), less than the forecast of +0.8%.
USDJPY Technical Analysis
The US Dollar started a major uptrend from the 106.60 low against the Japanese Yen. The USD/JPY pair broke a few important resistances near 110.00 and 111.00 to move into a solid uptrend.
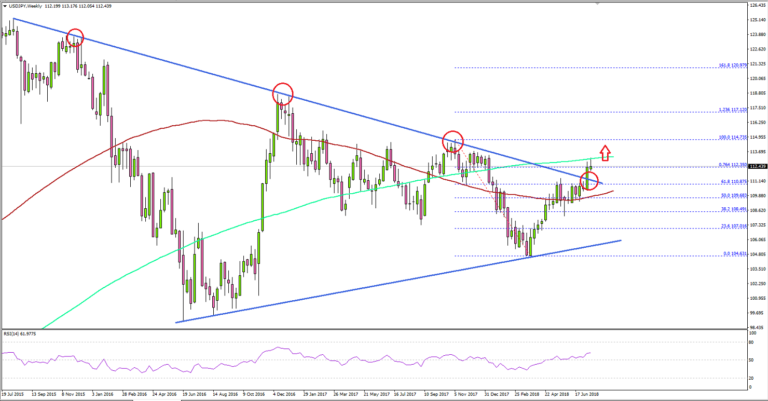
Looking at the weekly chart, the pair formed a key bottom at 104.63 in March 2018. It started an upward move and settled above the 50% Fib retracement level of the last decline from the 114.73 high to 104.63 low.
There was also a close above the 110.00 level and the 100-week simple moving average (red). More importantly, there was a break above a significant contracting triangle at 111.30 on the weekly chart of USD/JPY.
The mentioned triangle break has opened the doors for more upsides in USD/JPY above 114.00. If buyers remain in action, the pair may perhaps trade towards 1.236 Fib extension level of the last decline from the 114.73 high to 104.63 low at 117.12.
On the downside, the broken resistances at 112.00 and 111.00 are likely to act as support, followed by the 100-week SMA.
Recently in the US, the Initial Jobless Claims figure for the week ending July 14, 2018 was released by the US Department of Labor. The market was looking for a rise from the last reading of 214K to 220K.
The result was positive as there was a decline in claims to 207K. However, the last reading was revised from 214K to 215K.
The report added:
The 4-week moving average was 220,500, a decrease of 2,750 from the previous week's revised average. The previous week's average was revised up by 250 from 223,000 to 223,250.
Overall, the US Dollar remains in a major uptrend versus the Japanese Yen, and dips are likely to find supports on the downside.
Economic Releases to Watch Today
- German Producer Price Index for June 2018 (MoM) – Forecast +0.2%, versus +0.5% previous.
- Canadian Retail Sales May 2018 (MoM) – Forecast 0%, versus 1.2% previous.
- Canadian Retail Sales ex Autos May 2018 (MoM) – Forecast +0.5%, versus -0.1% previous.
- Canadian Consumer Price Index June 2018 (MoM) – Forecast +0.3%, versus +0.1% previous.
- Canadian Consumer Price Index June 2018 (YoY) – Forecast +2.5%, versus +2.2% previous.
Eco Data 7/20/18
[php_everywhere instance="1"]
Tallying Up Tariffs: The Effect on Inflation
Executive Summary
Trade tensions have been escalating since the spring when President Trump announced tariffs on steel and aluminum imports. Tit-for-tat responses to the initial tariffs levied by the administration earlier this year are beginning to add up. Supply chain managers have been left scrambling to find new sources of materials or face higher costs.
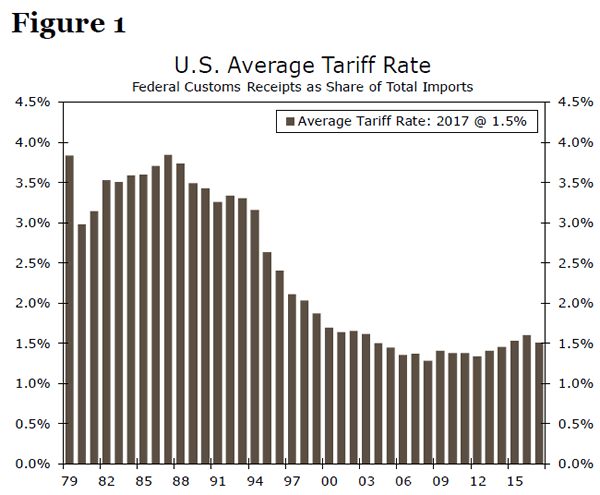
As shown in Figure 1, effective tariffs on U.S. imports have fallen substantially since the mid-1980s. While there is still tremendous uncertainty surrounding the size, targets and duration of tariffs under the current administration's trade policy, it is clear that rates are at least no longer declining. We estimate that the measures already imposed would increase CPI inflation by a scant 0.1 percentage point. If all the additional tariffs being proposed were to go into effect, however, inflation would rise about 0.5 percentage points.
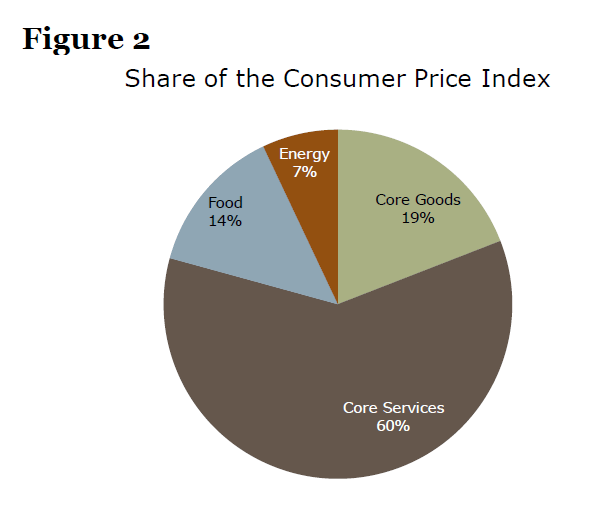
Keeping the effect on consumer price inflation thus far fairly modest, and limiting the impact if additional tariffs go into effect, are the composition and knock-on effects. The tariffs that have already gone into effect have focused on intermediate goods, meaning they equate to only a portion of the production cost. In addition, tariffs have been aimed at goods rather than services, and goods account for only about one-third of consumer spending (Figure 2). Consumers are also likely to adjust by buying goods from producers not covered by tariffs and/or reducing consumption of goods targeted. Second-order effects, such as retaliatory measures, a stronger dollar and weaker real growth also stand to mitigate the initial inflationary impulse of U.S. tariffs.
Overall, effects of tariffs that have already been enacted should be small enough to where the Fed does not need to alter its current course of policy on the basis of inflation. The additional proposed measures, however, stand to push inflation noticeably higher and weigh more meaningfully on real consumer spending.
Sizing Things Up: Tariffs Relative to U.S. Imports
Trade policy has been dominating the Trump administration's economic agenda since the start of the year. The escalating trade rift looms over the U.S. economy. As more goods have fallen within the scope of tariffs, or are at risk to do so soon, concerns over the effect on output, jobs and prices have intensified. Since the immediate aim of tariffs are to raise the effective price of imports, it is worth assessing how recent changes to trade policy are likely to affect consumer price inflation.
As outlined in Table 1, there have already been a number of instances since late last year in which the United States has raised tariffs. Thus far, the tariffs that have gone into effect have been applied across a fairly small share of imports. In total, the administration's major tariff changes apply to $90 billion of goods. In an economy that imported $2.3 trillion of goods in 2017, that represents 3.9 percent of total imports. With an average rate of 22 percent,1 that equates to 0.9 percent more spending on imports, all else equal.
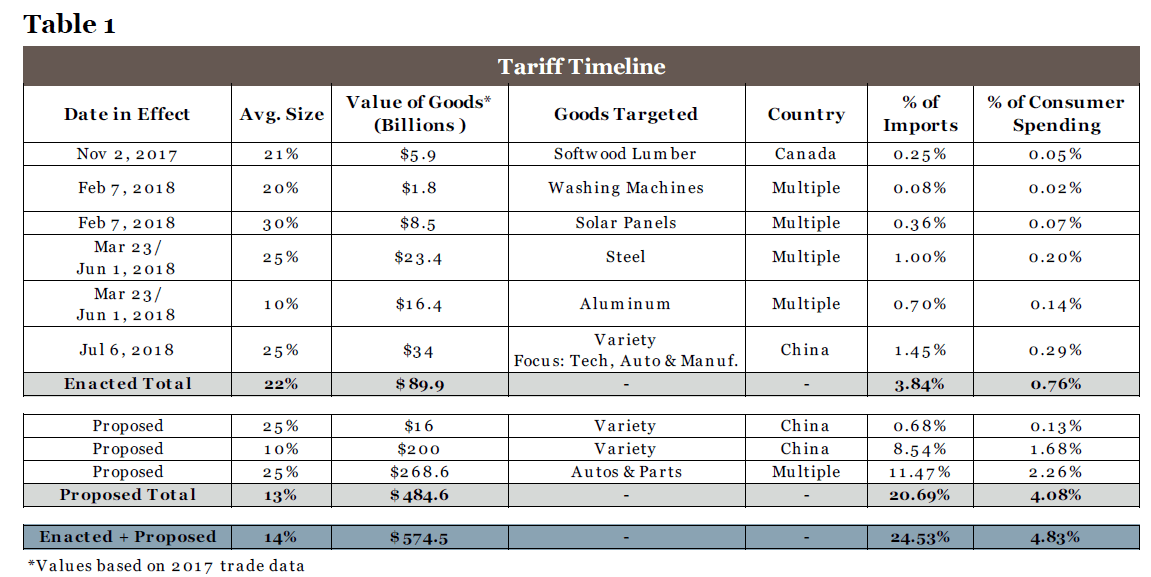
The value of subsequent targets are materially higher. After China announced it would retaliate against the initial tariffs imposed by the United States, President Trump suggested that another $200 billion in tariffs on Chinese goods could follow. The $200 billion in tariffs are now under assessment, bringing them one step closer to becoming a reality. At the same time, tariffs on vehicles have been floated. Details are still sparse regarding rates and whether some countries would be excluded, but we assume all automobile and parts imports would be exposed to an additional 25 percent tariff. This provides an upper-end estimate to the effect on inflation. If all the currently-proposed targets came to pass, spending on imports would rise by a total of 3.5 percent.
How Much Will Consumer Price Inflation Rise?
How much can we expect consumer prices to rise as a result? That depends on a myriad of factors, which we discuss in more detail in the next section. However, looking at the size of tariffs in relation to imports and the relationship between import prices and consumer price inflation offers a guideline.
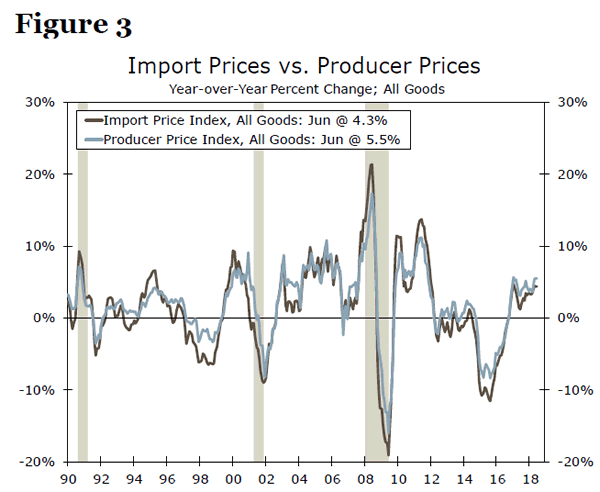
To determine how the jump in import prices would feed through to what consumers ultimately pay, we estimated a simple regression model. While the import price index excludes duties and other taxes such as tariffs, it still sheds light on the extent to which consumer prices move as import prices change. Although imports are not the only products being bought by U.S. consumers, their prices are highly correlated with domestically produced goods (Figure 3). Therefore, the change in import prices should also closely capture the tariff-related price changes to U.S. made products.
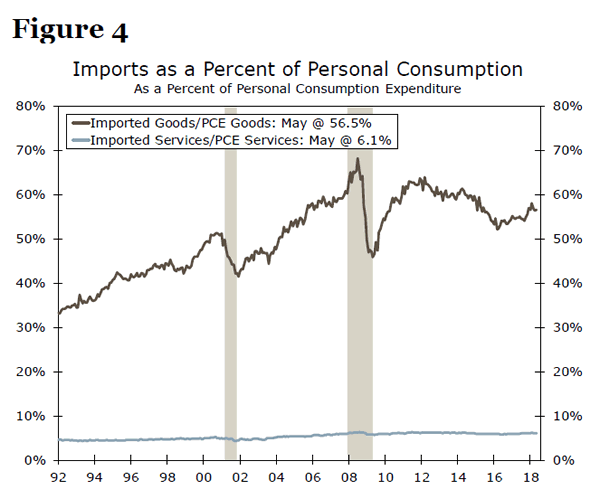
Prices on consumer goods are most exposed to tariffs given that the United States imports relatively few services (Figure 4). Holding other conditions like slack in the economy, inflation expectations and the dollar constant, the tariffs that have gone into effect would bump up CPI goods inflation, currently running at 2.9 percent, by 0.3 percentage points.2 If the additional tariffs proposed also came to fruition, inflation for consumer goods would be about 1.2 percentage points higher.
Spending on food, energy and other goods account for only about one-third of consumer outlays, however. As shown in Table 1, the value of goods exposed to tariffs equate to a much smaller share of total consumer spending than imports for this reason. Therefore, the effect on the overall CPI is noticeably smaller than it is if solely looking at consumer goods. Tariffs already imposed would add only about one-tenth of a percentage point to the overall rate of consumer price inflation. Taking into account the additional tariffs being floated, the change in headline CPI inflation would rise to 0.5 percentage point, again keeping other factors constant.
That's It? Why So Small?
With consumer price inflation currently running around 2 percent, a 0.1 percentage point rise stemming from tariffs is not a game changer, in our view, to the inflation outlook. The additional tariffs being proposed present noticeably more risk to consumer spending power and the Fed's goal of price stability. Yet, that is likely to be an upper bound, since auto tariffs may end up being more targeted and/or at a lower rate, while the composition, timing and generation of offsetting factors limit the effect on inflation.
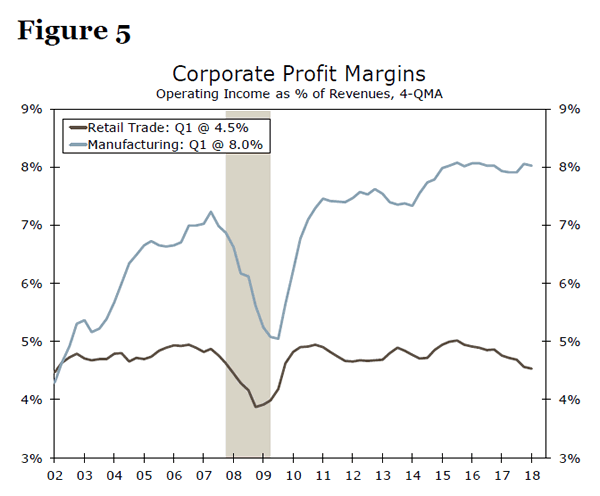
Mitigating the effect on consumer prices is that tariffs have been targeted at intermediate goods, at least thus far. By and large, the tariffs that have gone into effect have been on goods used in manufacturing and for commercial purposes. That has thrown supply chains into disarray and forced many manufacturers to pay up for inputs. Yet, final selling prices reflect a multitude of inputs, such as labor, transportation and marketing. In addition, businesses may accept lower margins rather than adjust selling prices in a one-to-one fashion with changes in input costs. Businesses appear to have room to absorb higher costs, especially with the recent cut to corporate tax rates. Profit margins across the economy remain historically high, especially in the manufacturing sector (Figure 5).
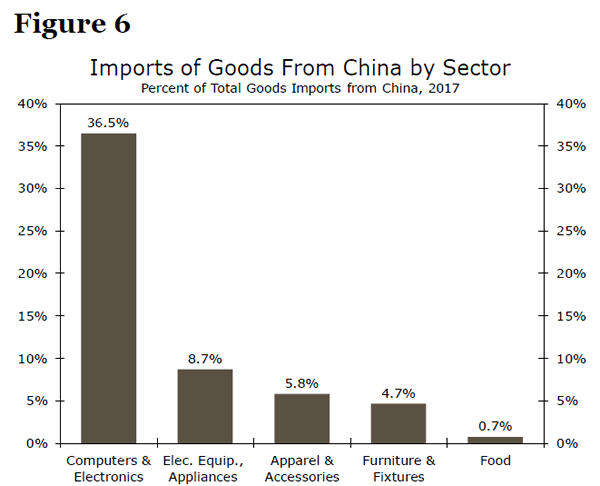
The potential application of tariffs to another $200 billion worth of imports from China makes it impossible to avoid tariffs on imported consumer goods. Of the $505 billion in imports from China last year, more than half were finished electronics or other consumer goods (Figure 6). Tariffs on all auto-related imports would also hit consumer price inflation fairly hard. Relative to historical rates, retailers have less scope to cut margins.
Timing also matters for the extent to which inflation will be affected. Higher tariffs raise the price level, leading to a one-time boost to inflation. In order for inflation to maintain a higher rate, however, subsequent increases would need to follow, unless inflation expectations were to become unmoored. Therefore, not only is the direct effect on inflation likely to be transitory, but the staggered roll out of tariffs should limit how much tariffs raise the inflation rate for any single period.
Knock-On Effects of Tariffs
Perhaps more important for the inflation outlook are the likely knock-on effects from the imposition of tariffs. How tariffs feed through the economy, affecting supply and demand, determines their ultimate effect on prices. Here, we have to consider not just tariffs imposed by the United States, but also retaliatory tariffs imposed by trading partners.
As we have already discussed, higher import prices provide a modest initial boost to overall consumer prices. Over time, however, the boost to prices may ease as producers not covered by tariffs (domestic factories or those in tariff-exempt countries) increase supply and capture more market share. The time horizon for supply chains to re-adjust depends on where existing production capacity is located, how easy it is for firms to move production/change suppliers and how long tariffs are likely to be in place.
In cases where tariffs have been applied across nearly all trading partners (solar panels, aluminum and steel to date),3 the only way to avoid tariffs is to source domestically. We expect U.S. manufacturers to increase steel production in response to tariffs, although this has yet to show up in industrial production data. However, steel production costs in the United States tend to be higher than abroad and U.S. firms are facing less price competition as a result of tariffs, which should keep prices elevated even when the direct cost of tariffs is avoided.
For goods covered by worldwide tariffs where American producers still lack a comparative advantage, even with tariffs, consumers will have to swallow higher import costs or reduce consumption. This is likely to be the case for solar panels, for example. In 2017, the United States and Canada together accounted for only 3.7 percent of worldwide solar module production, with China and Taiwan holding a clear lead at 70 percent.4 Imports make up about 80 percent of American consumption of solar modules.5 Given that solar module production is capital-intensive– building capacity is an expensive and long process—and tariffs are set to end after four years, domestic production is unlikely to replace a substantial share of solar imports. Rather, solar installation is likely to become more expensive,6 and demand for new solar power is likely to decline. The effect on consumer prices, through utility prices, will depend on the extent of substitution to other energy sources.
Where the United States has only imposed tariffs on imports from a particular country, such as China, we can expect trade diversion to occur, which would limit the effect of tariffs on prices. For instance, after the United States imposed stiff duties on solar cells manufactured in China and Taiwan in 2012 and 2015, solar cell imports from South Korea rose to a record high. For goods targeted in the first round of U.S. tariffs on Chinese imports, China supplies 7 percent of worldwide imports to the United States, although this rises to 13 percent for goods in the second round and 92 percent for some items. Given China's relatively small share of imports for these items, U.S. producers will likely be able to adjust supply chains to avoid the full impact of tariffs in many cases.
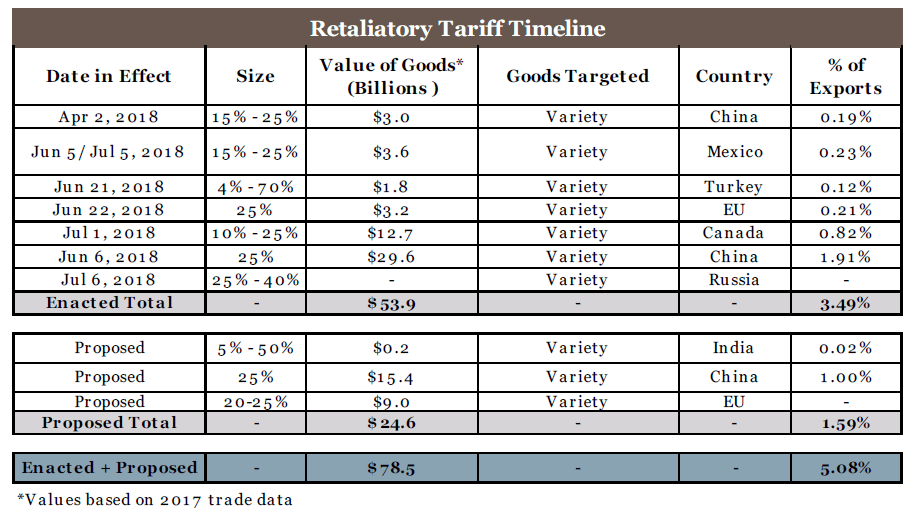
So far, we have only considered the supply and demand effect of tariffs imposed by the United States. Foreign countries, however, have retaliated on more than $50 billion of U.S. exports (Table 2). Retaliatory tariffs put downward pressure on U.S. consumer prices indirectly, if tariffs reduce the competitiveness of U.S. exports and, therefore, boost domestic supply as fewer goods are sold abroad. This risk is particularly acute for goods that the United States exports in large volume, such as soybeans and pork. Fresh foods, such as pork, must be consumed immediately, meaning that U.S. producers have little ability to deal with excess supply as a result of tariffs. Hog futures, for example, fell 1.5 percent after Mexico announced plans to levy tariffs of 20 percent against U.S. pork on June 5.
Putting specific tariffs aside, a trade war also has implications for consumer prices because of its effect on the U.S. dollar and growth. In times of risk-off market sentiment, the U.S. dollar tends to strengthen; uncertainty around the implications of trade tensions for global growth have been one factor supporting the U.S. dollar in recent months. On the margin, a stronger dollar puts downward pressure on import prices, counteracting some of the boost provided by U.S. tariffs.
If a trade war causes global growth to slow—the Bank of Canada recently called trade protectionism the "most important threat to global prospects"7—then global demand growth is also likely to slow. As FOMC members have highlighted, companies may put capital expenditure plans on hold in the face of trade uncertainties. Consumers, faced with higher prices, may pull back spending. These reactions would mean less pressure on capacity and, therefore, less upward pressure on prices.
Conclusion: Tariffs Not Enough to Change Fed Stance on Inflation
There remains tremendous uncertainty surrounding the ultimate effect of the Trump administration's stance on trade policy. The reduction in trade barriers over the past few decades has been one factor in keeping inflation historically low in recent decades. The upending of this system stands to throw the downward pressure on inflation into reverse. So far, the effect on consumer price inflation from the enacted tariffs likely will be small, but the additional tariffs being discussed would raise consumer price inflation more meaningfully.
Certain industries, such as manufacturing, are feeling the effect of tariffs more acutely given the highly specialized and global reach of supply chains. When setting monetary policy, however, the FOMC's goal of price stability is benchmarked against consumer price inflation, since higher input costs do not always result in higher final prices.
Just as the FOMC was reluctant to alter its projections on the economy based on potential changes to fiscal policy surrounding last year's tax bill, the Fed is unlikely to alter monetary policy on potential changes to tariffs. Given the small and temporary effect of the tariffs raised thus far, we do not expect to see the Fed meaningfully alter its current stance on inflation. Inflation has been running below the Fed's target for the better part of this expansion, and the FOMC has stressed its willingness to accept a modest overshoot, especially if temporary, for a time given the symmetric nature of its inflation target. However, inflation could end up rising more meaningfully if trade barriers continue to rise. Looking through the potential temporary impact to tariffs is also likely to be made difficult since they are coming at a time in which underlying inflationary pressures are already picking up.
Gold Slide Resumes as Jobless Claims Slide
Gold has resumed its losing ways in the Thursday session, after showing little change on Wednesday. In North American trade, the spot price for one ounce of gold is $1217.53, down 0.83% on the day. On the release front, manufacturing and employment data were better than expected. The Philly Fed Manufacturing Index climbed to 25.7, easily beating the estimate of 21.6 points. Unemployment claims dropped to 207 thousand, better than the estimate of 220 thousand.
The escalating trade war between the U.S and its major trading partners, which could hurt the U.S economy, is fast becoming a major concern for the Federal Reserve. The Fed’s Beige Book in July, which was released on Wednesday, had over 30 references to “tariffs”. Most of the twelve Fed regional districts referred to tariffs in their individual reports, which make up the Beige Book. Some Fed policymakers have also voiced their concern over the impact that tariffs could have on the U.S economy and is an issue the Fed will have to take into consideration, as it mulls over rate policy for the next six months.
With the U.S economy in excellent shape, Jerome Powell didn’t have to look far to reaffirm his positive outlook on the U.S economy in testimony before the Senate Banking Committee earlier this week. Powell said that he expected the labor market to remain tight and inflation to stay close to the Fed’s target of 2 percent for the next several years. Powell added that the Fed would continue to gradually raise interest rates. Lawmakers appeared satisfied with current monetary policy, but Powell did face some pointed questions regarding the escalating trade war, which has raised concerns that the economy could take a downturn if the tariff battles continue. The Fed continues to project two more rate hikes in the second half of 2018, most likely in September and December. According to the CME Group, the likelihood of a quarter-point rate hike in September is 84 percent.
Canada MacNaughton to Trump, NAFTA is a tripartite agreement, we’d like to keep it that way
Canada's ambassador to the US David MacNaughton said in a CBC Radio interview that Trump has been "pretty consistent in his distaste for multilateral deals." And, "from the outset President Trump has articulated a desire to do bilateral deals rather than multilateral deals so his comment wasn't a tremendous surprise." MacNaughton referred to Trump's comment on Wednesday that he might make a trade deal with Mexico and do another one with Canada later.
But MacNaughton emphasized that "(NAFTA) is a tripartite agreement, we'd like to keep it that way ... I am still fully confident we are going to end up with a trilateral deal and not two separate bilateral deals."
He also said that "Canada doesn't fit in that category" which posts legitimate security threats to the US. And, "I can't imagine how you could use national security as a guise for imposing illegal tariffs on another country."
Can Canada’s CPIs and Retail Sales Help the Loonie Recover its Poise?
Canada will see the release of its inflation and retail sales data on Friday at 1230 GMT. Forecasts point to an acceleration in price pressures and a sharp rebound in sales, which if confirmed, could enhance speculation for another BoC rate increase this year. Beyond economic data, any developments on the NAFTA front could also be crucial for the loonie’s forthcoming direction.
When the Bank of Canada (BoC) raised interest rates last week for the second time this year, it maintained a relatively neutral tone. It acknowledged the Canadian economy is strong and will likely require higher rates over time, but also recognized that uncertainty surrounding trade tensions had risen further. Overall, policymakers signaled that a deteriorating trade outlook was unlikely to deter them from hiking rates further in the coming months, provided that domestic economic figures hold up, of course.
Hence, the quality of incoming economic data will likely be crucial in determining the timing of the next rate increase. At the time of writing, investors are still undecided on whether such an action will take place this year. Implied odds derived from Canada’s overnight index swaps (OIS) suggest investors see a 43% probability for a 25bps rate hike at the Bank’s October meeting, which jumps to 54% when looking at the December gathering.
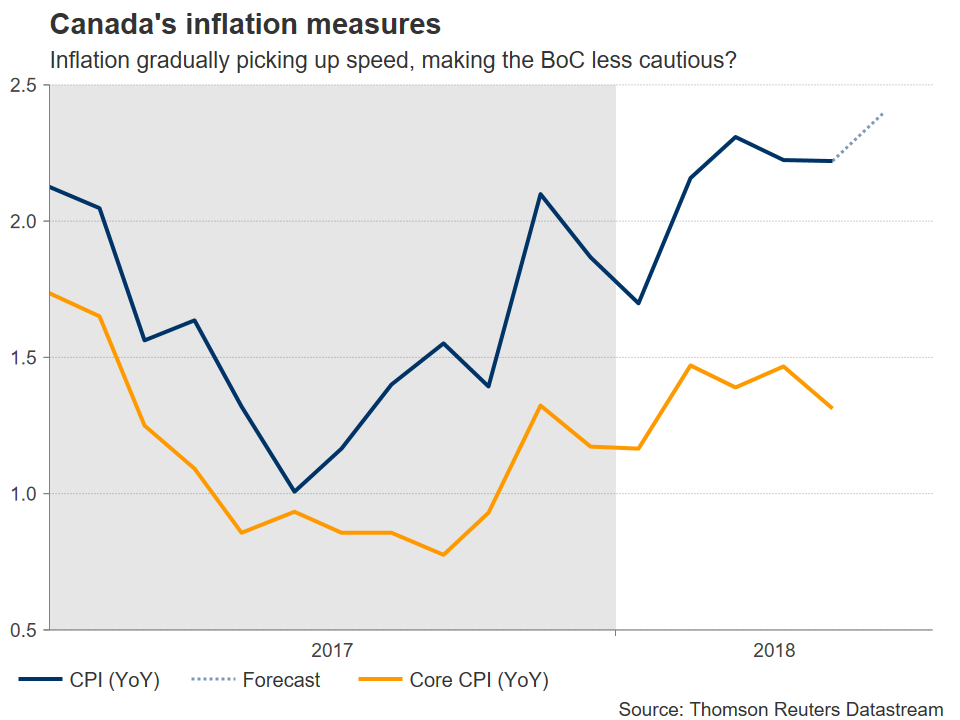
Turning to this week’s data releases, Canada’s CPI rate is anticipated to have risen to 2.4% in June on a yearly basis, from 2.2% previously. No forecast is available for the core, median, or trimmed mean CPI measures. As for retail sales, they are projected to have grown by 1.1% in monthly terms in May, a rebound following a 1.2% drop in April. Put together, such prints would signal both that inflationary pressures continue to mount and that April’s setback in retail sales was only temporary. Supporting the inflation forecast is the nation’s Markit manufacturing PMI, which indicated that goods prices rose at the fastest pace for over seven years in June.
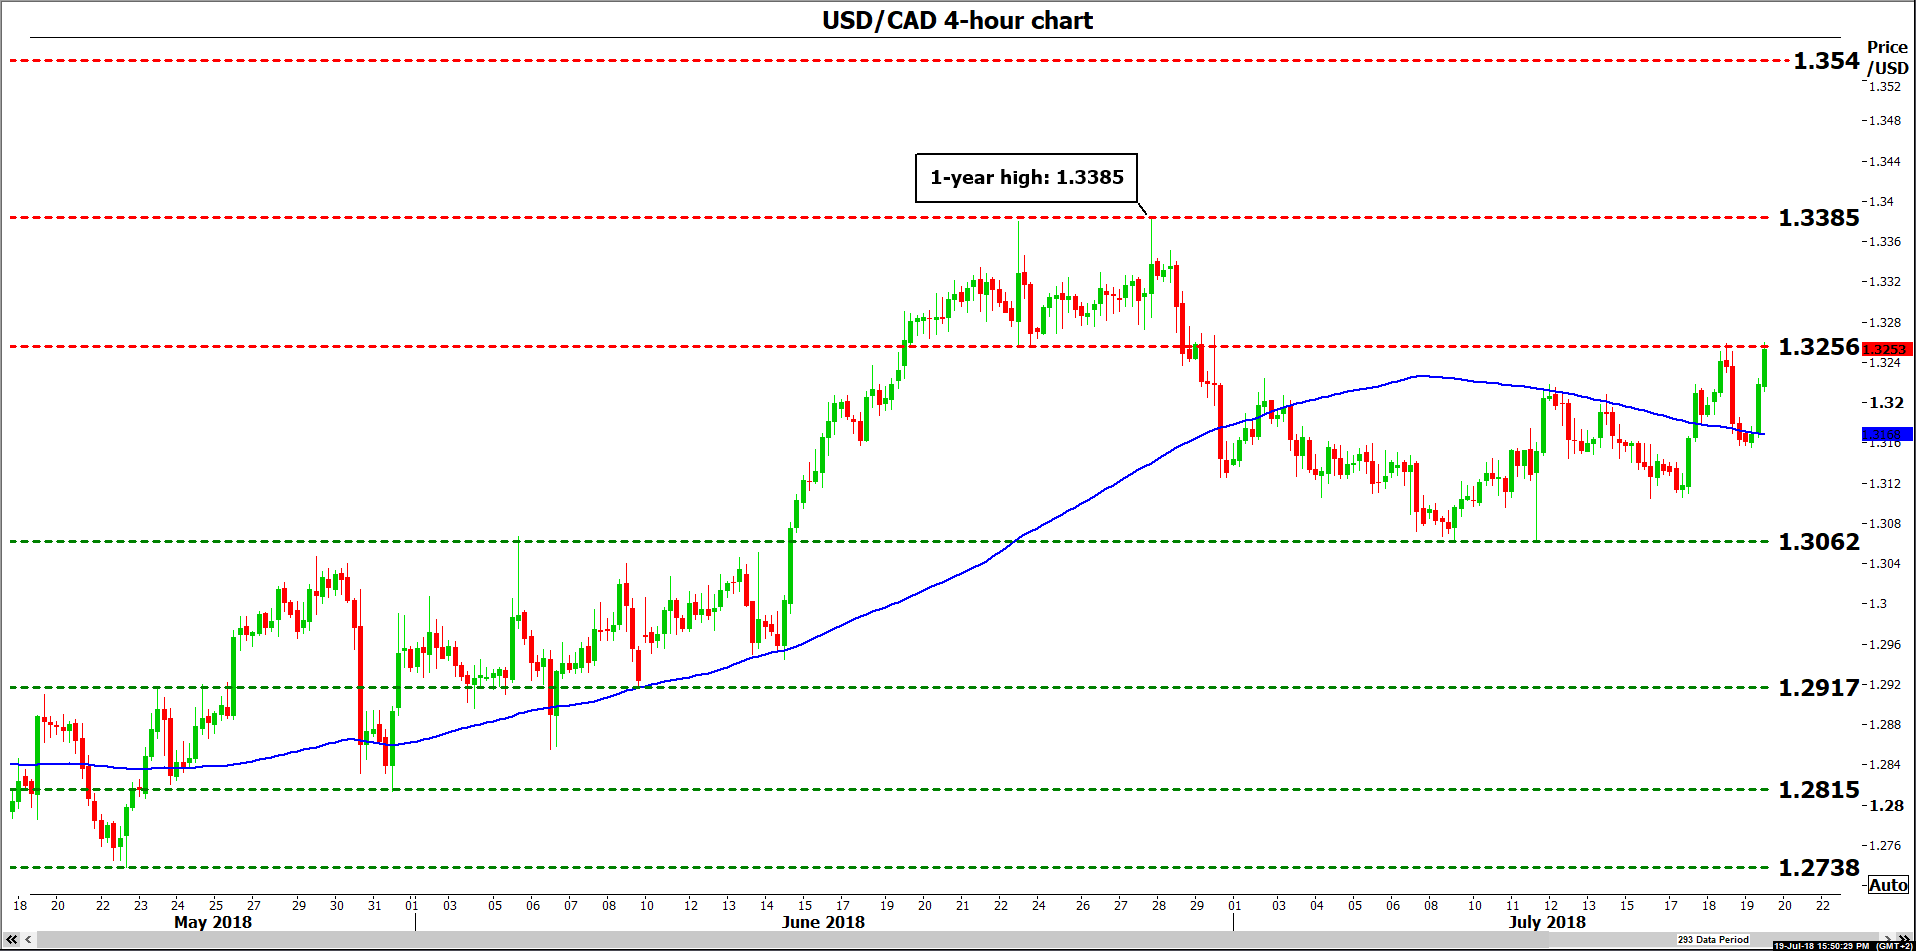
A strong set of data that amplifies the case for another rate increase this year is likely to help the loonie recover. Technically, declines in dollar/loonie may find the first line of support near 1.3062, the low of July 9. A downside break could open the way for the June 8 trough of 1.2917, with another break lower increasingly bringing into view the 1.2815 zone, defined by the low of May 31.
On the flipside, weaker-than-expected readings could push dollar/loonie higher, as investors begin to doubt whether the BoC will touch the hiking button again soon. In such a case, if the pair has a successful closing session above 1.3256, marked by the inside swing low of June 22, the one-year high of 1.3385 would come into view before the focus shifts to 1.3540, the peak from 9 June 2017.
In the big picture, beyond economic data and expectations around the BoC, the loonie’s broader direction will also depend on the outlook for global trade and specifically, whether some NAFTA deal is reached in the foreseeable future. Judging by the fact the loonie has weakened substantially in recent months even despite a vibrant Canadian economy and higher oil prices, markets seem to have priced in a rather adverse outcome. This implies that any encouraging developments around NAFTA could lead to an outsized positive reaction in the loonie, though there is currently little to suggest anything like that is imminent.