Sample Category Title
EUR/USD Could Reverse Gains
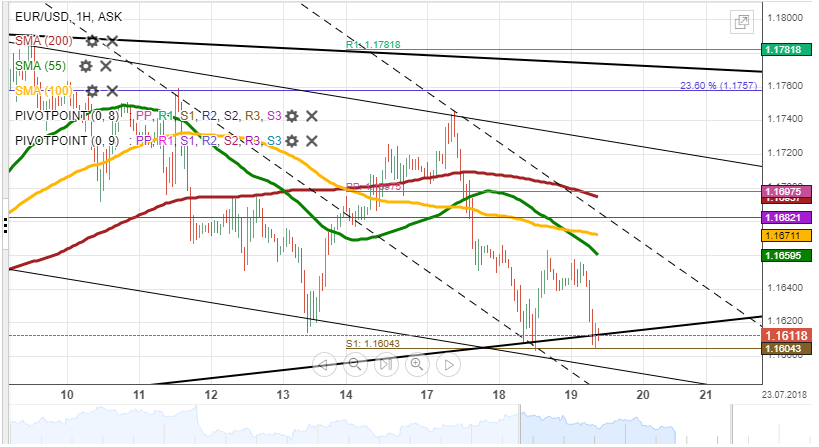
EUR/USD continued its decline during the first part of Wednesday's trading session, thus adding additional 45 pips to the 90 pip fall apparent on the previous day. This downside movement reversed north after the pair reaching the weekly S1 at 1.1605. The bottom boundary of the medium-term wedge was adjusted accordingly in order to include this price development.
By the time of this analysis, bulls have managed to push the rate close to the 55– and 100-hour SMAs; thus is expected that these lines are reached during the following hours.
Further advance is unlikely, given that the monthly PP at 1.1680 is likewise strengthened by the 100– and 200-period (4H) SMAs. This resistance cluster should increase downside risks and thus send the Euro lower towards 1.16. Technical indicators support this scenario.
GBP/USD Recovers From Eight-Month Low
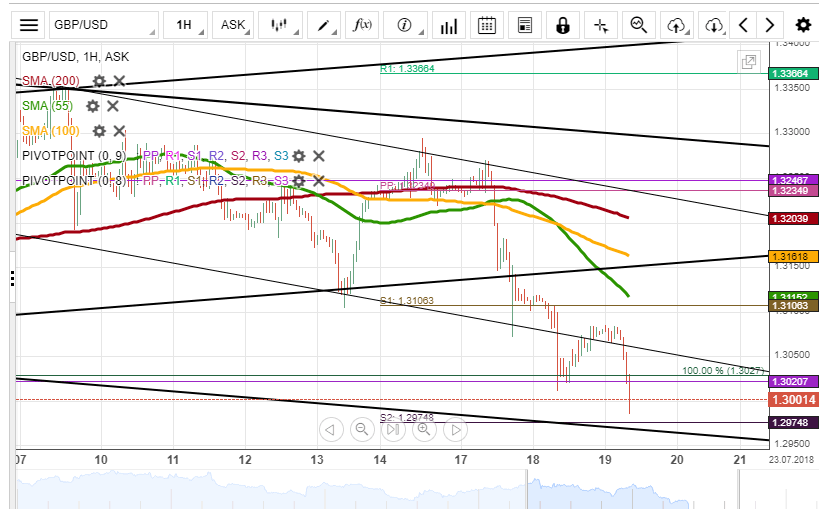
Despite hindering the pair for several hours, the weekly S1 was eventually breached at 1.3106 early on Wednesday. Bearish momentum was strengthened by rather sluggish UK CPI data which sent the Pound for a 44-pip hourly plunge. This paved the way for a fall down to the eight-month low and the monthly S1 at 1.3020, thus resulting in a southern breakout of a two-week channel down.
The rate has since recovered and been moving towards the 55-hour SMA at 1.3130. The 100– and 200-hour SMAs are likewise located nearby—resistance which is likely to limit gains today. Upside potential is apparent until 1.32 although the pair might not reach as high.
In case of some bearish movement, the aforementioned 2018 low should work as an unbreakable support.
USD/JPY Returns to 55-Hour SMA
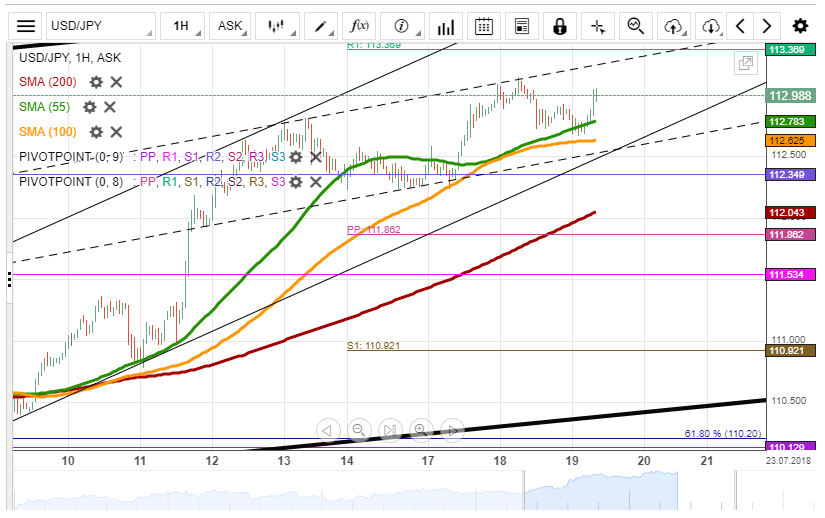
USD/JPY has been moving in a one-week ascending channel. The pair reversed from its upper boundary early on Wednesday and began depreciating in a gradual manner. This fall was not significant, as the Greenback was hindered near the 55– and 100-hour SMAs.
The former has worked effectively at supporting the pair on previous occasions; thus, it is likely that the pair continues to move higher in this session, as well. The nearest resistance is the weekly R1 and the 2018 high at 113.50; a move above this cluster is unlikely.
In case bears prevail in the market today and thus breach the 55– and 100-hour SMAs, the US Dollar would be pushed down to the monthly R2 at 112.35. This could point to the beginning of a few-day decline.
XAU/USD Fails To Overcome Monthly S1
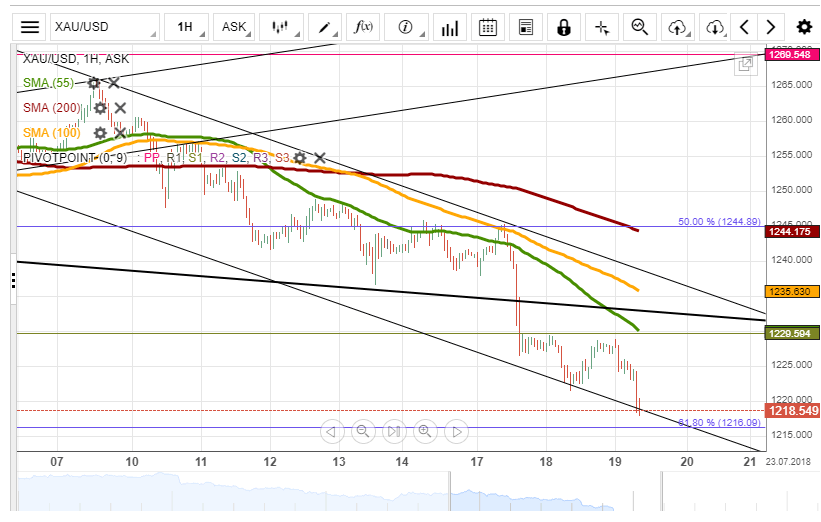
The strong 1% plunge of the XAU/USD exchange rate mid-Tuesday was followed by minor fluctuations in between the monthly S1 and a channel line at 1,320.00 and 1,222.50, respectively. This situation had not changed on Thursday morning, as well.
Technical indicators are generally neutral for this session, but it is likely that the 55-hour SMA continues to pressure Gold lower. The nearest support that could limit this fall is the 61.80% Fibonacci retracement at 1,216.00. These retracement lines were re-drawn today from the 2017/2018 low of 1,122.80, as the previous seven-month low was breached yesterday.
In general, the rate should move towards the upper channel line during the remaining part of this week.
NZDUSD Posts Strong Losses, Lower Bollinger Band Would Act As Strong Support
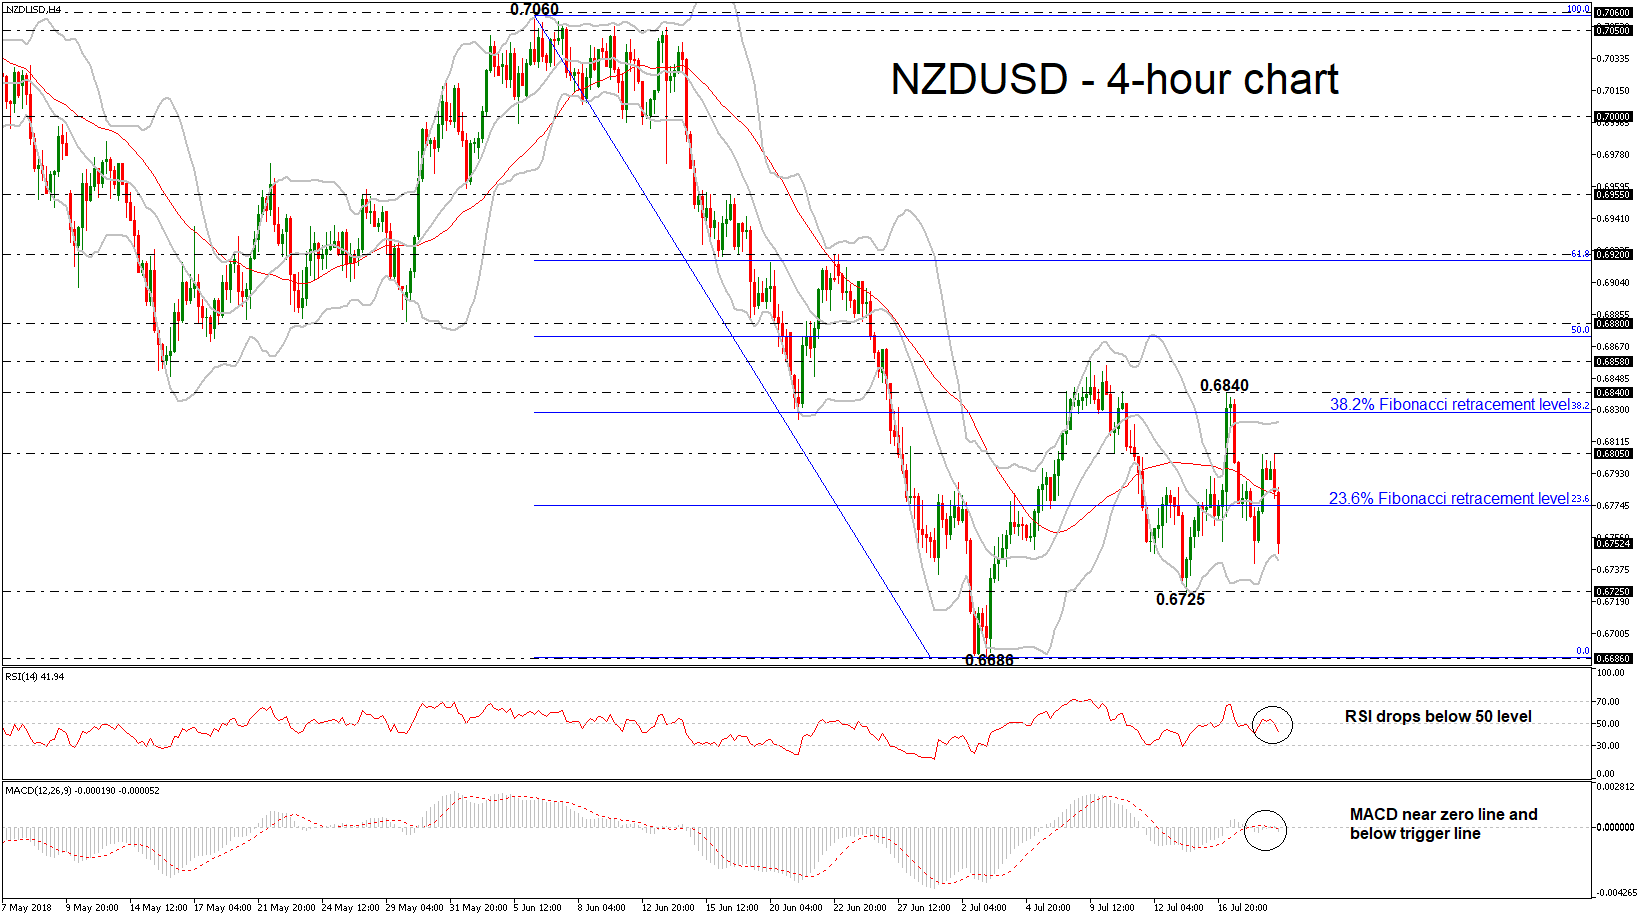
NZDUSD edged sharply lower today following the bounce off the 0.6805 resistance level, driving the pair below the 23.6% Fibonacci retracement level of the downleg from 0.7060 to 0.6686, around 0.6775. This week, the pair is on the backfoot and the technical indicators suggest that the market could ease a little bit in the short-term.
The technical structure suggests that an aggressive sell-off is in progress. The RSI indicator slipped below the threshold of 50 and is moving towards the 30 level, while the MACD oscillator dropped below its trigger line but remains close to the zero line.
If the price dives below the lower Bollinger Band near 0.6742, it could challenge again the 0.6725 support level. Steeper decreases could drive the pair south towards the more than one-year low of 0.6686, taken from the low on July 3.
On the flip side, if the price climbs above the 23.6% Fibonacci (0.6775) in the next few sessions, immediate resistance could be met at the 0.6805 high. A significant close above the latter would touch the 38.2% Fibonacci of 0.6828, raising chances for further increases.
Overall, NZDUSD remains in a bearish picture in the medium-term as it failed to complete a significant upside retracement movement.
The Analytical Overview Of The Main Currency Pairs
The EUR/USD currency pair
Technical indicators of the currency pair:
Prev Open: 1.16596
Open: 1.16366
% chg. over the last day: -0.14
Day's range: 1.16255 – 1.16566
52 wk range: 1.0571 – 1.2557
Yesterday's trading on the EUR/USD currency pair was very active. However, a unidirectional trend was not observed. At the moment, quotes are testing local support and resistance levels: 1.16250 and 1.16500, respectively. The trading instrument is tending to decline. We are waiting for statistics from the USA. We recommend opening positions from the key levels.
The news feed on 2018.07.19:
At 15:30 (GMT+3:00) the index of production activity from the Federal Reserve Bank of Philadelphia will be published.
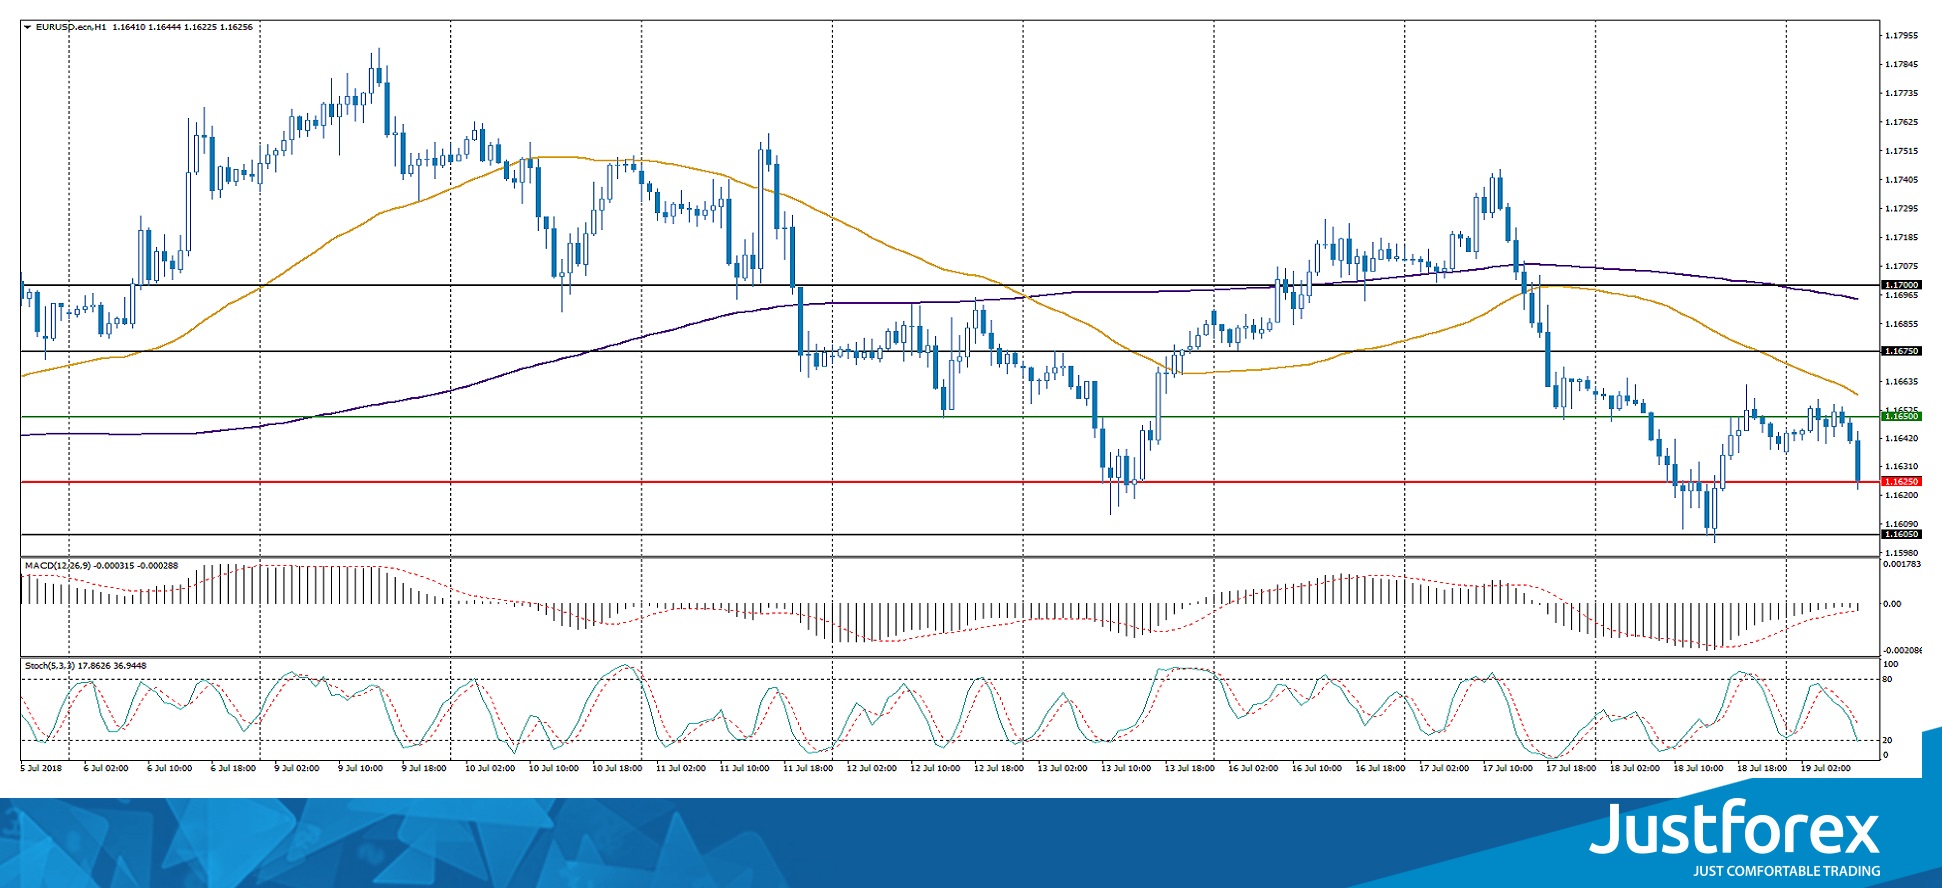
Indicators point to the power of sellers. The price has fixed below 50 MA and 200 MA.
The MACD histogram is located in the negative zone and continues to decline, which indicates a bearish sentiment on the EUR/USD currency pair.
Stochastic Oscillator is in the neutral zone, the %K line is below the %D line, which also gives a signal to sell EUR/USD.
Trading recommendations
Support levels: 1.16250, 1.16000, 1.15500
Resistance levels: 1.16500, 1.16750, 1.17000
If the price is fixed below 1.16250, further fall of the EUR/USD currency pair is expected. The movement is tending to 1.16000-1.15500.
Alternative option. If the price fixes above the resistance level of 1.16500, it is necessary to consider buying EUR/USD. The movement is tending to 1.16750-1.17000.
The GBP/USD currency pair
Technical indicators of the currency pair:
Prev Open: 1.31103
Open: 1.30659
% chg. over the last day: -0.29
Day's range: 1.30441 – 1.30832
52 wk range: 1.2361 – 1.4345
Yesterday, GBP/USD continued to decline. Pressure on the pound was put by a weak inflation report in the UK. In June, the consumer price index counted to 2.4% (year on year), which is below the market expectations of 2.6%. At the moment, the GBP/USD is testing local support and resistance levels: 1.30400 and 1.30800, respectively. In the near future, a technical correction is not ruled out. Positions must be opened from the key levels.
At 11:30 (GMT+3:00) a report on retail sales in the UK will be published.
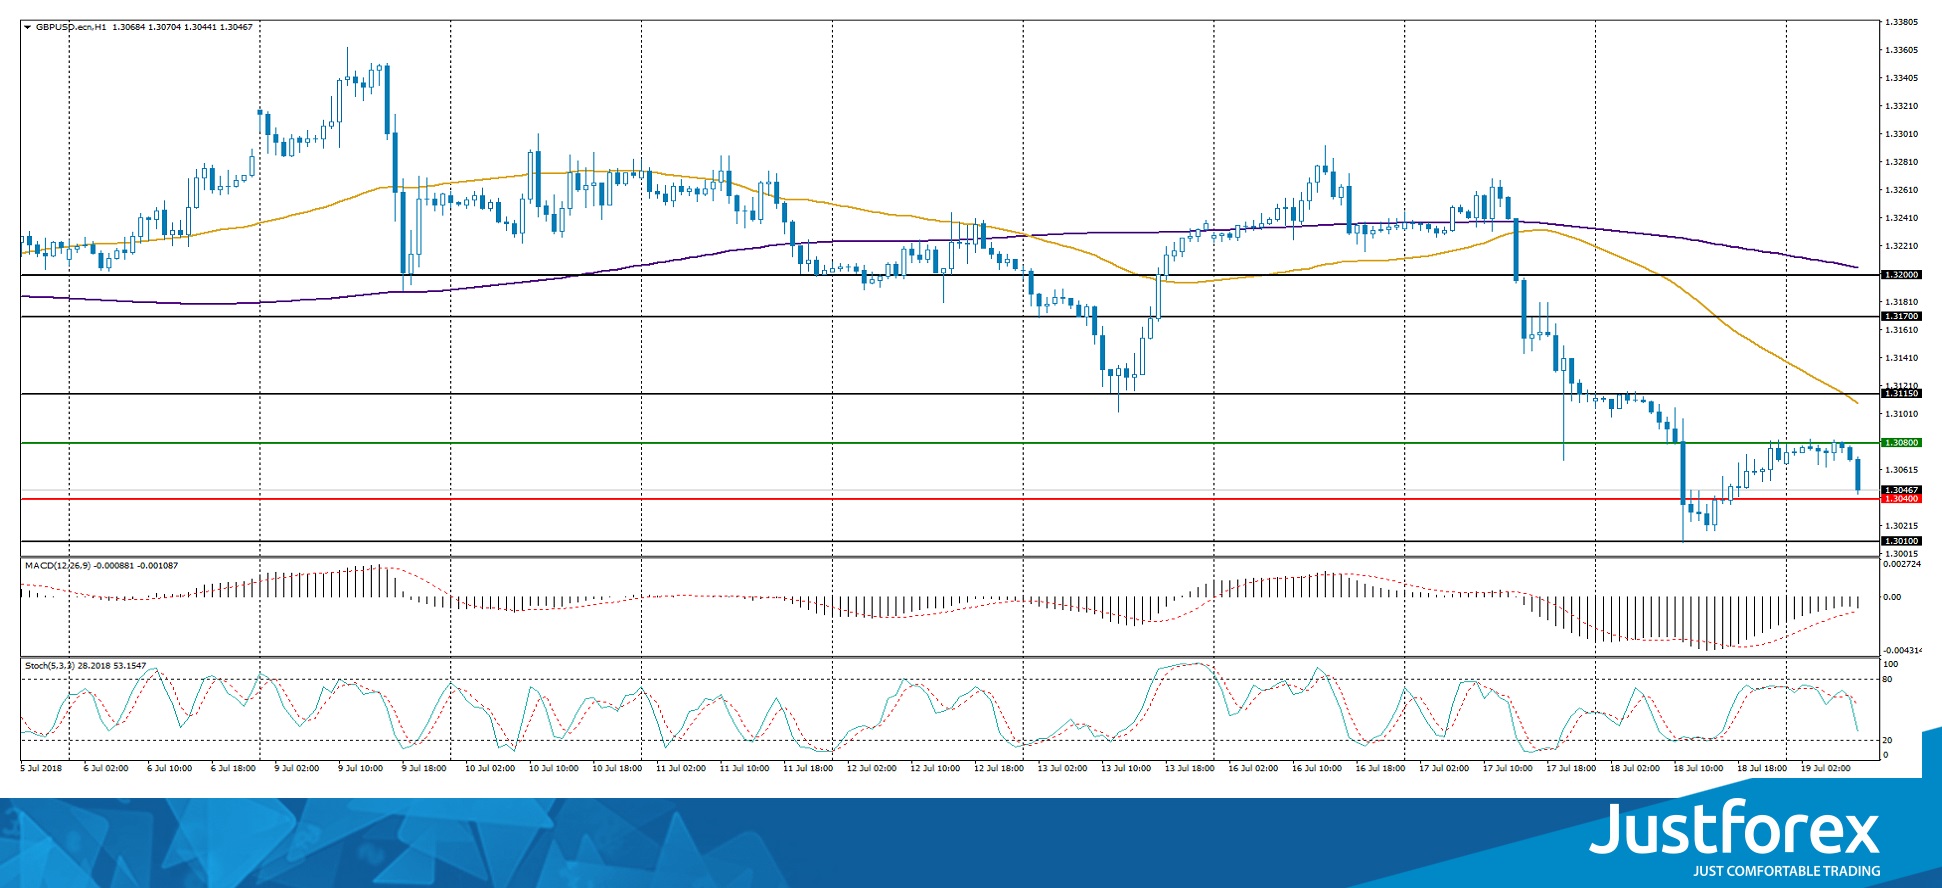
Indicators point to the power sellers. The price has fixed below 50 MA and 200 MA.
The MACD histogram is in the negative zone and continues to decline, which signals a bearish sentiment.
Stochastic Oscillator is located in the neutral zone, the %K line is below the %D line, which sends a signal to sell GBP/USD.
Trading recommendations
Support levels: 1.30400, 1.30100, 1.29750
Resistance levels: 1.30800, 1.31150, 1.31700
If the price falls below the support level of 1.30400, further drop in the GBP/USD price is expected. The closest target for fixing profits is the mark of 1.30100-1.30000.
Alternative option. If the price fixes above 1.30800, a correction movement is expected. The movement is tending to 1.31150-1.31400.
The USD/CAD currency pair
Technical indicators of the currency pair:
Prev Open: 1.31928
Open: 1.31654
% chg. over the last day: -0.16
Day's range: 1.31598 – 1.31936
52 wk range: 1.2059 – 1.3795
During yesterday's trading the bearish sentiment prevailed on the USD/CAD currency pair. The Canadian dollar has recovered a significant part of the losses. At the moment the USD/CAD quotes are testing the "mirror" resistance of 1.31900. The key support is the mark 1.31600. We are waiting for statistics from the USA. We recommend opening positions from the key levels.
The news feed on economy of Canada is calm.
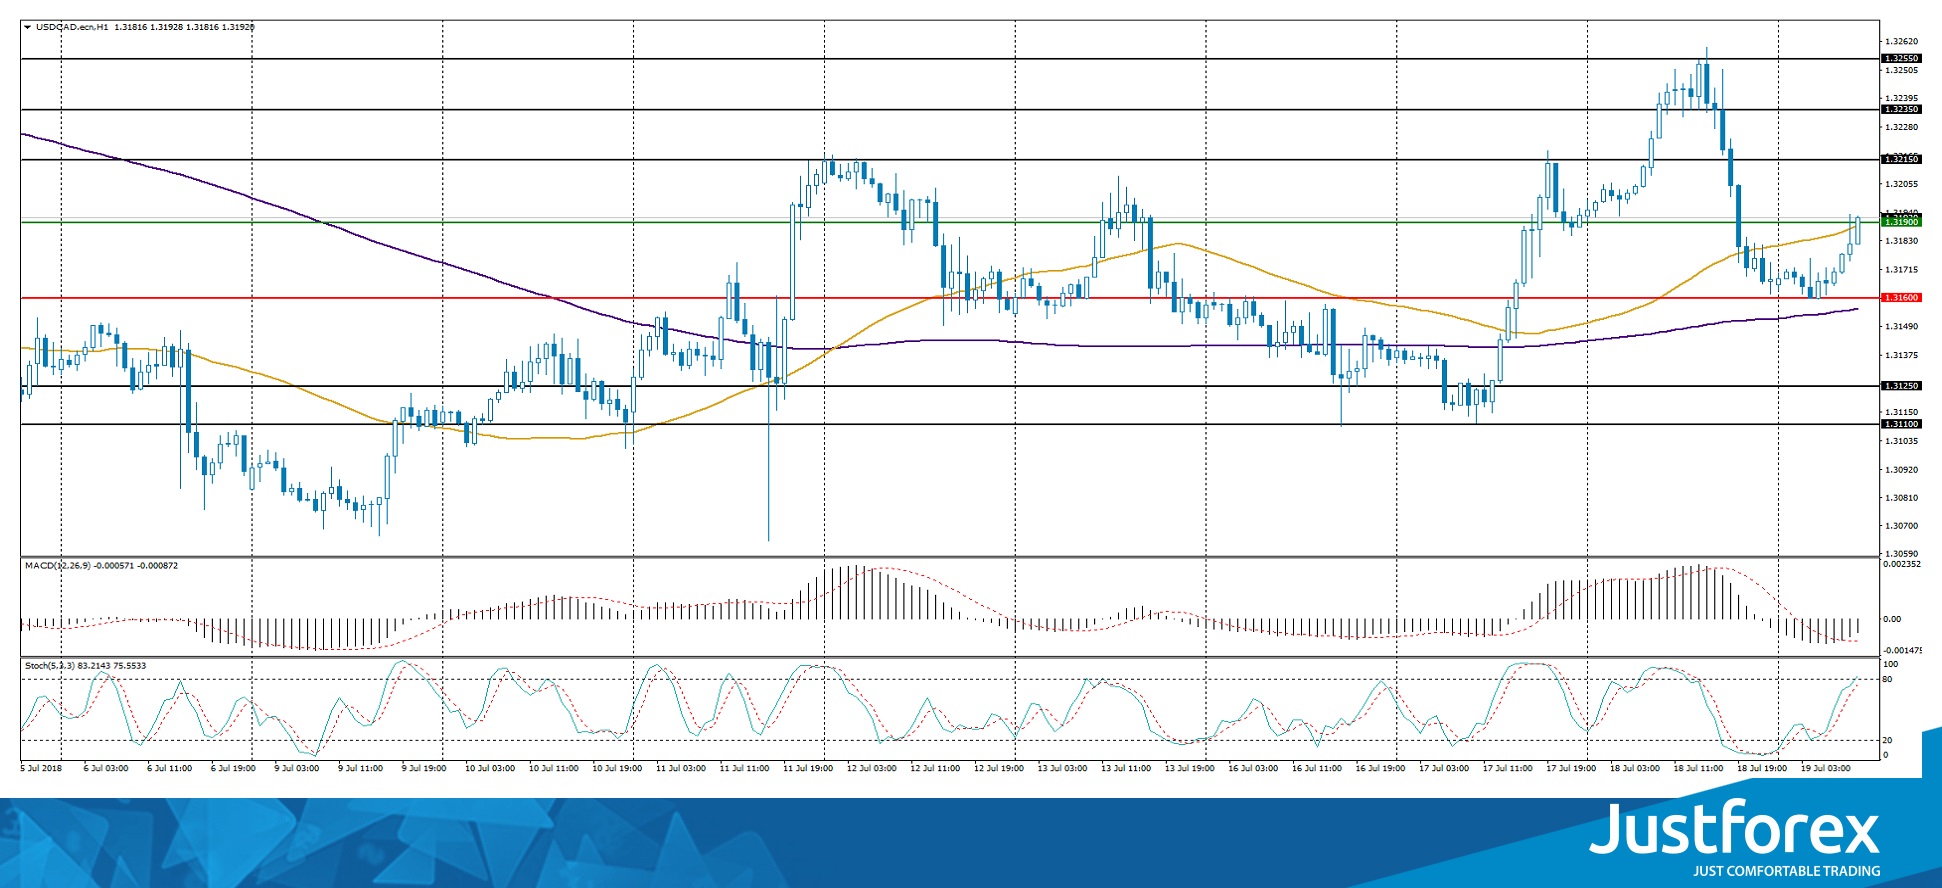
Indicators do not send accurate signals. The price has crossed 50 MA.
The MACD histogram is in the negative zone, but above the signal line, which gives a weak signal to sell USD/CAD.
Stochastic Oscillator is located in the neutral zone, the %K line is above the %D line, which indicates the bullish sentiment.
Trading recommendations
Support levels: 1.31600, 1.31250
Resistance levels: 1.31900, 1.32150, 1.32350
If the price fixes above the "mirror" resistance of 1.31900, it is necessary to consider buying USD/CAD. The movement is tending to 1.32150-1.32350.
Alternatively, USD/CAD may drop to 1.31600-1.31500.
The USD/JPY currency pair
Technical indicators of the currency pair:
Prev Open: 112.858
Open: 112.829
% chg. over the last day: -0.06
Day's range: 112.652 – 112.966
52 wk range: 104.56 – 114.74
On the USD/JPY currency pair there was an ambiguous technical pattern. The trading instrument is in a sideways trend. The USD/JPY quotes are testing monthly highs. The key levels of support and resistance are: 112.700 and 113.100 respectively. Correction is not ruled out in the near future. We recommend paying attention to the news feed on the US economy.
In the Asian trading session, mixed data on trade balance of Japan were published.
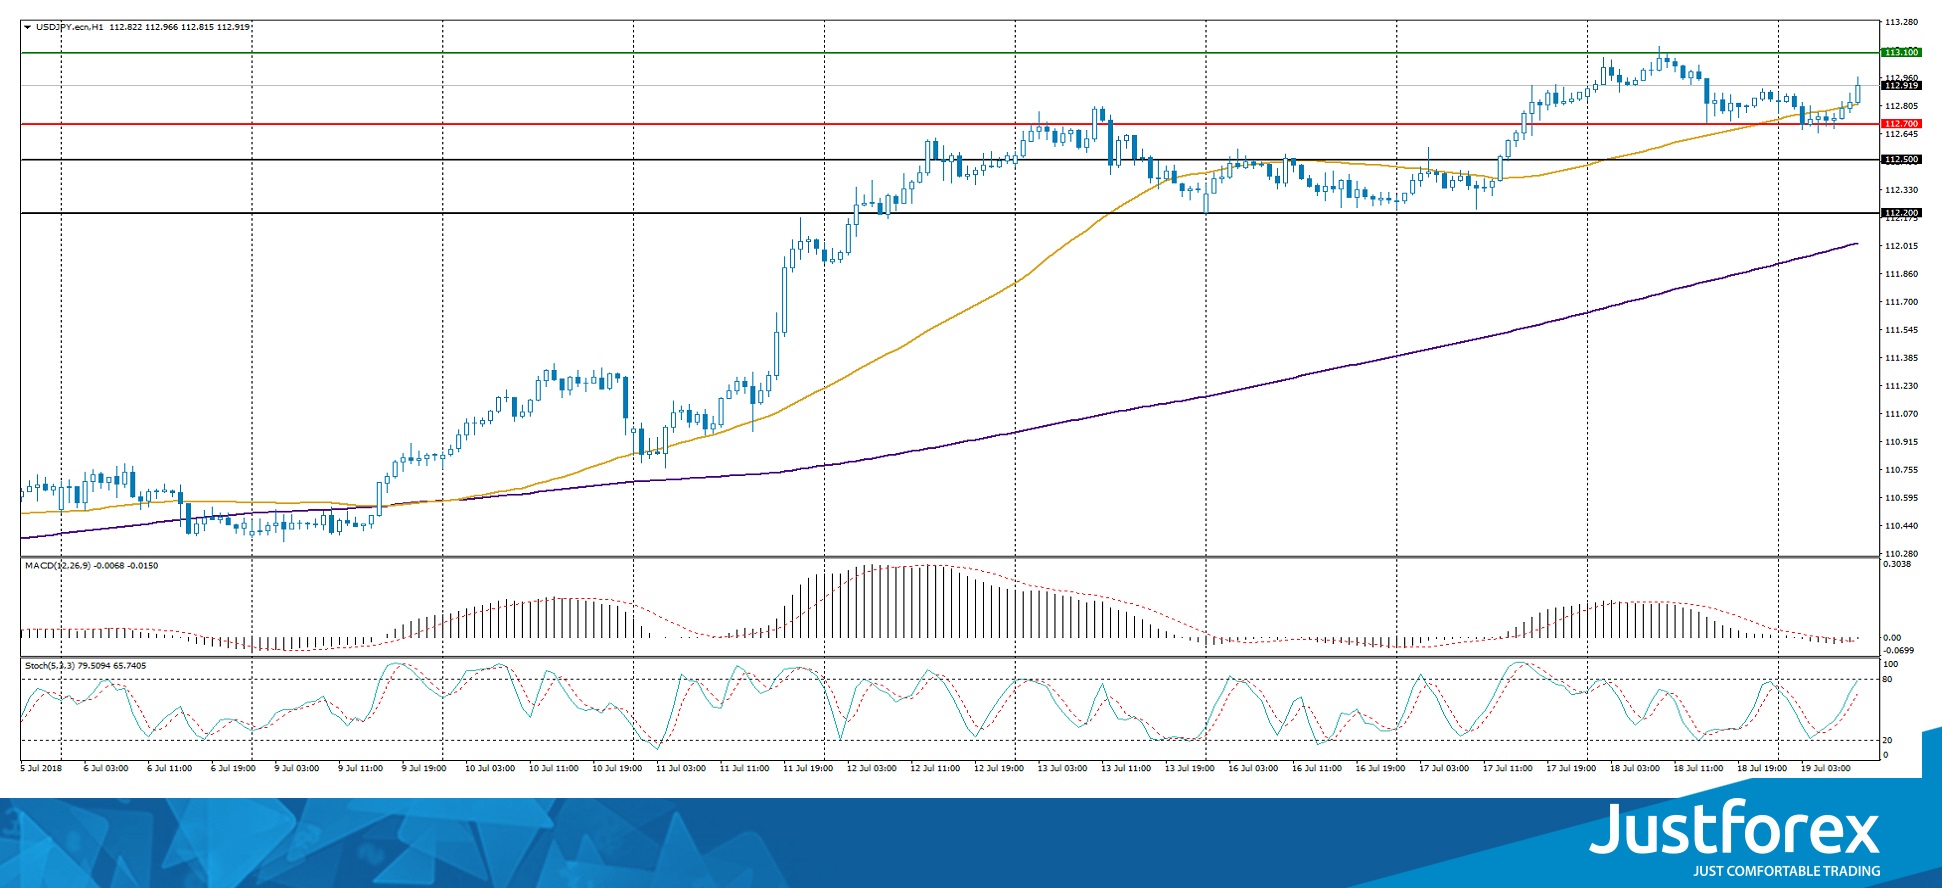
Indicators do not send accurate signals. The price has crossed 50 MA.
The MACD histogram is located near the 0 mark.
Stochastic Oscillator is located in the neutral zone, the %K line is above the %D line, which indicates the growth of USD/JPY.
Trading recommendations
Support levels: 112.700, 112.500, 112.200
Resistance levels: 113.100, 113.500
If the price fixes above the 113.100 level, further growth of the USD/JPY currency pair is expected. The movement is tending to 113.500-113.750.
Alternative option. If the price fixes below the 112.700 level, a correction movement is expected. The target level of movement is 112.500-112.200.
The US Currency Is Stable
The US dollar continued to strengthen against the basket of major currencies. The US dollar index (#DX) reached the highest mark for two weeks and closed in the positive zone (+0.15%). Yesterday the Fed's Beige Book was published, which pointed to further growth of the US economy. However, despite this, the growth is limited due to employee scarcity and an increase in the raw materials prices. Additional pressure is put by the trade conflict between the US and China.
Yesterday, a number of important economic data were also published. The consumer price index in the UK was 2.4% (year on year) and was worse than the forecasted value of 2.6%. The consumer price index in the Eurozone met investors’ expectations and amounted to 2.0% (year on year). The number of building permits issued in the US fell to 1.273M, while experts expected the value of 1.330M. Today in the Asian trading session a report on the labor market for June in Australia was published, which showed that the number of employees increased by 50.9K instead of the expected value of 16.7K.
The "black gold" prices are falling against the backdrop of growing crude oil inventories in the US. At the moment, futures for the WTI crude oil are testing the mark of $67.65 per barrel.
Market Indicators
Yesterday, a variety of trends was observed in the US stock market: #SPY (+0.21%), #DIA (+0.30%), #QQQ (-0.19%).
At the moment, the yield of 10-year US government bonds is at the level of 2.87-2.88%.
The news feed on 2018.07.19:
A report on retail sales in the UK at 11:30 (GMT+3:00);
The index of manufacturing activity from the Federal Reserve Bank in the US at 15:30 (GMT+3:00).
XAUUSD Intraday Analysis
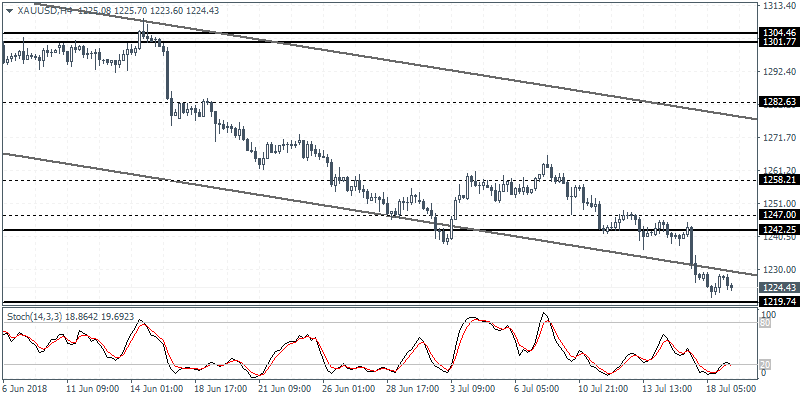
XAUUSD (1224.43): Gold prices were seen extending the losses on the day as price action fell just short of the 1219.74 level of support. Despite pulling back to close the day flat, early trading today suggests renewed decline in price action. The Stochastics on the 4-hour chart indicates a higher low which could signal a near term rally to the upside. Gold prices are expected to pull back toward 1242.25 level where resistance is likely to keep a lid on the gains.
USDJPY Intraday Analysis
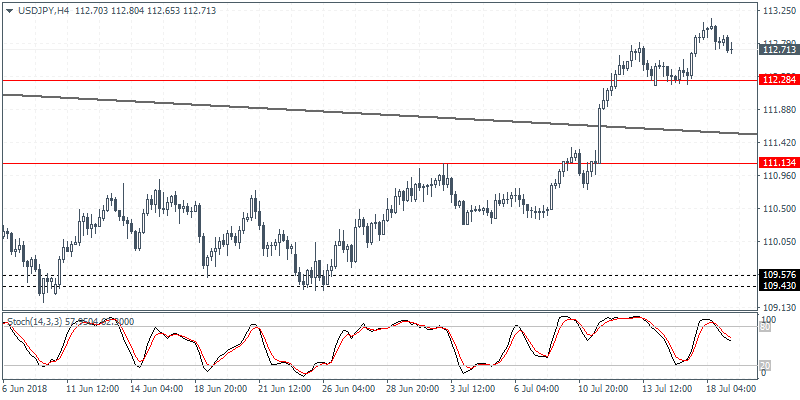
USDJPY (112.71): The USDJPY currency pair was seen easing back following the rally toward the 113.11 handle. Price action on the daily chart closed with a doji which comes near the top end of the rally. A bearish close today could potentially signal a near term pull back in prices. Support at 112.28 remains the key level of interest in the short term. A breakout below this level could signal further declines to the next main support level seen at 111.13.
EURUSD Intraday Analysis
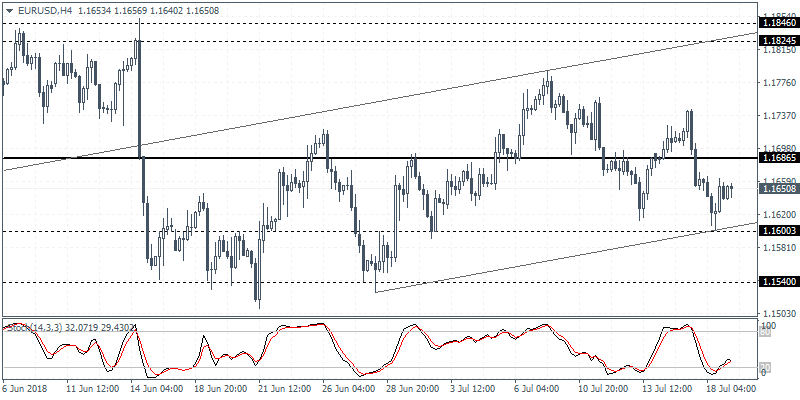
EURUSD (1.1650): The common currency was seen falling to intraday lows of 1.1606 before recovering toward the end of the day. The EURUSD closed on a bearish note and the consolidation near the 1.1606 level continues. The main resistance level is seen at 1.1730 and the currency pair is expected to maintain its range within these levels. A breakout above 1.1730 resistance could signal near term gains toward 1.1846 - 1.1824 in the short term.