

Sample Category Title
Elliott Wave Analysis: USDJPY Rallying Higher As Impulse
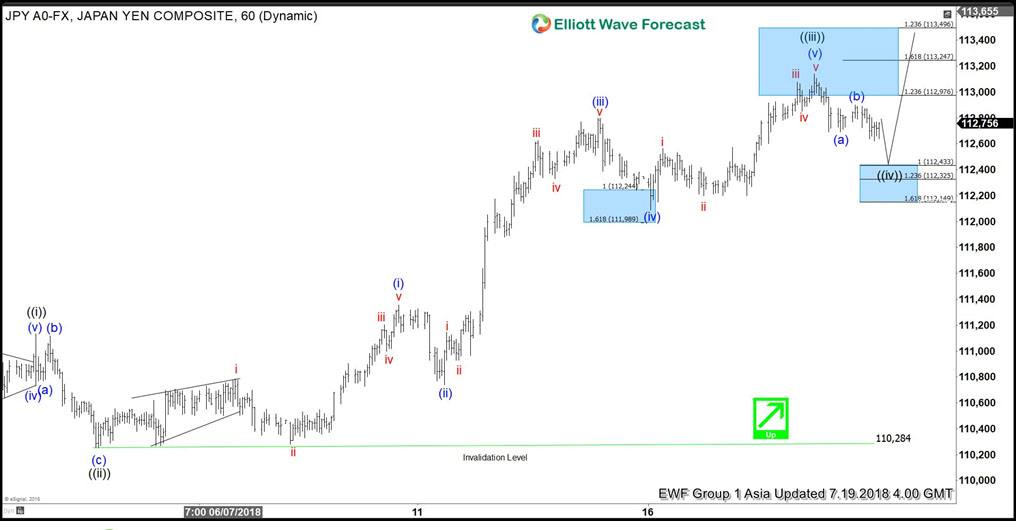
USDJPY short-term Elliott Wave analysis suggests that the pullback to 110.28 low ended Minute wave ((ii)) pullback. The internals of that pullback unfolded as Elliott wave Flat structure where Minutte wave (a) ended at 110.77. Up from there, bounce to 111.11 ended Minutte wave (b), and Minutte wave (c) of ((ii)) ended in 5 waves at 110.28 low.
The pair has since rallied within Minute wave (((iii)) rally as an Elliott wave impulse structure. Up from 110.28, the rally to 111.35 high ended Minutte wave (i) of ((iii)) as 5 waves. Afterwards, the pullback to 110.74 low ended Minutte (ii) of ((iii)), and pair rallied again in another 5 waves within Minutte wave (iii) of ((iii)) which ended at 112.8. Down from there the pullback to 112.09 low ended Minute wave (iv) of ((iii)), and the last leg Minutte wave (v) of ((iii)) is proposed complete at 113.38. Minute wave ((iv)) pullback is currently in progress in 3, 7, or 11 swings to correct the cycle from 7/4 low (110.28) before pair resumes the rally higher. We don’t like selling the pair.
USDJPY 1 Hour Elliott Wave Chart
Earnings Season Push Equities Higher, Dollar Remains The Favorable Currency
Asian equities followed Wall Street higher on Thursday, as investors cheered strong quarterly results from corporate America that have taken away the focus from trade jitters, for now at least.
Out of the 55 companies that announced results, 87% managed to beat earning estimates while only 7% missed the mark. With EPS growth exceeding 22% we are obviously heading towards the best earning season in 8 years. More interestingly, we started seeing rotation from non-cyclical to cyclical sectors over the past couple of days in a clear sign that investors are willing to take more risk. If this earnings momentum continues at its current pace the S&P 500 may take out the record high posted on 26 January; at the moment, the Index is just 57 points away from this record.
Fed Chair Jerome Powell's positive assessment of the U.S. economy and the fact that he downplayed the threat of a global trade war has also supported the risk-taking mood. He also believes that the expansionary fiscal policy will continue to fuel the economy for at least two years. Mr. Powell does not share market fears concerning the flattening yield curve. He believes that that long-run rates tell us where long-run neutral rate is and are not necessarily a sign of a looming recession. While this topic will continue being a hot one in the coming weeks and months, economists are still uncertain whether a yield curve inversion will lead to a recession or just a technical inversion due to the significant change in monetary policy after many years of quantitative easing.
The Dollar was the main beneficiary of Powell's testimony, with the DXY climbing back above 95, a striking distance from the previous one-year high of 95.53 that was met on 28 June.
Meanwhile, the Pound was hit by a combination of Brexit politics and weak inflation figures. GBPUSD fell to a key psychological level of 1.30 for the first time since September 2017 as markets started repricing expectations of an August rate hike. Markets were almost certain that a rate hike was coming on 3 August, but not anymore; this will likely keep the Pound under pressure during the coming days. If the BoE doesn't raise rates in two weeks, the central bank's credibility will be at stake which will likely lead to further selloff in Sterling.
EUR/USD Daily Outlook
Daily Pivots: (S1) 1.1606; (P) 1.1636 (R1) 1.1670; More.....
Intraday bias in EUR/USD remains mildly on the downside for 1.1507 low. Firm break there will resume whole decline from 1.2555, through 50% retracement of 1.0339 to 1.2555 at 1.1447 to 61.8% retracement at 1.1186. On the upside, in case of another rise as consolidation extends, upside should be limited by 1.1851 resistance to bring fall resumption eventually.
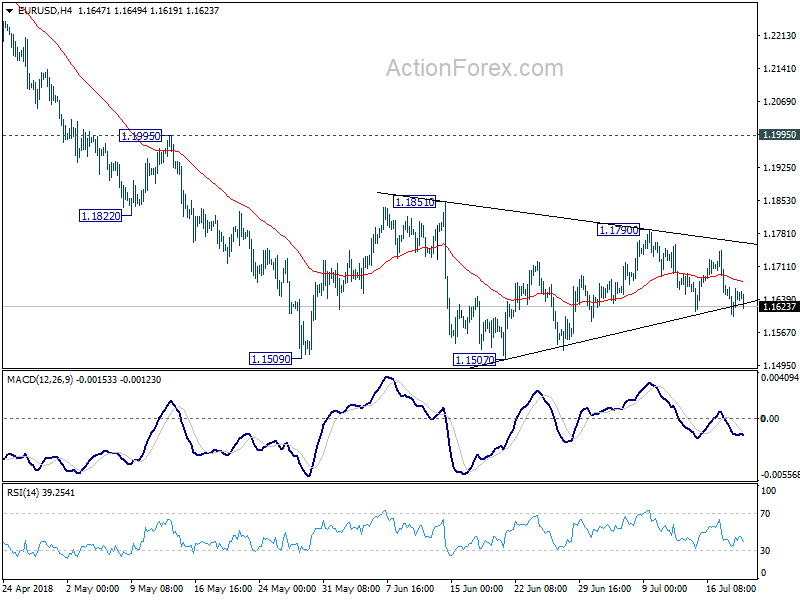
In the bigger picture, EUR/USD was rejected by 38.2% retracement of 1.6039 (2008 high) to 1.0339 (2017 low) at 1.2516. And, a medium term top was formed at 1.2555 already. Decline from there should extend further to 61.8% retracement of 1.0339 to 1.2555 at 1.1186 and below. For now, even in case of rebound, we won't consider the fall from 1.2555 as finished as long as 1.1995 resistance holds.

EURUSD Only Bearish Below 1.1650 Level
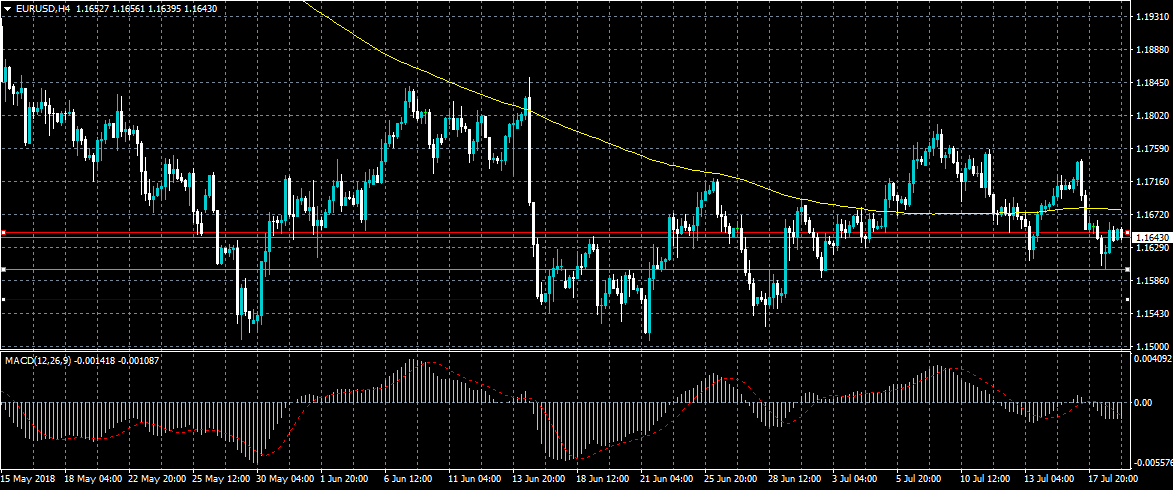
The euro has moved back towards the 1.1650 level after Federal Reserve Chair Jerome Powell struck a more dovish tone during the second part of his testimony before US Congress. The MACD indicator across the four-hour time frame is also showing bullish potential, however, price still trades below the 200-period moving average on the mentioned time frame. Sellers will once again target a break below the 1.1600 level, while buyers will look to push the price above the 200-period moving average.
The EURUSD pair is only bearish while trading below the 1.1650 level, key support is found at the 1.1630 and 1.1600 levels.
If the EURUSD pair moves above the 1.1650 level, buyers may once again test towards the 1.1684 and 1.1700 resistance levels.
USDJPY Correction Only Possible Below 112.80
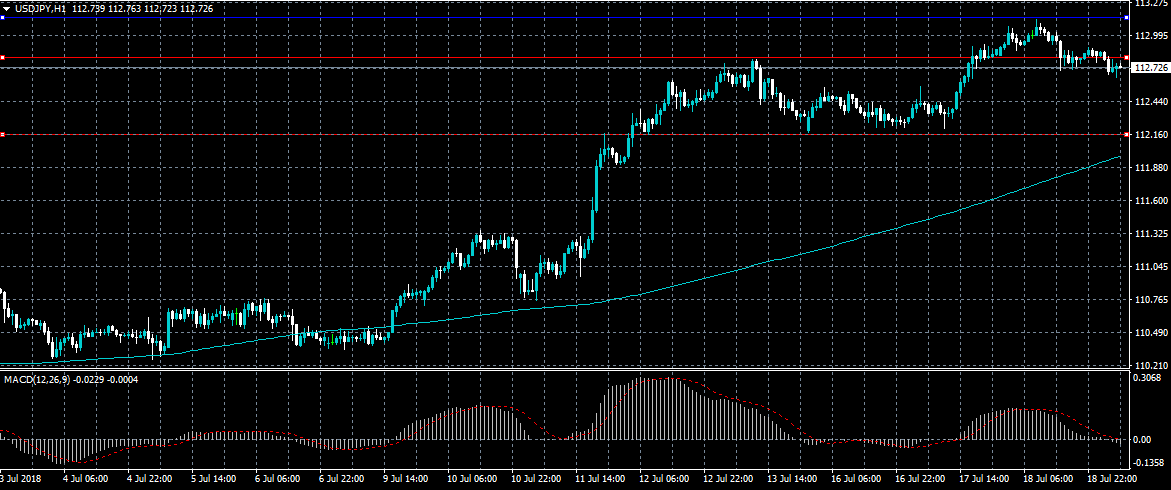
The US dollar has started to edge lower against the Japanese yen currency, following FED Chair Jerome Powell’s comments on US inflation at the second-half of his testimony on Wednesday. The USDJPY pair has broken below key support, and the four-hour time frame MACD indicator is also starting to turn lower. Sellers will likely target the 112.20 support region, while buyers will aim to reclaim the 113.00 level.
The USDJPY pair is only intraday bearish while below the 112.80 level, downside targets are found at the 112.20 and 111.70 levels.
If the USDJPY pair moves above the 113.00 level, buyers will likely test towards the 113.20 and 113.40 resistance levels.
GBP/USD Daily Outlook
Daily Pivots: (S1) 1.3009; (P) 1.3072; (R1) 1.3135; More...
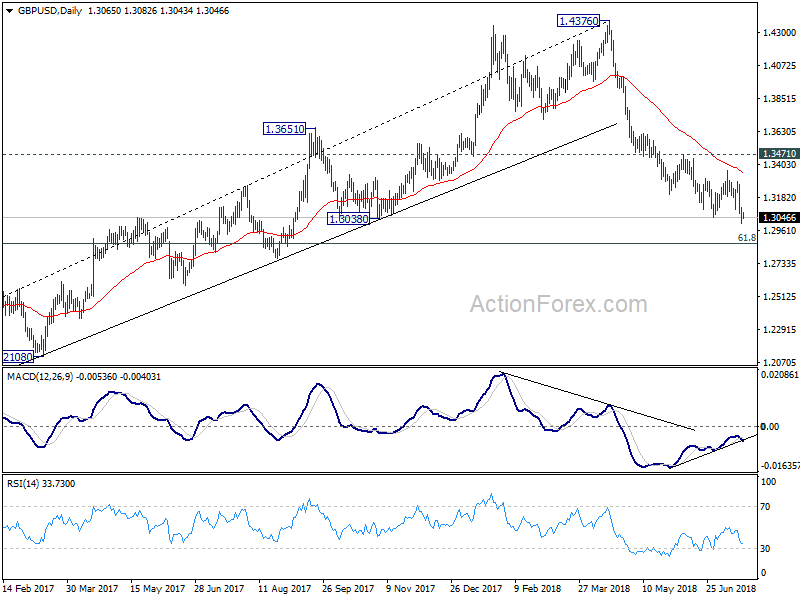
Intraday bas in GBP/USD remains on the downside with 1.3116 minor resistance intact. Current fall from 1.4376 should extend to 1.2874 fibonacci level next. Sustained break there will carry larger bearish implications. On the upside, above 1.3116 minor resistance will turn intraday bias neutral and bring consolidations first. But recovery should be limited well below 1.3362 resistance to bring fall resumption.
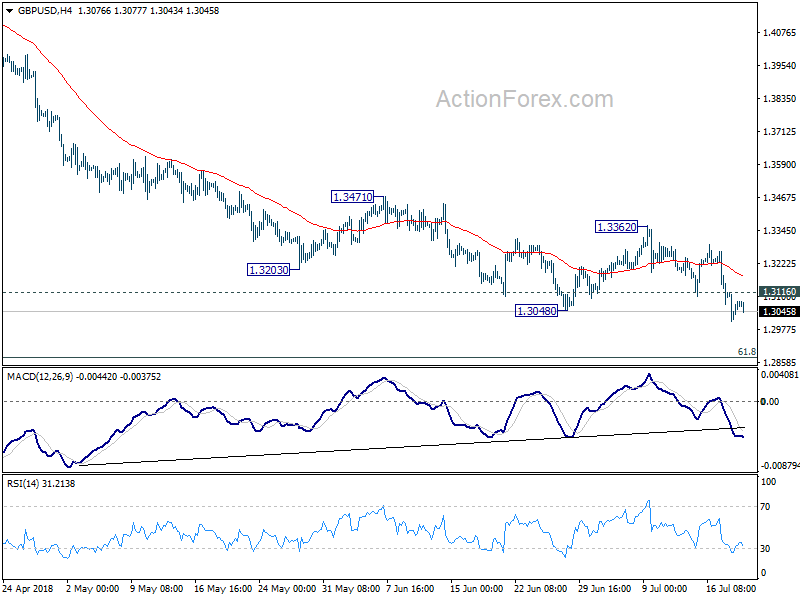
In the bigger picture, whole medium term rebound from 1.1946 (2016 low) should have completed at 1.4376 already, after rejection from 55 month EMA (now at 1.4179). Fall from 1.4376 should extend to 61.8% retracement of 1.1946 (2016 low) to 1.4376 at 1.2874 next. Decisive break of 1.2874 will raise the chance of long term down trend resumption through 1.1946 low. On the upside, break of 1.3471 resistance is needed to be the first indication of medium term bottoming. Otherwise, outlook will remain bearish even in case of strong rebound.
Ethereum Rides The Positive News Wave
Over the past five days, the price of Ether was up by more than 18%. While this rapid surge has eased, Ether is still up by 10%
The increase has been attributed to positive news. On Tuesday, Blackrock – one of the largest asset managers in the world – announced that it would start exploring cryptocurrencies. Traders believe that this will increase demand as other asset management firms take interest in the crypto sector.
In addition, the new Goldman Sachs CEO is known to favour cryptocurrencies. This is in contrast to the cautious views of former CEO Lloyd Blankfein. The hope is that other large banks will start taking cryptocurrencies seriously too with Goldman’s lead.
Yesterday, Jeremy Allaire – CEO of fintech start-up Circle – was interviewed by CNBC about Ether. In the interview, he talked positively about Ethereum and the technology behind it stating:
‘One of the things that really catalyzed the [cryptocurrency] market last year was actually that Ethereum, in particular, kind of got to a place where you could build apps on top of it. You could issue new tokens on top of it; you could create new kinds of financial contracts, using the smart contracts technology.’
His view is widely recognized in the cryptocurrency industry where many traders compare Ether to Bitcoin. The two are fundamentally different products. On one hand, Bitcoin was created to substitute fiat currencies. On the other hand, Ether was created as a decentralized product for building applications by smart contract technology.
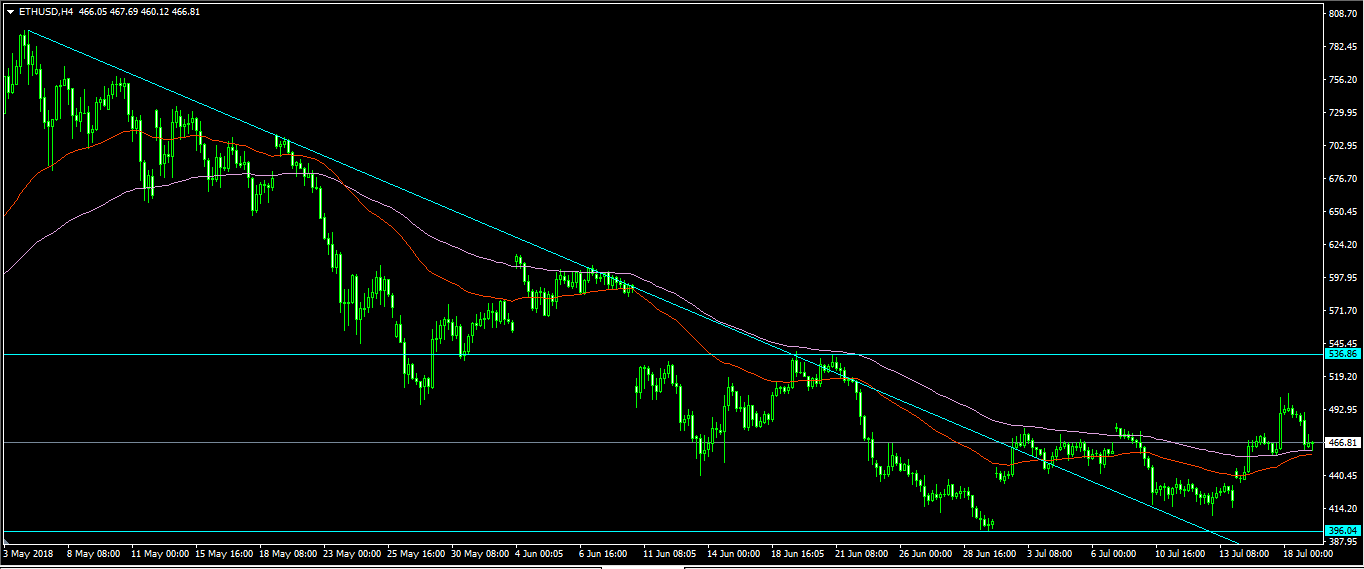
The ETH/USD pair is now trading at $466, which is above the multi-weekly low of $416. This price is also lower than the weekly high of $506 and is in line with the 50 and 100-day exponential Moving Average. As shown below, early this month, the ETH/USD pair crossed an important resistance level and has managed to stay above it. In light of positive news, the pair could reach the important resistance level of $535. Still, traders should be cautious about a downturn because, in the past, positive expectations on demand have not materialized into real action
Global Data Flows In The Spotlight On Thursday
A steady stream of economic data will headline the financial markets on Thursday following two days of congressional testimony by US Federal Reserve Chairman Jerome Powell. For currency traders, data continues to offer important insights about the health of national and regional economies, which plays an important role in forecasting monetary policy.
Switzerland kicks off the session with a report on trade scheduled for the early morning. Switzerland's surplus is forecast to widen in June on the strength of rising exports.
From there, we quickly shift our focus to the United Kingdom. At 08:30 GMT, the Office for National Statistics will report on retail sales for the month of June. Receipts at retail stores are projected to rise by 0.4% month-on-month after gaining 1.3% in May. In annualized terms, sales are projected to rise 3.9%.
The retail sales category likely expanded 0.3% on month and 3.7% annually, according to a median estimate of economists.
In the United States, initial jobless claims will hit the newswire at 12:30 GMT. The number of Americans filing for first-time unemployment benefits likely rose by 6,000 to a seasonally adjusted 220,000 in the week ended 10 July. Claims fell sharply the week before, partly due to seasonal influences.
At the same time, the Philadelphia Fed will release its monthly manufacturing survey. The July index is projected to read 22.0, up from 19.9 in June.
North of the border, ADP Inc. will release Canadian employment numbers at 12:30 GMT.
In terms of monetary policy, Fed policymaker Randal Quarles is scheduled to deliver a speech at 13:00 GMT.
EUR/USD
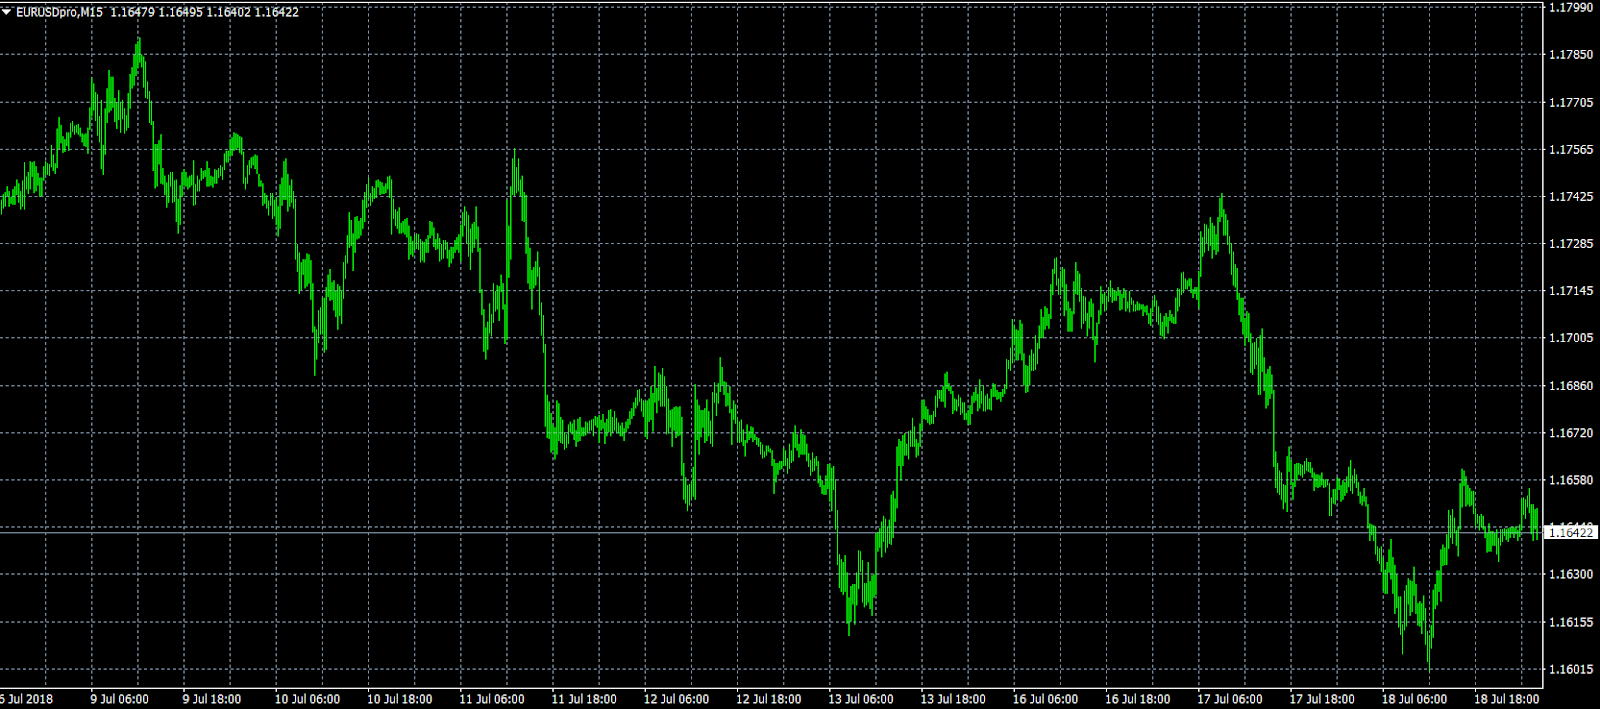
Europe's common currency was unable to break out of a downtrend on Wednesday, as prices remained capped below 1.1650 US. At the time of writing, EUR/USD was trading at 1.1640, where it was little changed compared with the previous close. In terms of technical, the pair faces firm resistance at 1.1660, which corresponds with the Wednesday high. On the opposite side of the spectrum, immediate support is located at 1.1600.
GBP/USD
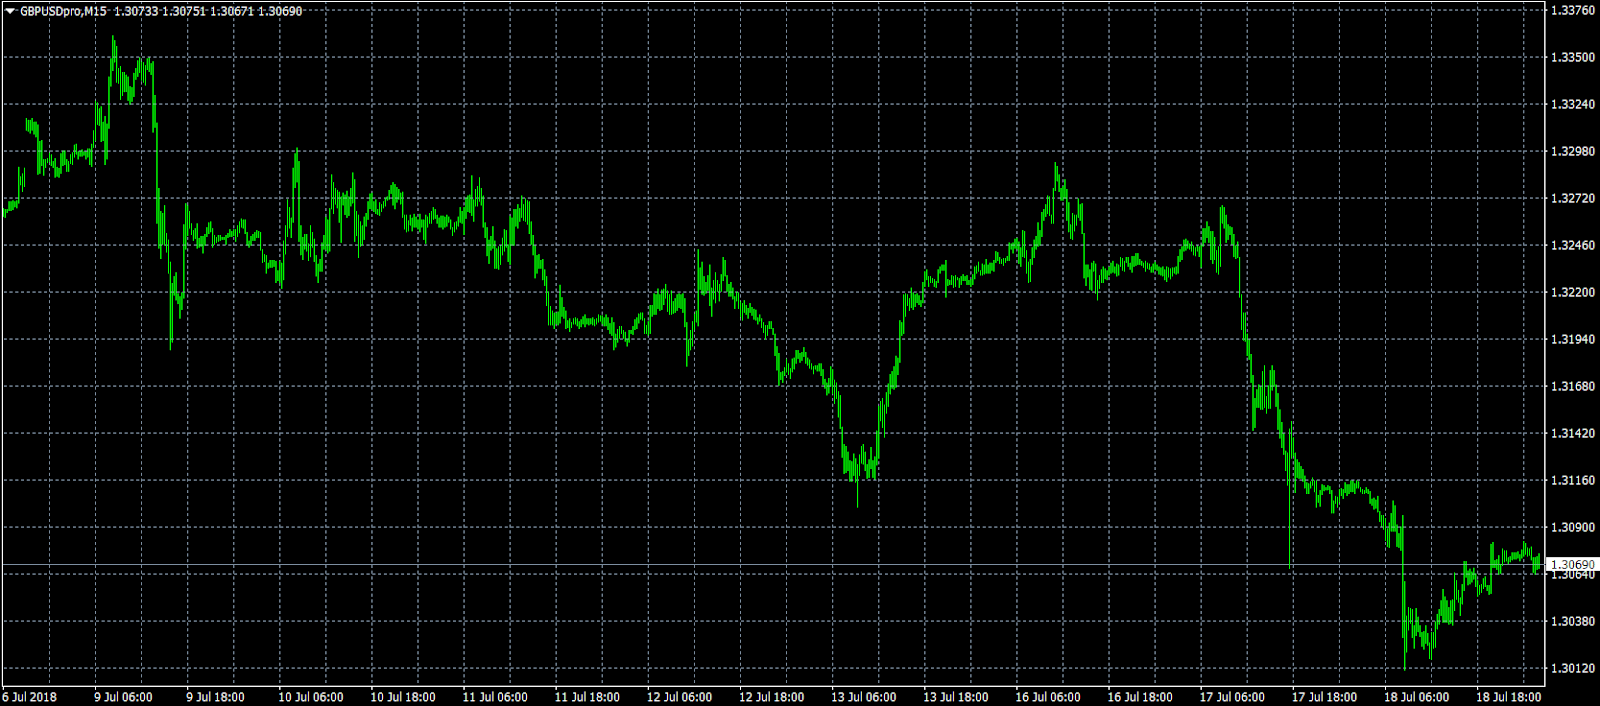
After crashing to a low of 1.3010 on Wednesday, cable managed to recover around the 1.3070 mark – still in a firm downtrend compared with last week. Since peaking at 1.3346 on 9 July, GBP/USD has lost nearly 300 pips. It was last trading at 1.3065. From a technical perspective, resistance is now seen at 1.3100. Support is weak at the intraday low of 1.3010, which also happens to be a new low for the year.
USD/JPY
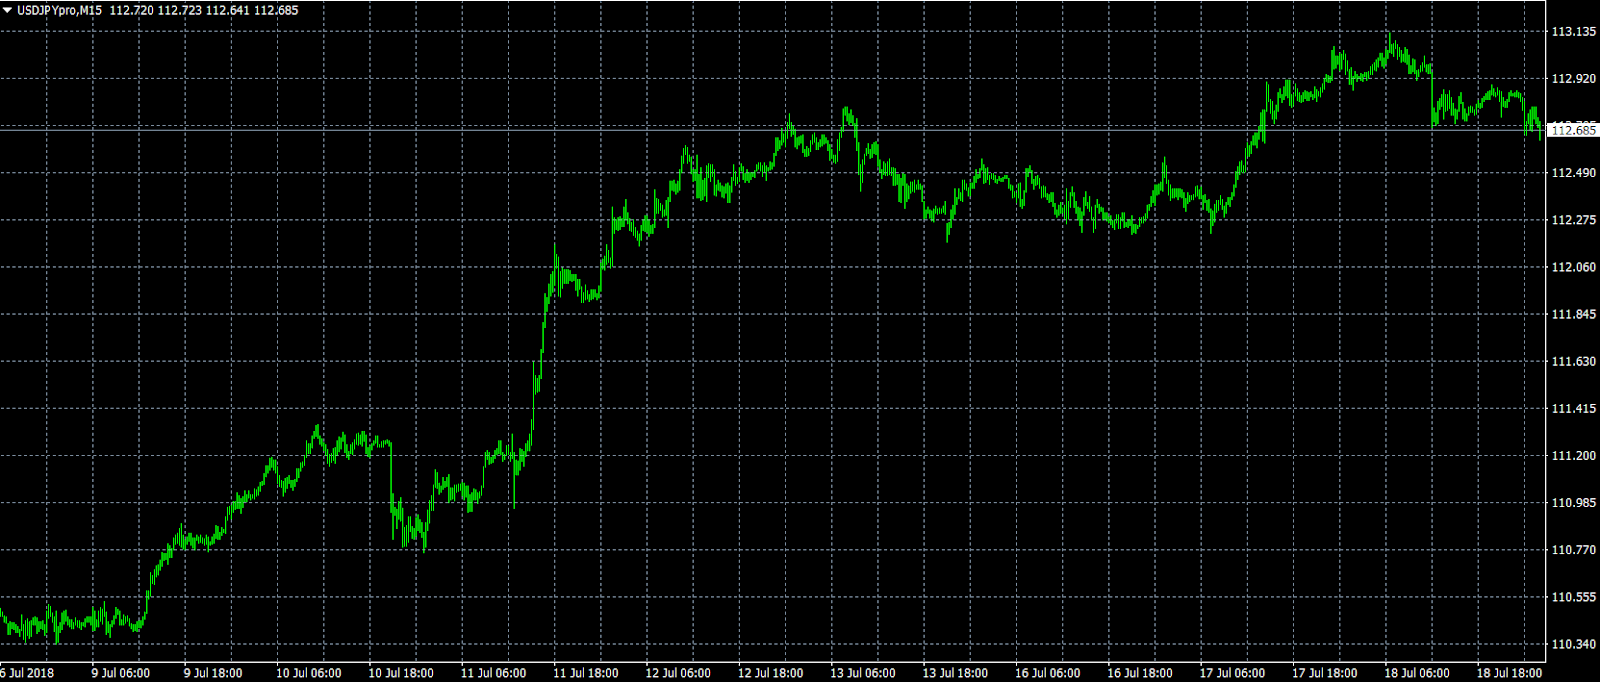
The dollar-yen exchange rate remains in a firm uptrend, with prices approaching yearly highs. At the time of writing, USD/JYP was trading at 112.76, little changed from the previous close. The bulls are now eyeing 113.00 and beyond as demand for safe havens continues to fade.
USD/CHF Daily Outlook
Daily Pivots: (S1) 0.9967; (P) 1.0001; (R1) 1.0025; More...
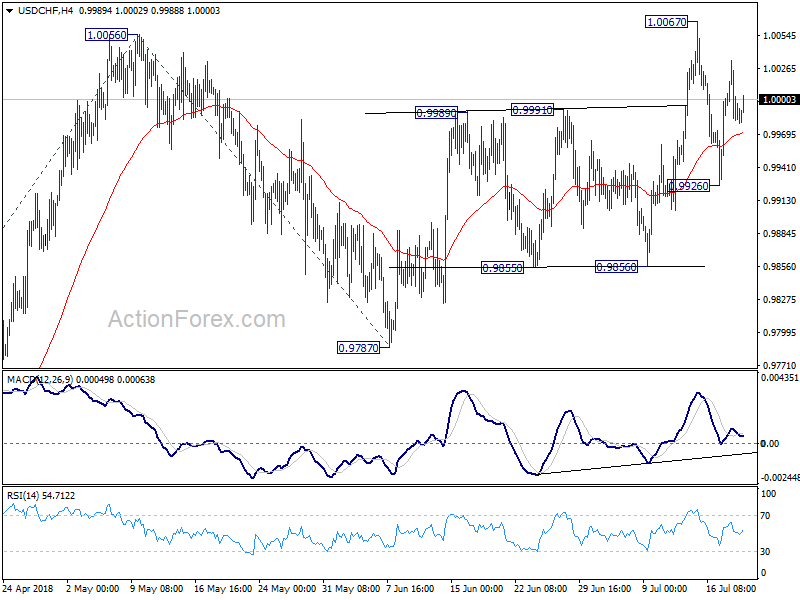
USD/CHF cannot break through 1.0067 resistance and retreated. Intraday bias is turned neutral again. On the upside, break of 1.0067 will resume the larger rise from 0.9186. USD/CHF should then target 61.8% projection of 0.9186 to 1.0056 from 0.9787 at 1.0325, which is close to 1.0342 key resistance. However, break of 0.9926 will dampen the bullish view again.
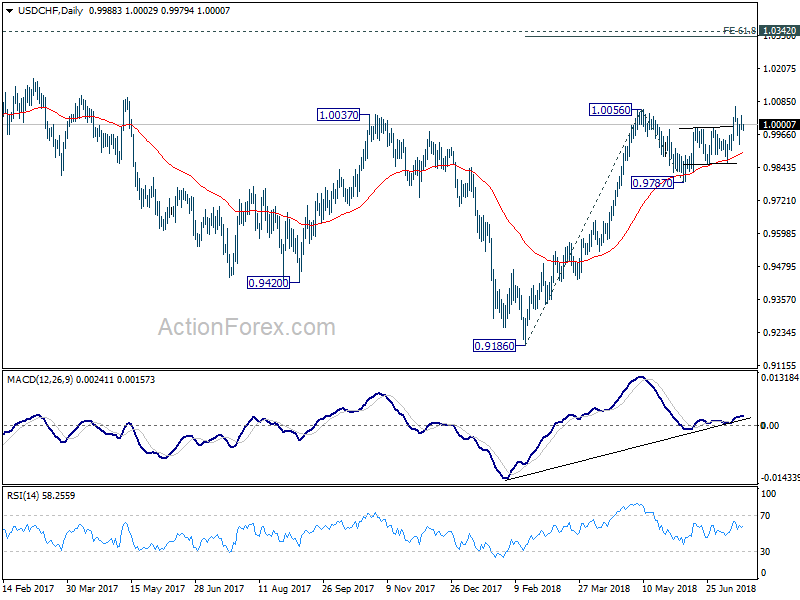
In the bigger picture, rise from 0.9186 is seen as a leg inside the long term range pattern. After drawing support from 55 day EMA, it's now resuming for 1.0342 key resistance. For now, we'd still cautious on strong resistance from there to limit upside. Meanwhile, break of 0.9787 support is needed to signal completion of the rise. Otherwise, outlook will remain bullish even in case of deep pull back.
USD/JPY Daily Outlook
Daily Pivots: (S1) 112.64; (P) 112.89; (R1) 113.09; More...
Intraday bias in USD/JPY remains neutral for consolidation below 113.13 temporary top. But near term outlook stays bullish with 112.21 support intact. Current rally from 104.62 should target 61.8% projection of 104.62 to 111.39 from 109.36 at 113.54 first. Break will put focus on 114.73 key resistance for confirming our bullish medium term view. On the downside, break of 112.21 support however, will indicate short term topping and bring deeper pull back to 111.39 resistance turned support.
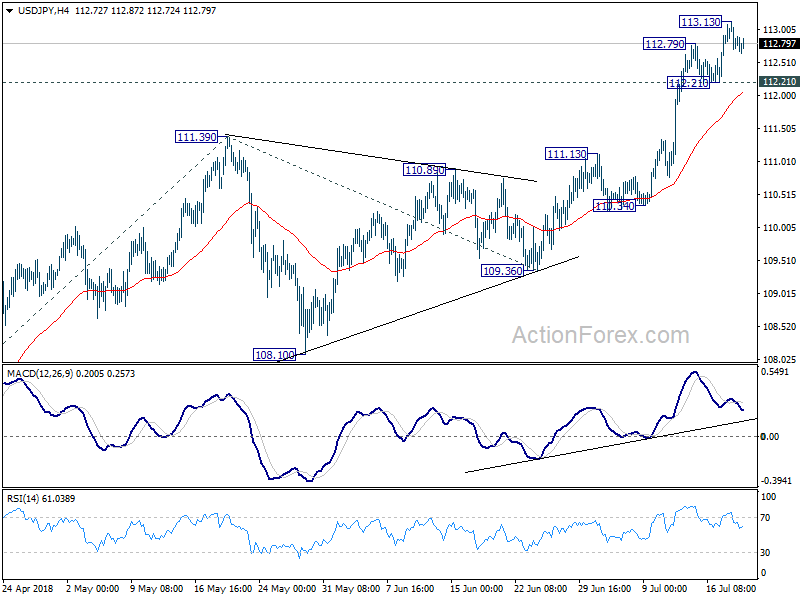
In the bigger picture, current development, with the solid break of medium term channel resistance from 118.65 (2016 high), affirm our view that corrective fall from there has completed with three waves down to 104.62. Decisive break of 114.73 resistance will likely resume whole rally from 98.97 (2016 low) to 100% projection of 98.97 to 118.65 from 104.62 at 124.30, which is reasonably close to 125.85 (2015 high). This will now be the preferred case as long as 119.36 support holds.
